
 ?Mathematical formulae have been encoded as MathML and are displayed in this HTML version using MathJax in order to improve their display. Uncheck the box to turn MathJax off. This feature requires Javascript. Click on a formula to zoom.
Abstract
This study examines the adaptive market hypothesis (AMH) in relation to time-varying market efficiency by using three tests, namely Generalized Spectral (GS), Dominguez-Lobato (DL) and the automatic portmanteau test (AP) test on four-digital currencies; Bitcoin, Monaro, Litecoin, and Steller over the sample period of 2014–2018. The study applies Jarque-Bera test, ADF test, Ljung-Box statistics and ARCH-LM test for testing normality of returns, stationarity of series, serial correlation and volatility clustering in returns and squared returns of selected cryptocurrencies. Further, the study adopts an extremely important category of martingale difference hypothesis (MDH), which uses non-linear methods of dependencies for identifying changing linear and non-linear dependence in the price movement of currencies. The results indicate that price movements with linear and nonlinear dependences varies over time. Our tests also reveal that Bitcoin, Monaro and Litecoin have the longest efficiency periods. While Steller shows the longest inefficient market period. In view of varying market conditions, the results indicate that different market periods have significant impact on prices fluctuations of cryptocurrencies. Therefore, our findings suggest implementing the adaptive market hypothesis (AMH) as predicting changes in cryptocurrency prices over time must consider the time-varying market conditions for efficient forecasting.
JEL classification:
PUBLIC INTEREST STATEMENT
This article determines the market efficiency of four widely used cryptocurrencies by applying Adaptive Market Hypothesis (AMH). The study claims that varying market conditions highly influences market efficiency and trading of cryptocurrencies. The data analysis of selected four cryptocurrencies (Litecoin, Steller, Monero and Bitcoin) revealed that market efficiency is highly volatile due to changing market situations, thus confirmed the AMH theory. We conclude by documenting that changes in cryptocurrency prices over time must consider the time-varying market conditions for efficient forecasting.
1. Introduction
Innovations are significant contributors of economic advancement and they bring better solutions to market with the help of latest financial revolutions (Khan, Mustafa, Khursheed, & Siddique, Citation2018; Kristoufek, Citation2013; Mustafa, Khursheed, & Fatima, Citation2018). Today, digital currencies propose an updated design of existing procedure of financial system. As it enables all internet users to exchange information, which is nearly cost free (Glaser, Zimmermann, Haferkorn, Weber, & Siering, Citation2014). Thus, digital currency transactions are gaining media attention due to its unique strands and rapid progression in recent years. Academic interests in anonymous electronic payments started from early 1980s, and digital cash, the first digital currency was introduced in 1990, which offered reduction in transaction cost with anonymity through cryptographic procedures (Briere, Oosterlinck, & Szafarz, Citation2015). This anonymous electronic monetary system was primarily introduced by Nakamoto (Citation2008) who designed cryptocurrency based on blockchain technology, termed Bitcoin and launched the software that lead to the spectacular development of bitcoin network. Cryptocurrencies are decentralized form of digital currencies, which requires encryption to authenticate transactions (Buchholz, Delaney, Warren, & Parker, Citation2012). For cryptocurrency market, past researchers have highlighted the significance of analyzing its market efficiency. Therefore, to analyze the changes in the cryptocurrency prices over time, it is crucial to understand the time-varying market efficiency.
As the market efficiency is one of the crucial concepts that have been widely researched in the neoclassical finance. In view of past, Fama (Citation1965), Malkiel & Fama (Citation1970) and Roberts (Citation1967) have introduced the phenomenon of market efficiency and efficient market hypothesis. Markets are considered efficient if the available information if completely reflected by prices (Malkiel & Fama, Citation1970).
However, market efficiency is classified into three categories; weak, semi-strong and strong form of efficiency dependent on the nature of information. The weak form of efficiency determines whether all the information in the past market data (e.g. short sales data, trading volume) are reflected by the market prices (Rizvi, Aun, & Arshad, Citation2017). This weak form of efficiency is tested by several researchers over the last three decades. Findings of some research studies inferred strong evidence regarding weak form of efficiency while some claimed against it. However, the scope of these research studies was limited to test only market efficiency.
Resultantly, a new perspective regarding the varying nature of market was introduced by Lo (Citation2004) by using Adaptive Market Hypothesis (AMH). The AMH determines the existence of market efficiency and inefficiencies in a logically consistent way. As the market efficiency evolves over time in AMH in contrast to EMH. Lo (Citation2004) analyzed the time-varying feature of efficiency and determined that AMH is more reliable method than EMH as it states that human errors can lead to arbitrage prospects to exist in specific time periods and these prospects vanish once they are exploited. However, past studies have not formally explained the AMH due to its abstract and qualitative nature, but its practical contributions have been widely explored to present the adaptive nature of markets. Its first implication states that the association between reward and risk is highly unstable. Its second implication states that investing opportunities vary over time. Third implication describes that investment strategies are influenced by varying business situations. Fourth implication states that the key to survival in the market depends on adapting varying market situations (Lo, Citation2004). Further, literature suggests that AMH cannot replace EMH. However, AMH supports the empirical variation of the EMH. Such as time-varying efficiency of stocks or digital currency could be better analyzed in the context of AMH implications.
For cryptocurrency markets, a large body of researchers analyzed the weak form of Efficient Market hypothesis (EMH) of Malkiel and Fama (Citation1970). Efficient Market Hypothesis assumes that market efficiency is stable over a certain time period and all markets exist in two conditions; efficient or inefficient. However, this concept of market efficiency was strongly criticized by Grossman and Stiglitz (Citation1980) as they stated that the presence of a competent market is impossible, because if the prices reflect all available information, then investors would not be concerned about costly acquisition of information.
Therefore, over the efficiency of cryptocurrency markets, a controversy exists between opponents and proponents of the EMH. For instance, Bariviera (Citation2017), Nadarajah and Chu (Citation2017), and Tiwari, Jana, Das, and Roubaud (Citation2018) concluded that the Bitcoin market is almost competent as it reflects all known information. In contrast, Kurihara and Fukushima (Citation2017) examined the calendar anomalies in digital currencies and found strong evidence against Efficient Market Hypothesis (EMH) by documenting significant day-of-the-week impact. Albeit, they anticipate that by an increase in trading volume and transactions the digital currency will be more informationally efficient. Similarly, Al-Yahyaee, Mensi, and Yoon (Citation2018), Cheah, Mishra, Parhi, and Zhang (Citation2018), Urquhart and McGroarty (Citation2016), and Urquhart and McGroarty (Citation2015) presented skeptical empirical findings that do not support the EMH for Bitcoin market. One of the main reason for this controversy is that competence varies over time.
1.1. Adaptive market hypothesis and market efficiency
Past researchers have explored the relationship between market efficiency and the AMH but their scope was limited to determine certain implications of AMH. Charles, Darné, & Kim (Citation2012) confirmed the implications of AMH by testing Martingale difference hypothesis with variance ratio and automatic portmanteau tests and reported that returns are predictable over a certain period. Likewise, Lim, Luo, and Kim (Citation2013) stated that varying nature of predictable patterns over time confirms AMH by using wild bootstrap automatic variance ratio and automatic portmanteau Box-Pierce test. Further, Urquhart and McGroarty (Citation2016), also applied variance ratio test on moving window (fixed length) and found that in stock market, return predictions vary over a period of time supporting the AMH. Using GARCH-M, Charfeddine and Khediri (Citation2016) examined the weak-form of market efficiency by applying rolling technique sample test over long-memory factors. They supported the AMH by reporting that the GCC markets have various degrees of changing market efficiency.
Several researchers have also analyzed the AMH on different asset classes and in stock market, for example: stocks by Urquhart and McGroarty (Citation2015), Kim, Shamsuddin, and Lim (Citation2011), and Urquhart and McGroarty (Citation2016) and currencies by Cialenco and Protopapadakis (Citation2011) and Neely, Weller, and Ulrich (Citation2009) and reported that AMH is an efficient predictor. Cryptocurrencies have become an area of interest for the media, investors and regulators. Practitioners and government authorities appreciate some of their features, such as independence from sovereign authorities and technological innovation.
Interestingly, many cryptocurrencies offer outstanding price growth in relatively short periods, exceeding hundred percent levels (Kristoufek, Citation2013), but with extreme volatility (Chu, Chan, Nadarajah, & Osterrieder, Citation2017; Katsiampa, Gkillas, & Longin, Citation2018; Kristjanpoller & Minutolo, Citation2018; Urquhart, Citation2017). Importantly, there has been a remarkable rise in their market value and the number of transactions. For example, Bitcoin’s market value exceeded 250$ billion at the beginning of 2018Footnote1 and trading volume for the same year reached $2 trillion.Footnote2 Increase in prices and trading activities is seen in other leading cryptocurrencies such as Litecoin and Ethereum. From early 2017 to December 2017, the overall market value of all cryptocurrencies spiked from $18 billion to around $600 billion (Bouri, Lau, Lucey, & Roubaud, Citation2018).
In this study, first, we determine the efficiency of AMH using four-significant digital currencies, namely; Bitcoin, Monaro, Litecoin, and Steller. These currencies are selected based on their similar key characteristics, which are highly tradable, fast processing and privacy oriented as pointed by past studies (Chu et al., Citation2017; Kristjanpoller & Minutolo, Citation2018; Urquhart, Citation2017). The market efficiency variation in these currencies is examined over a period ranging from 2014 to 2018. Second, we examined the non-normality and stationarity of series by applying Jarque-Vera and ADF test. Further, for determining the serial correlation and volatility clustering in returns and squared returns of cryptocurrencies we applied Ljung-Box statistics and ARCH-LM test. Third, we used Generalized Spectral (GS) test of Escanciano and Velasco (Citation2006) and Dominguez-Lobato (DL) test of Domínguez and Lobato (Citation2003) to examine martingale difference hypothesis (MDH) and to identify changing linear and non-linear dependence in the selected cryptocurrencies’ price movements. While for examining the autocorrelation, we applied the automatic portmanteau test (AP) that also confirms that no positive and negative correlations void each other.
2. Empirical analysis
This study uses the daily prices of Bitcoin, Monaro, Litecoin, and Steller. The data ranging from January 2014 to December 2018 and Figure shows the price fluctuation of each cryptocurrency examined in this study.
Figure 1. Prices of Cryptocurrencies
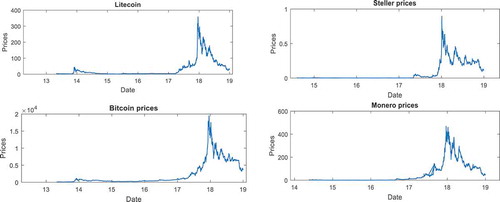
The data is retrieved from https://www.coindesk.com/price. Due to different starting dates for each cryptocurrency, the number of observations vary among all cryptocurrencies as shown in Table . We renovate the raw data to calculate logarithmic percentage returns by using formula: . Table represents the descriptive statistics based on daily percentage returns of four cryptocurrencies. The statistics show that all return series’ distributions are positively skewed, except the distribution of Litecoin’s returns, which is negatively skewed. The excess kurtosis showing that returns’ distribution have heavier tail.
Table 1. Summary statistics of cryptocurrencies returns
The significance of Jarque-Bera test reveals non-normality of returns series in all cases, ADF test confirms the stationarity of series. Serial correlation and volatility clustering is present in returns and squared returns of all cryptocurrencies as shown by the results of Ljung-Box statistics and ARCH-LM test in Table .
3. Methodology
This study examines the market efficiency by analyzing four-digital currencies; Bitcoin, Monaro, Litecoin, and Stellar for the differing periods during 2014 to 2018. Based on data availability the study examines Bitcoin and Litecoin for the period from 2014 to 2018. While Steller and Monero are studied for the period from 2015–2018. This study adopts an extremely important category of martingale difference hypothesis (MDH) tests, which uses non-linear methods of dependencies that consists of Generalized Spectral (GS) test and Dominguez-Lobato (DL) test. For examining the changes in the market efficiency of cryptocurrencies over time, this study has adopted one of the most suitable autocorrelation testing approaches, the automatic portmanteau test (AP). This test examines autocorrelation as it considers that if the time series data are significantly correlated then market efficiency is lower.
Under the condition of heteroscedasticity and non-normality, these tests do not implicate size distortion issues, give robust result, and are most relevant for time series data. This makes them better than other conventional processes of linear and non-linear methodologies (see, e.g. Charles et al., Citation2011; Ghazani & Ebrahimi, Citation2019; Khuntia & Pattanayak; Citation2018). The Kolmogorov–Smirnov and Cramervon–Mises statistics formulate the basics of DL test (Darling, Citation1957), stated as:
where p represents a positive integer and is an indicator function.
The GS test supposes dependencies at all lags, permits conditional heteroscedasticity, and is dependable with wide-ranging independent and identically distributed orders. The spectral distribution function of the GS test is to test the null of martingale order, which is stated as,
where is any real number between 0 and 1.
The distributional function of GS follows the value of and the statistics to test the null of dependencies can be estimated as:
To compute the distance between and zero for all possible values of
. The Cramer-von Mises norm followed by Escanciano and Velasco (Citation2006) suggested to find
statistics s follows:
The null hypothesis of this test is rejected when value is relatively higher than the critical value.
4. Empirical findings
To obtain the evidence regarding the evolving efficiency of Bitcoin price movement, we have used daily observations. The result of estimated p-values of Dominguez-Lobato (DL) and Generalized Spectral (GS) for Bitcoin is shown in Figures and , respectively.
Figure 2. P-values of Dominguez-Lobato test of Bitcoin
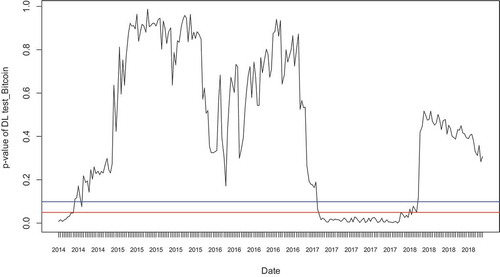
The p-values of Dominguez-Lobato test of Bitcoin reveal efficiency periods from November 2014 to January 2017 and from April to December 2018. While the inefficiency periods range from May to October 2014 and from February 2017 to March 2018. This graph reveals that Bitcoin remained efficient in the market for a longer period. This outcome also provides evidence to the findings of past studies that reported Bitcoin is most efficient and widely used cryptocurrency and it offers a universal payment method (Buchholz et al., Citation2012; Tiwari et al., Citation2018; Urquhart, Citation2017).
Figure 3. P-value of Generalized Spectral Test of Bitcoin
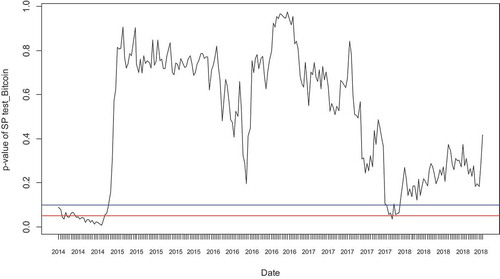
Figure depicts the Generalized Spectral test results, which reveals the efficiency periods from January 2015 to December 2017 and from February 2018 to onwards. The inefficiency periods include 2014 and from December 2017 to January 2018. Thus, confirming the long market efficiency period of Bitcoin. While the DL and GS test results are slightly different for Bitcoin price movements.
Figure 4. Stats of Automatic Portmanteau Test of Bitcoin
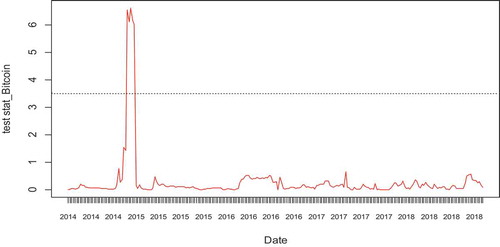
Figure presents the stats of automatic portmanteau test of bitcoin currency. The objective of AP test is to ensure that no positive and negative correlations void each other. The figure depicts test statistics shown in red fluctuating line and the F-statistics are shown in black-dotted line with 5% level of significance. The figure shows that the market was stable in 2014, while in from November 2014 to March 2018 the market became unstable and the AP test statistics presented the peak of market inefficiency period for bitcoin. Then, the variations in market conditions reduced from March 2015 to December 2018 and the market remained efficient for bitcoin trading. The figure also provides evidence for AMH theory that the market efficiency is highly dependent on market conditions.
Figure 5. P-values of Dominguez-Lobato Test of Monero
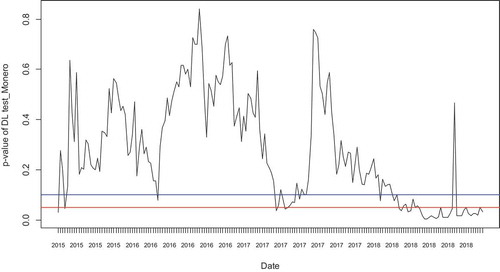
Figure shows DL test results for Monero price movements and shows that the efficiency periods are from May 2015 to March 2016, May 2016 to March 2017, and from August 2017 to January 2018. The inefficiency periods range for the periods March 2015 to April 2015, April 2016, May to July 2017, February to August 2018 and from October to December 2018. The presence of several spikes in the figure shows that the efficiency periods of Monero currency are extremely volatile in relation to changing market conditions. Therefore, the outcome supports the AMH since the prediction of cryptocurrency prices varies over time.
Figure 6. P-values of Generalized Spectral test of Monero
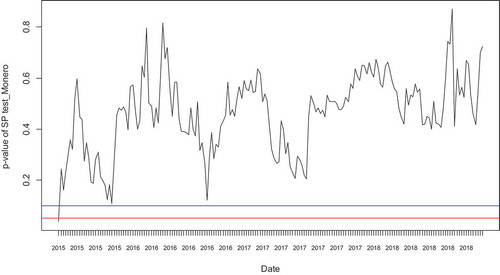
The Generalized Spectral test of Monero (Figure ) reveals that the efficiency periods for the Monero currency price movements span almost the full sample period from July 2015 to December 2018. The only inefficiency period is at the beginning of June 2015. This confirms the findings of past studies, which revealed that Monero is one of the leading privacy-centric cryptocurrencies grounded on the Crypto-note protocol and carries strong market value (Chaim & Laurini, Citation2019; Möser et al., Citation2018).
Figure 7. Stats of Automatic Portmanteau Test of Monero
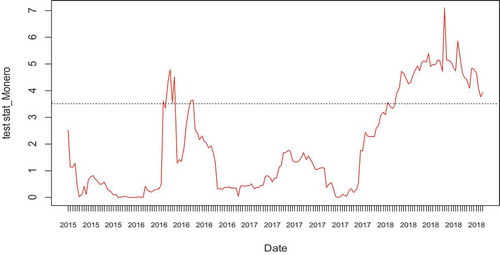
Figure presents the stats of automatic portmanteau test of Monero currency. The figure depicts test statistics shown in red fluctuating line and the F-statistics are shown in black-dotted line with 5% level of significance. This figure presents that market efficiency periods were highly unstable for Monero currency as several spikes are visible for the time-period from 2015 to 2018. While the peak inefficacy periods are depicted in 2016 (April—June) and from April 2018 to December 2018. This shows that the market was very unfavorable for Monero in the inefficient periods reflected in Figure . Thus, the result proves that market efficiency is influenced by market conditions, confirming AMH theory.
Figure 8. P-values of Dominguez-Lobato test of Litecoin
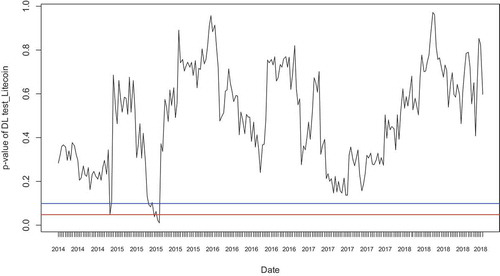
The time-varying p-values of DL test of Litecoin are shown in Figure . It shows that the efficiency periods for Litecoin range from May 2014 to November 2014, February 2015 to May 2015, and from September 2015 to December 2018. The inefficiency periods for Litecoin are from December 2014 to January 2015 and from June to September 2015.
Figure 9. P-value of Generalized Spectral Test of Litecoin
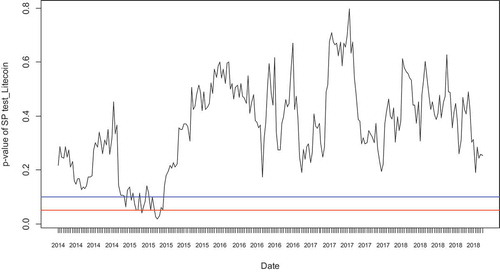
Similarly, the p-values of GS test in Figure show that Litecoin remained mostly in the efficient zone during the period starting in May 2014. The only time period when the Litecoin remained below the efficient zone was from January 2015 to June 2015. This figure reveals that in comparison to other cryptocurrencies, Litecoin has the strongest market value in terms of market efficiency and also confirms the findings of past studies that stated cryptocurrency market has higher predictability power over stock market (Bouri et al., Citation2018; Kristoufek, Citation2013).
Figure 10. Stats of Automatic Portmanteau Test of Litecoin
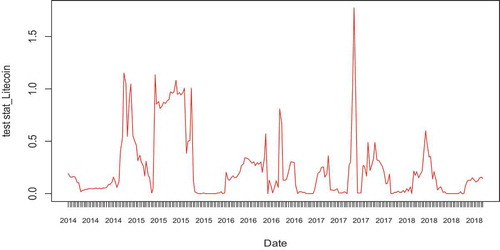
Figure presents the stats of automatic portmanteau test of Litecoin currency. This figure presents that market efficiency periods were highly unstable for Litecoin currency as several fluctuations in market conditions are visible for the time-period from 2014 to 2018. While the peak inefficacy periods are depicted from December 2014 to September 2015 and in 2017 (July—September). This reflects that for Litecoin the market was extremely volatile due to varying market conditions that ultimately affected the Litecoin currency.
Figure 11. P-values of Dominguez–Lobato Test of Steller
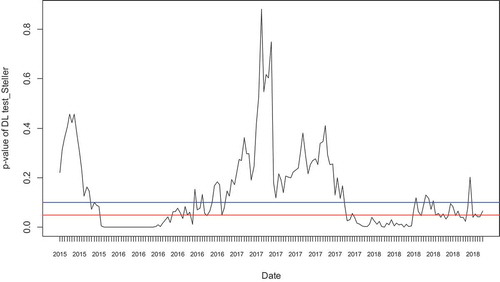
The p-values of DL test for Steller are shown in Figure . The DL test shows that its efficiency period ranges from September 2015 to November 2015 and from January 2017 to May 2017. The inefficiency period ranges from December 2015 to December 2016 and from April 2017 to December 2018. The primary benefit of the Stellar is its cost-effective feature, which makes it a perfect option for micro-payments. However, as its focus is mainly on developing markets, which carries highly volatile market conditions. Therefore, the result reveals extreme volatility in the figure and also shows the longest inefficiency period which also provides an evidence regarding the strong influence of volatile market conditions on the returns and squared returns all cryptocurrencies.
Figure 12. P-values of Generalized Spectral Test
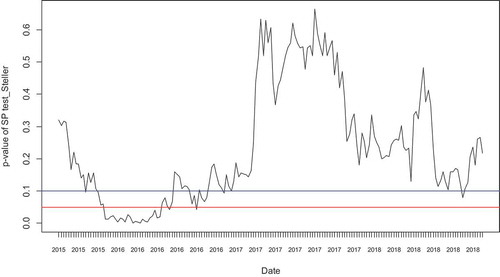
The p-values of GS test (Figure ) show that the efficiency period of Steller ranges from September 2015 to November 2015, March 2017 to September 2018 and from November 2018 to December 2018. The inefficiency period ranges from December 2015 to February 2017 and in October 2018. The result reveals that Steller has highest volatility in 2017. However, it has the longest market inefficiency period, which shows that Steller has lowest market value and number of trade transactions in comparison to other three currencies analyzed in this study.
Figure 13. Stats of Automatic Portmanteau Test of Steller
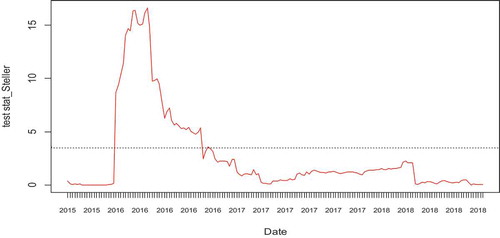
Figure presents the stats of automatic portmanteau test of Steller currency. The figure depicts test statistics shown in red fluctuating line and the F-statistics are shown in black dotted line with 5% level of significance. This figure shows that the market was efficient in the beginning that is from July 2015 to February 2016. Then, the figure presented the peak of inefficiency period from March 2016 to September 2016 for Steller currency and from October 2016 to December 2018 the market remained efficient as the variations lessened over this span of time. Further, the figure also shows that no positive and negative correlations cancelled out the effect of each other.
5. Discussion and conclusion
Cryptocurrencies are the latest financial instruments with unique and innovative characteristics. They have no underlying assets, which is considered as one of the most interesting feature, they carry no dividends or interest and are not issued by governments. However, cryptocurrencies are gaining considerable attention and several merchants are accepting payments in cryptocurrencies. There is growing interest among users and academicians due to its evolving price and volatility.
This study examines price fluctuations among four-digital currencies traded in the world’s largest stock markets by testing the AMH on data for the period ranging from 2014 to 2018. Among the selected four-digital currencies, four currencies reveal in Generalized Spectral test results the longest efficiency periods of approximately 4 years, which includes Bitcoin, Monero and Litecoin. The Dominguez–Lobato test of Litecoin currency also indicates longest efficiency period as its p-values lie above the threshold of 0.05 and 0.1 significance level for the longest period. While the longest inefficiency periods of approximately 3 years are depicted by Dominguez-Lobato test results of Litecoin. The automatic portmanteau test (AP) reveals that the market efficiency is dependent on the market conditions, thus confirming AMH theory and its significance for cryptocurrencies market. Our study reports that the price movements with linear and nonlinear dependences change over time. Our results further reveal significant impact of market periods on price fluctuations; however, this impact differentiates based on market conditions.
The results recommend that market adapts in different ways over time and responds to varying market conditions differently. This outcome also supports findings of Tiwari et al. (Citation2018) and Bariviera (Citation2017), who found existence of time-varying dependencies (long-range). However, it is in contrast to the results found by Jiang, Nie, and Ruan (Citation2018). Our results support that of Caporale, Plastun, and Oliinyk (Citation2018), who reveal abnormal behavior of digital currencies, that efficiency/inefficiency develops with the advancement of market frictions. However, our findings are in contrast to the results reported by Brauneis and Mestel (Citation2018), who found that market, is either efficient or inefficient after analyzing 73 digital currencies.
The empirical analysis of our study confirms that prices of digital currencies are dependent on market conditions and it does not follow efficient market hypothesis. As it was found that linear and non-linear dependencies in price movements of selected currencies were higher and lower in different periods. The detailed analysis provides evidence regarding the significance of the impact of market situations on prices of cryptocurrencies. The study also reveals that with Bitcoin showing lesser variation than Litecoin, Monero and Steller can be preferred as the optimal investment option and this is confirmed through AP test statistics. This study corroborates the evolving efficiency in the price movement of digital currencies and determines that the proof of dynamic efficiency follows AMH. There are a very few number of market efficiency studies particularly on Monero, Litecoin, and Steller. This study will, therefore, prove beneficial for portfolio managers and market participants in a number of ways.
Correction
This article has been republished with minor changes. These changes do not impact the academic content of the article.
Additional information
Funding
Notes on contributors
Ambreen Khursheed
Ambreen Khursheed is aLecturer and PhD scholar at UCP Business School. She is a MS qualified (Gold Medalist) with majors in Finance. Her expertise includes high commands over the areas of Finance and Econometrics.
Dr. Muhammad Naeem is Assistant Professor at the University of Central Punjab. He holds a PhD in Mathematics at “Sapienza” University of Rome, Italy. His research focuses on financial mathematics, econometrics and forecasting of financial time series.
Dr. Sheraz Ahmed is working as Associate Professor at the LUT University, School of Business and Management. His research areas include emerging markets finance, market microstructure, and corporate transparency practices of global listed companies. He holds PhD from Hanken School of Economics, Helsinki, Finland.
Dr. Faisal Mustafa is Provost at University of Central Punjab. He has 18 years’ international career as Professor (Dean), Data Scientist, Senior BI, Consultant, IT Transformation Director and as a Lead researcher. He received his PhD from University of Huddersfield, UK. His research focuses on, Business Intelligence, Semantic Web services, and Business Simulation Modeling.
Notes
Related Research Data
References
- Al-Yahyaee, K. H., Mensi, W., & Yoon, S. M. (2018). Efficiency, multifractality, and the long-memory property of the Bitcoin market: A comparative analysis with stock, currency, and gold markets. Finance Research Letters, 27, 228–15. doi:10.1016/j.frl.2018.03.017
- Bariviera, A. F. (2017). The inefficiency of Bitcoin revisited: A dynamic approach. Economics Letters, 161, 1–4. doi:10.1016/j.econlet.2017.09.013
- Bouri, E., Lau, C. K. M., Lucey, B., & Roubaud, D. (2018). Trading volume and the predictability of return and volatility in the cryptocurrency market. Finance Research Letters. doi:10.1016/j.frl.2018.08.015
- Brauneis, A., & Mestel, R. (2018). Price discovery of cryptocurrencies: Bitcoin and beyond. Economics Letters, 165, 58–61. doi:10.1016/j.econlet.2018.02.001
- Briere, M., Oosterlinck, K., & Szafarz, A. (2015). Virtual currency, tangible return: Portfolio diversification with bitcoin. Journal of Asset Management, 16(6), 365–373. doi:10.1057/jam.2015.5
- Buchholz, M., Delaney, J., Warren, J., & Parker, J. (2012). Bits and bets, information, price volatility, and demand for Bitcoin. Economics, 312, 2–48.
- Caporale, G. M., Plastun, O., & Oliinyk, V. (2018). Bitcoin Fluctuations and the Frequency of Price Overreactions. CESifo Working Paper No. 7280. Retrieved from https://ssrn.com/abstract=3338605
- Chaim, P., & Laurini, M. P. (2019). Nonlinear dependence in cryptocurrency markets. The North American Journal of Economics and Finance, 48, 32–47. doi:10.1016/j.najef.2019.01.015
- Charfeddine, L., & Khediri, K. B. (2016). Time varying market efficiency of the GCC stock markets. Physica A: Statistical Mechanics and Its Applications, 444, 487–504. doi:10.1016/j.physa.2015.09.063
- Charles, A., O. Darné, and J. Fouilloux. (2011). Testing the Martingale Difference Hypothesis in CO2 Emission APPLIED ECONOMICS LETTERS 5 Allowances. Economic Modelling, 28(1–2), 27–35. doi:10.1016/j.econmod.2010.10.003
- Charles, A., Darné, O., Kim, J. H. (2012). Exchange-rate return predictability and the adaptive markets hypothesis: Evidence from major foreign exchange rates. J. Int. Mon. Finance, 31, 1607–1626
- Cheah, E. T., Mishra, T., Parhi, M., & Zhang, Z. (2018). Long memory interdependency and inefficiency in Bitcoin markets. Economics Letters, 167, 18–25. doi:10.1016/j.econlet.2018.02.010
- Chu, J., Chan, S., Nadarajah, S., & Osterrieder, J. (2017). GARCH modelling of cryptocurrencies. Journal of Risk and Financial Management, 10(4), 17. doi:10.3390/jrfm10040017
- Cialenco, I., & Protopapadakis, A. (2011). Do technical trading profits remain in the foreign exchange market? Evidence from 14 currencies. Journal of International Financial Markets, Institutions and Money, 21(2), 176–206. doi:10.1016/j.intfin.2010.10.001
- Darling, D. A. (1957). The kolmogorov-smirnov, cramer-von mises tests. The Annals of Mathematical Statistics, 28(4), 823–838. doi:10.1214/aoms/1177706788
- Domínguez, M. A., & Lobato, I. N. (2003). Testing the martingale difference hypothesis. Econometric Reviews, 22(4), 351–377. doi:10.1081/ETC-120025895
- Escanciano, J. C., & Velasco, C. (2006). Generalized spectral tests for the martingale difference hypothesis. Journal of Econometrics, 134, 151–185. doi:10.1016/j.jeconom.2005.06.019
- Fama, E. F. (1965). The behavior of stock market prices. The Journal of Business, 38, 34–105. doi:10.1086/jb.1965.38.issue-1
- Ghazani, M. M., & Ebrahimi, S. B. (2019). Testing the adaptive market hypothesis as an evolutionary perspective on market efficiency: Evidence from the crude oil prices. Finance Research Letters, 30, 60–68. doi:10.1016/j.frl.2019.03.032
- Glaser, F., Zimmermann, K., Haferkorn, M., Weber, M. C., & Siering, M. (2014). Bitcoin-asset or currency? revealing users’ hidden intentions. Revealing Users’ Hidden Intentions (April 15, 2014). ECIS.
- Grossman, S. J., & Stiglitz, J. E. (1980). On the impossibility of informationally efficient markets. The American Economic Review, 70(3), 393–408.
- Jiang, Y., Nie, H., & Ruan, W. (2018). Time-varying long-term memory in Bitcoin market. Finance Research Letters, 25, 280–284. doi:10.1016/j.frl.2017.12.009
- Katsiampa, P., Gkillas, K., & Longin, F. (2018, May 1). Cryptocurrency market activity during extremely volatile periods. Retrieved from https://ssrn.com/abstract=3220781.
- Khan, A. A., Mustafa, F., Khursheed, A., & Siddique, F. (2018). Social business innovation: Comparison of operational efficiency of microfinance institutions in Pakistan. Pyrex Journal of Business and Finance Management Research, 4(3), 12–20.
- Khuntia, S., & Pattanayak, J. K. (2018). Adaptive market hypothesis and evolving predictability of bitcoin. Economics Letters, 167, 26–28. doi:10.1016/j.econlet.2018.03.005
- Kim, J. H., Shamsuddin, A., & Lim, K.-P. (2011). Stock return predictability and the adaptive markets hypothesis: Evidence from century-long U.S. data. Journal of Empirical Finance, 18, 868. doi:10.1016/j.jempfin.2011.08.002
- Kristjanpoller, W., & Minutolo, M. C. (2018). A hybrid volatility forecasting framework integrating GARCH, artificial neural network, technical analysis and principal components analysis. Expert Systems with Applications, 109, 1–11. doi:10.1016/j.eswa.2018.05.011
- Kristoufek, L. (2013). BitCoin meets Google Trends and Wikipedia: Quantifying the relationship between phenomena of the Internet era. Scientific Reports, 3. doi:10.1038/srep03415
- Kurihara, Y., & Fukushima, A. (2017). The market efficiency of Bitcoin: A weekly anomaly perspective. Journal of Applied Finance and Banking, 7(3), 57.
- Lim, K.-P., Luo, W., & Kim, J. H. (2013). Are us stock index returns predictable? Evidence from automatic autocorrelation-based tests. Applied Economics, 45, 953–962. doi:10.1080/00036846.2011.613782
- Lo, A. (2004, September). The adaptive market hypothesis: Market efficiency from an evolutionary perspective. The Journal of Portfolio Management, 30, 15. doi:10.3905/jpm.2004.442611
- Malkiel, B. G., & Fama, E. F. (1970). Efficient capital markets: A review of theory and empirical work. The Journal of Finance, 25(2), 383–417. doi:10.1111/j.1540-6261.1970.tb00518.x
- Möser, M., Soska, K., Heilman, E., Lee, K., Heffan, H., Srivastava, S., & Christin, N. (2018). An empirical analysis of traceability in the Monero blockchain. Proceedings on Privacy Enhancing Technologies, 2018(3), 143–163. doi:10.1515/popets-2018-0025
- Mustafa, F., Khursheed, A., & Fatima, M. (2018). Impact of global financial crisis on financially innovative microfinance institutions in South Asia. Financial Innovation, 4(1), 1–11. doi:10.1186/s40854-018-0099-8
- Nadarajah, S., & Chu, J. (2017). On the inefficiency of Bitcoin. Economics Letters, 150, 6–9. doi:10.1016/j.econlet.2016.10.033
- Nakamoto, S. (2008). Bitcoin: A peer-to-peer electronic cash system. Retrieved from http://bitcoin. org/bitcoin. pdf
- Neely, C. J., Weller, P. A., & Ulrich, J. M. (2009). The adaptive markets hypothesis: Evidence from the foreign exchange market. Journal of Financial and Quantitative Analysis, 44(2), 467–488. doi:10.1017/S0022109009090103
- Rizvi, S., Aun, R., & Arshad, S. (2017). Analysis of the efficiency–integration nexus of japanese stock market. Physica A: Statistical Mechanics and Its Applications, 470, 296–308. doi:10.1016/j.physa.2016.11.142
- Roberts, H. V. (1967). Statistical versus clinical prediction of the stock market. unpublished manuscript. Chicago: Centre for Research in Security Prices, University of Chicago.
- Tiwari, A. K., Jana, R. K., Das, D., & Roubaud, D. (2018). Informational efficiency of Bitcoin—An extension. Economics Letters, 163, 106–109. doi:10.1016/j.econlet.2017.12.006
- Urquhart, A. (2017). Price clustering in Bitcoin. Economics Letters, 159, 145–148. doi:10.1016/j.econlet.2017.07.035
- Urquhart, A., & McGroarty, F. (2015). The adaptive market hypothesis and stock return predictability: Evidence from major stock indices. Retrieved from https://ssrn.com/abstract=2640934
- Urquhart, A., & McGroarty, F. (2016). Are stock markets really efficient? Evidence of the adaptive market hypothesis. International Review of Financial Analysis, 47, 39–49. doi:10.1016/j.irfa.2016.06.011