
 ?Mathematical formulae have been encoded as MathML and are displayed in this HTML version using MathJax in order to improve their display. Uncheck the box to turn MathJax off. This feature requires Javascript. Click on a formula to zoom.
Abstract
In this research, we test whether common trading oscillators can outperform the buy-and-hold strategy (B&H) using six popular ETFs for the period of the last 20 years. We use the original setups of those oscillators and also other setups or oscillators combinations in order to achieve the best past performances. We found that the Relative Strength Index (RSI) combined with Chaikin Money Flow (CMF) gained positive returns for all examined ETFs and also outperformed by 79% the corresponding buy-and-hold strategy for the XLF. The Commodity Channel Index (CCI) and Bollinger Bands (BB) were found to be the best technical tools for trading the examined ETFs. While the CCI performs better for the more volatile ETFs (XLF and XLK), the BB was superior for trading IWM and XLI which are less volatile. We also recommend the CCI strategy for trading the SPY. No technical tools were found to be more effective than B&H strategy for the QQQ.
PUBLIC INTEREST STATEMENT
Technical oscillators are mathematical calculations that were designed to help traders better understand the financial asset price trend and momentum in order to improve trading returns. This approach is the basic for the technical analysis theory and applications. There are many such technical tools, however some have failed to produce higher returns than the traditional buy-and-hold strategy. This research tests the efficiency of well-known technical tools integrated into an algorithmic trading system design to trade six popular U.S ETFs and recommend on the most efficient setups for those tools. The paper also indicates that no technical tools were found to be more effective than buy-and-hold strategy for the Nasdaq QQQ popular ETF.
1. Introduction and literature review
Well-known trading oscillators are commonly used by investors to help them achieve better performance arising from stocks or ETFs trading. These trading tools are usually being used according to the setups recommended by their initiators. However, some oscillators are frequently disappointing investors who apply them and lead them to substantial losses. In this study, we test the ability of popular trading oscillators to produce a better performance relative to the classical buy and hold (B&H) strategy using six well-known U.S. ETFs for the period from January 1999 to December 2018. For each individual ETF, we calculated the technical oscillators-based returns along with the B&H return from the first entry to a trading position (long or short) till the final exit from the last trade.
After testing the performance of each technical oscillator using their creator advised setups, we alter those setups and performed optimization procedures in order to achieve the best past performance. Moreover, we tested also different combinations of oscillators to examine whether a combination of oscillators improve past performances.
The Technical analysis approach, commonly used by practitioners, relies on historical data for the sake of forecasting prices in stock, commodity, foreign exchange, and future markets. Cohen, Kudryavtsev, and Hon-Snir (Citation2011) found in some survey-based research that professional and non-professional investors both use fundamental and technical analysis together to buy and sell stocks. Tylor and Allen (Citation1992) used a survey to inform that in the foreign exchange market, there is a skew towards reliance on technical, as opposed to fundamentalist, analysis at shorter horizons, which becomes steadily reversed as the length of horizon considered is increased. Neely, Weller, and Dittmar (Citation1997) using generic programming found strong evidence that technical trading rules can produce significant excess returns for each of six exchange rates over the period of 1981–1995.
Menkhoff (Citation2010) survey of fund managers shows that technical analysis is the most important form of analysis for forecasting short-term US equity market. Marshall, Rochester, and Cahan (Citation2008) study technical trading rules tested on SPDR (Standard & Poor’s Depositary Receipts) found that technical analysis is not profitable. Yamawaki and Tokuoka (Citation2007) analyzed the effectiveness of technical indicators on eight stocks traded at NYSE showed that moving average-based rules were convincingly profitable, and combination of indicators makes more accurate signals than any individual indicator. Zhu and Zhou (Citation2009) show that an investor might add value to his investment by using technical analysis, especially the Moving Average (MA), if he follows a fixed allocation rule that invests a fixed portion of wealth into the stock market, as dictated by the random walk theory of stock prices or by the popular mean–variance approach. Tylor (Citation2014) has applied momentum oscillators for the Dow Jones Industrial Average (DJIA) stock index over the period 1928–2012 and found that the momentum oscillators' performance depends on market conditions.
As appears in the literature review, there are clearly mixed opinions about the profitability of technical analysis that needs to be resolved. Our current research is trying to do just that by testing past performances of different oscillators' setups and also oscillators' combinations and compare them to the result of the B&H strategy for a very long period of time that consisted different economics environments.
The remainder of the paper proceeds as follows. Section 2 describes the research design. Section 3 describes the data and methods. Section 4 analyzes the findings, and Section 5 summarizes and concludes.
2. Research design and data
When considering a certain trading rule and its performance across time, one is expected to apply it for a sufficiently long period that includes different trading environments in the form of high vs. low volatile periods, and uptrend versus downtrend period. In this research, we tested common trading tools applied to 6 popular ETFs for almost 20 years of trading. First, we programmed each tool using the setups and guidance of their creator. Second, we alter the setups and optimized them in order to achieve maximum profit factor which is measured by the gross profit divided by the gross loss including commissions for the trading period. When the value of the profit factor is greater than one it indicates a profitable strategy and less than one indicates a losing trading strategy. Last, we combined certain technical tools to examine whether performances are improved using the combined oscillators. The tested technical oscillators were: Relative Strength Index, Stochastics, Moving Average Convergence Divergence (MACD), Commodity Channel Index (CCI), Chickling Money Flow (CMF) and Bollinger Bands (BB). We tested each oscillator separately and also tried different combinations of them in order to improve strategies performance. We use daily data for six US ETFs for the years 1999–2018. The ETFs examined in the present study are: SPY, QQQ, IWM, XLF, XLK and XLI that follow the S&P500, Nasdaq, Russel 2000, financial sector, technology sector and the industrial sector, respectively. All trading strategies were tested using daily data. Returns for the B&H strategy were calculated for each ETF from the initial oscillator-based entry to the position at 1999 till the last position exit in 2018. For each trading strategy, we recorded the number of closed trades taken, the profit factor and the percentage of gains/losses. We also recorded the volatility of each ETF's daily closing prices in order to examine whether different trading strategies' performances are volatility dependent.
After testing each examined technical oscillator using its creator suggested setup, we altered the setups using the following formulation:
where = Setup in step i +1,
=
.
For each individual setup that is generated through EquationEquation 1(1)
(1) the profit factorFootnote1 was calculated in order to reach optimization. Finally, we combined price momentum oscillators with volume-based momentum oscillator using the experience of traders that says that price movement alone cannot predict future movement and it needs volume approval. That notion means that when price trend occurs along with a high volume of trade, its potential continuation is greater than if it is not accompanied with high volume of trade. Our findings indicate that the CCI and BB are the best performing oscillators to trade the examined ETFs, while the RSI combined with CMF has also showed positive results.
3. Research results
3.1. The RSI
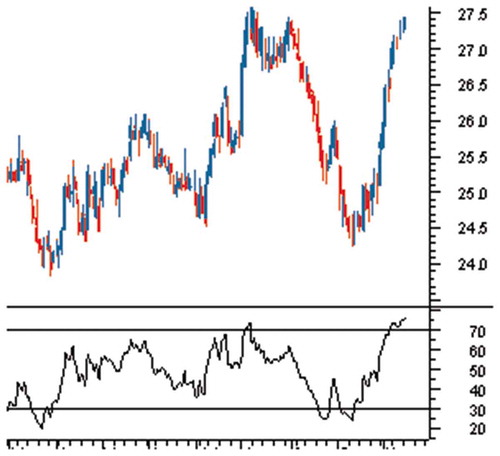
The Relative Strength Index (RSI) is a momentum indicator developed by Welles Wilder, Citation1978), which compares the magnitude of recent gains and losses over a specified time period to measure speed and change of price movements of a security. This index is primarily used in an attempt to identify overbought or oversold conditions in the trading of a security. The formula of the RSI reads as follows (EquationEquation 2(2)
(2) ).
where RS equal to the average gain of up periods during the specified time frame divided by the average loss of down periods.
The RSI provides a relative evaluation of the strength of a security’s recent price performance, thus making it a momentum indicator. RSI values range from 0 to 100. The default time frame for comparing up periods to down periods is 14, as in 14 trading days was suggested by Wilder himself in his book. Traditional usage of the RSI is according to its creator, when the RSI values are 70 or above it indicates that the security is becoming overbought, and therefore may be primed for a trend reversal. On the other side, if the RSI value is 30 or below, it should be interpreted as indicating an oversold condition that may signal a trend change or corrective price reversal to the upside. The rationality of overbought and oversold levels is common to many other technical oscillators, meaning that the momentum is approaching its pic and a price turnaround is about to occur in the near future. This does not mean that a price turnaround must occur immediately so those oscillators can hover over or below those levels for quite sometimes.
Figure 1. The Relative Strength Index
In order to put theory into real-life trading test, we computerized the RSI strategy according to its original levels of overbought and oversold and applied this trading strategy to almost 20 years of data. Table summarizes the result of RSI-based trading strategy versus buy-and-hold (B&H) returns of the tested ETFs. The buy-and-hold strategy results were calculated from the first entry to a position using the oscillator until the exit from the last position between 1.1.1999–30.3.2018.
Table 1. Original RSI-based trading results
Table shows a poor performance of the RSI setup for all tested ETFs. Not only the RSI-based returns failed to beat the B&H strategy, it produces a negative return for four out of six ETFs over the course of almost 20 years of trading.
Next, we altered and optimized the setups of the RSI and came up with the following setup: The optimal length of time to measure the RSI is 10 days (compared to the original 14) and the optimal overbought and oversold levels were found to be 62 and 38. These levels were found to be optimal for the examined ETFs. However, they might be different for other assets such as individual stocks.
Table demonstrates a significant improvement in the results of the RSI trading strategy. All six examined ETFs have gained a positive return exhibit by more than 1 profit factor, they all fail to beat the B&H strategy. It is important to note that the number of trades has risen dramatically for the optimal RSI-based trading strategy versus the original setup. Trying to improve the performance of the RSI performance, we incorporated into the trading strategy a money flow oscillator. The idea used here is that price alone is not enough for assets future movement prediction without a volume confirmation. From the available volume oscillators, we choose Chaikin Money Flow (CMF) Developed by Marc Chaikin as our volume indicator for its simplicity and effectiveness.
Table 2. Optimal RSI-based trading results
Chaikin money flow measures the amount of money flow Volume over a specific period. Money Flow Volume forms the basis for the accumulation distribution line. Instead of a cumulative total of money flow volume, Chaikin money flow simply sums money flow volume for a specific look-back period. Chartists look for crosses above or below the zero line to identify changes in money flow.
First, we tested the ability of CMF alone to outperform the B&H returns and got substantial inferior results that testify that CMF should not be used as a stand-alone technical oscillator to trade the examined ETFs. Second, we used the optimal setup found earlier for the RSI. In addition, we used CMF>0.05 for long and CMF<-0.05 for short trading in order to narrow false signal possible at CMF =0. The results of the RSI CMF based trading strategy is summerized in Table 3 below.
The profit factors of the trading strategy have risen for all six examined ETFs, postulating an improved performance for the RSI CMF strategy apposes to RSI alone based trading strategy. Still only for the XLF, the strategy has outperformed the B&H strategy.
Next, we tested other technical oscillators as a stand-alone or combined with the CMF according to the oscillator designer’s setups and also for other optimized setups. The Stochastics, moving averages and the MACD all failed to produce a better than B&H returns, some have also achieved negative returns for the tested period.
3.2. The CCI
Commodity Channel Index (CCI) is a momentum-based technical trading tool used most often to help determine overbought and oversold conditions. This oscillator was developed by Donald Lambert, the CCI is a stochastic oscillator that measures the change in price relative to a pre-defined moving average (MA) of the price divided by 1.5% of a normal deviation (D) from that average. Oscillating indicators in general are technical trading tools whose calculated values move back and forth between two pre-determined levels, the top level indicating a market that is in the condition of being overbought and the bottom one indicating a market that is in the condition of being oversold.
The CCI is computed according to EquationEquation 3(3)
(3) :
where P = The ETF’s current price, MA = The ETF’s price Moving Average, D =1.5% of a normal deviation from that average.
We used standard 100 and −100 for overbought and oversold conditions and 10 days moving average2. The results are shown in Table .
Table 3. RSI CMF-based trading strategies
Table 4. CCI-based trading strategies
Table presents an improved trading results. For four out of six ETFs the CCI trading strategy has outperformed the B&H strategy, with an excess return of 208% for the financial sector ETF (XLF) and 107.95 for the technological sector ETF (XLK). The only double-figure defeat of the CCI strategy was for QQQ (77.48 difference).
3.3. Bollinger bands
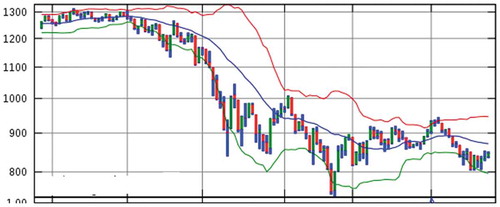
The last technical tool we tested was Bollinger Bands (BB) developed by famous technical trader John Bollinger. BB is plotted two standard deviations away from a simple moving average. Prices move between the bands 90% of the time. The closer the prices move to the upper band, the more overbought is the asset and the probability for the retracement to the downside increases. On the other hand, the closer the prices move to the lower band the more oversold the asset is and a positive retracement is expected. Prices movement and BB are demonstrated in Figure .
Figure 2. Bollinger Band
The setup we used here was 14 days for the moving average calculation with the original two standard deviations. The results are summarized in Table .
Table 5. Bollinger Bands-Based Trading Strategy Results
Table shows a bigger than one profit factor for all traded ETFs stating a profitable trading result. A superiority of the strategy over the B&H strategy was found for SPY, IWM, and XLI. Line 7 of Table describes the daily standard deviations of the daily return of the examined ETFs during the tested period. It is interesting to note that the BB trading strategy is a more useful strategy when you trade fewer volatile assets such as SPY and XLI and less effective when you trade some more volatile assets such as XLF and XLK, for which the CCI strategy stated above is preferred.
4. Summary and conclusions
In this research, we tested whether common trading oscillators fit to trade 6 popular ETFs for 20 years of trading. We started by applying the original setups of each trading tool to the data and measured performance, next we altered those setups to gain better results and finally tested to some combinations of oscillators. Our research finds that alone RSI, Stochastics, moving averages, CMF and MACD failed to outperform the B&H strategy. The RSI combined with CMF achieved a positive profit factor for all examined ETFs and also outperformed the B&H strategy dramatically for the XLF by 79% for the entire period. CCI and BB were found to be the best technical tools to trade the examined ETFs. While the CCI performed better for the more volatile ETFs XLF and XLK the BB was superior for trading IWM and XLI which are less volatile. We also recommend the CCI strategy for trading the SPY. No technical tools were found to be more effective than B&H strategy for the QQQ ETF.
Additional information
Notes on contributors

Gil Cohen
Gil Cohen is an academic researcher in the field of capital markets. My research deals with market anomalies and efficiencies. I am interested in the relationships between fundamental and technical analysis and their ability to forecast the capital markets movements. In the present paper I designed and used different trading setups that are based on well-established oscillators in fully computerized trading algorithm.
Notes
1. The profit factor is a factor which measures by the gross profit divided by the gross loss including commissions for the trading period.
References
- Cohen, G., Kudryavtsev, A., & Hon-Snir, S. (2011). Stock market analysis in practice: Is it technical or fundamental? Journal of Applied Finance and Banking, 1(3), 125.
- Marshall, B. R., Rochester, H. C., & Cahan, J. H. (2008). Does intraday technical analysis in the U.S. equity market have value?Journal of Empirical Finance, 15(2), 199–9.
- Menkhoff, L. (2010). The use of technical analysis by fund managers: International evidence. Journal of Banking & Finance, 34, 2573–2586.
- Neely, C., Weller, P., & Dittmar, R. (1997). Is technical analysis in the foreign exchange market profitable? A genetic programming approach. Journal of Finance and Quantitative Analysis, 32(4), 405–426.
- Tylor, M. P., & Allen, H. (1992). The use of technical analysis in the foreign exchange market. Journal of International Money and Finance, 11(3), 304–314.
- Tylor, N. (2014). The rise and fall of technical trading rule success. Journal of Banking & Finance, 40, 286–302.
- Wilder, J. W. (1978). New concepts in technical trading systems. Greensboro, N.C: Trend Research.
- Yamawaki, M. T., & Tokuoka, S. (2007). Adaptive use of technical indicators for the prediction of intra-day stock prices. Physica A: Statistical Mechanics and Its Applications, 383(1), 125–133.
- Zhu, Y., & Zhou, G. (2009). Technical analysis: An asset allocation perspective on the use of moving averages. Journal of Financial Economics, 92, 519–544.