
 ?Mathematical formulae have been encoded as MathML and are displayed in this HTML version using MathJax in order to improve their display. Uncheck the box to turn MathJax off. This feature requires Javascript. Click on a formula to zoom.
Abstract
Banks have a vital role in the financial system and its survival is crucial for the stability of the economy. This research paper attempts to create an efficient and appropriate predictive model using a machine learning approach for an early warning system of bank failure. This paper uses data collected for failed and survived public and private sector banks for the period of 2000–2017 located in India. Bank-specific variables as well as macroeconomic and market structure variables have been used to identify the stress level for banks. Since the number of failed banks in India is very less in comparison to surviving banks, the problem of imbalanced data arises and most of the machine learning algorithms do not work very well with such data. This paper uses a novel approach Synthetic Minority Oversampling Technique (SMOTE) to convert imbalanced data in a balanced form. Lasso regression is used to reduce the redundant features from the failure predictive model. To avoid the bias and over-fitting in the models, random forest and AdaBoost techniques are applied and compared with the logistic regression to get the best predictive model. The result of the study holds its application to various stakeholders like shareholders, lenders and borrowers etc. to measure the financial stress of banks. This study offers an analytical approach ranging from the selection of the most significant bank failure specific indicators using lasso regression, converting data from imbalanced to balanced form using SMOTE and the choice of the appropriate machine learning techniques to predict the failure of the bank.
PUBLIC INTEREST STATEMENT
Banks have a vital role in the financial system of a country and the survival of a bank is decisive for a stable economy. The Indian banking industry plays an important role in the economic development of the country and is the most dominant segment of the financial sector. Therefore, there is a need to formulate efficient and generalized predictive models and a warning system for a bank that can predict the likelihood of bank failure in advance. This study offers a systematic approach ranging from the selection of the most significant bank failure specific indicators using lasso regression, converting data from imbalanced to balanced form using SMOTE and the choice of the appropriate machine learning techniques to predict the failure of the banks. The result of the study holds its application to various stakeholders like shareholders, lenders, and borrowers, etc. to understand the financial stress of banks in future.
1. Introduction
The banking sector is the lifeline of any modernized country. It is one of the essential financial support which plays a dynamic role in the functioning of an economy. The strength of an economy relies on the efficiency and capability of the financial structure which depends on a solvent and sound banking system. In India, banks are playing a key role in the financial advancement of the country’s post-independence. The banking sector is overriding in India since it accounts for the majority of the resources of the financial division.
The financial institutions around the world are penetrating a dynamic and digital environment where competitiveness and efficiency hold the key to survival. The high intense competition from domestic and international banks, the constantly increasing consumer demand and immense growth in the technology, the introduction of new financial instruments and the new banking regulation and policies are creating immense pressure on banks to perform better than other players in the market.
Bank failure prediction is critical and formulating a method to measure financial distress before it actually happens is important. As a consequence, developing accurate and efficient failure predictive models have become an important goal in accounting, finance and computing communities. The financial institutions are concentrating on comprehension of the drivers of success which includes better use of its resources like technology, infrastructure, human capital, the process of delivering quality service to its customers and performance benchmarking. The performance analysis of current financial institutions uses traditional techniques like finance and accounting ratios, debt to equity proportion, return on equity and return on assets but these methods have methodological limitations (Yeh, Citation1996).
The prediction of bank failure has been extensively researched in the last few decades. Recent reviews and surveys of the literature like Balcaen and Ooghe (Citation2006); Chen, Ribeiro, & Chen, Citation2016); Lin, Chen, and Peng (Citation2012); Alfaro, García, Gámez, and Elizondo (Citation2008); Le and Viviani (Citation2018); Momparler, Carmona, and Climent (Citation2016); Pradhan (Citation2014) have shown that there are many statistical and machine learning techniques that have been developed and applied for prediction of bank failure. Of the two main types of techniques machine learning versus statistical techniques, machine learning has been most widely used and has been shown to outperform statistical techniques (Florez-Lopez, Citation2007). To create unbiased and generalized prediction models, it is necessary to choose those features that describe the status of a bank significantly. The different failure predictive model uses a different set of features (Alfaro et al., Citation2008; Kumar & Ravi, Citation2007; Liang, Lu, Tsai, & Shih, Citation2016; Lin, Liang, Yeh, & Huang, Citation2014; Lin, Lu, & Tsai, Citation2019).
In this study, predictive model for bank failure is formulated under the condition that a bank fails when any of the following criteria occur: bankruptcy, dissolution, negative total assets, state intervention, merger or acquisition (Pappas, Ongena, Izzeldin, & Fuertes, Citation2017). The data is collected for 58 private and public sector Indian banks over the period of 2000–2017 and is categorized into two categories failed or survived. The number of banks in the data set was 56 out of which 44 banks were under the survived category and 12 were under the failed category (Pappas et al., Citation2017). Since the number of failed banks is very less in comparison to the surviving banks in India, data becomes imbalanced. The proportion of the survived and failed classes in the data set is 0.97. The data has 618 records and 26 features as listed in Table . Imbalanced data sets are a special case for classification problems where the class distribution is not uniform among the classes (Chawla, Citation2009), hence the SMOTE algorithm has been used to convert data in the balanced form. Lasso regression has been used as a feature selection method to find significant features for banks’ failure and for further use in predictive models.
Table 1. The information about the independent and dependent variables used in the analysis are given below
The data has been divided into train and test in the ratio of 80% and 20%. The logistic regression, random forest (Tanaka, Kinkyo, & Hamori, Citation2016) and AdaBoost methodology (Collins, Schapire, & Singer, Citation2002) have been used to predict the failure of banks and the best method has been recommended based on the accuracy and Type-II error of the model. The reason behind the use of AdaBoost in place of other machine learning techniques is to remove the problem of overfitting and bias and provide better results. This study is planned as follows: Section-1 contains the introduction, Section-2 explains the literature review, section-3 contains methodology, Section-4 consists of data description and descriptive statistics, Section-5 comprises empirical results and Section-6 gives the conclusion and implications.
2. Literature review
Prediction of bankruptcy is an essential and widely studied topic and has been an extensively researched area. A variety of statistical and analytical methods have been applied to predict the bankruptcy problem in banks and firms. The literature review of this study is concentrated on the prediction of banks’ failure using statistical and machine learning approaches. Altman (Citation1968) was the first author who has used multivariate analysis to predict the bankruptcy of firms. He provided the Z-score model and presented its advantage by analyzing five main financial and economic aspects of a firm. Later, Sinkey (Citation1975) has used discriminant analysis to predict bank failures. In place of discriminant analysis, Martin (Citation1977) and Ohlson (Citation1980) have used logistic regression to predict the failures of firms and banks. Martin (Citation1977) attempted to predict US commercial bank failure within two years between 1970 and 1976 by using 25 financial ratios and suggested that logistic regression has a higher percentage of correctly classified cases than linear discriminant.
Thomson (Citation1991) has examined bank failures using a statistical approach that took place in the United States during the 1980s. Van Greuning and Iqbal (Citation2007) have used the most common early warning systems which are financial ratio and peer group analysis, comprehensive bank risk assessment systems and statistical and econometric models. Canbas, Cabuk, and Kilic (Citation2005) using 49 ratios on a sample of 40 privately owned Turkish commercial banks showed that discriminant analysis obtains considerably better results than Probit & Tobit models. Altman, Marco, and Varetto (Citation1994) have compared the performance of linear discriminant analysis with a back-propagation neural network in distress classification. Empirical studies have been conducted to compare the prediction accuracy of these two approaches, however, empirical studies do not demonstrate a clear advantage for one of the two main traditional techniques discriminant analysis versus logit and probit models (Boyacioglu, Kara, & Baykan, Citation2009). Konstandina (Citation2006) have used logit analysis to predict Russian bank failures. The recent study by Chiaramonte, Poli, and Oriani (Citation2015) publicized on a sample of 3242 banks across 12 European countries that Z-score is a good predictive model to identify banks in distress better than the probit and Tobit model.
The main difference between machine learning techniques and statistical techniques is that statistical techniques require researchers to define the structure of the model a priori and then to estimate parameters of the model to fit the data with observations while with machine learning techniques, the particular structure of the model is learned directly from the data (Wang, Ma, & Yang, Citation2014). Moreover, the statistical analysis depends on strict assumptions like normal distribution and no correlations between independent variables that can result in the poor predictive model. Some empirical studies compare various prediction methods. Tam and Kiang (Citation1992) compared the discriminant Analysis, logit analysis, k-nearest neighbor and artificial neural network on failure prediction and found that the latter outperforms the other techniques. Martínez (Citation1996) compares the neural network back-propagation method with discriminant analysis, logit analysis and the k-nearest neighbor for a sample of Texan banks and concludes that the first set of methods outperforms over others. Numerous studies recommend that machine learning techniques perform more effectively and efficiently than traditional statistical techniques (García, Fernández, Luengo, & Herrera, Citation2009; Joshi, Ramakrishman, Houstis, & Rice, Citation1997; Paliwal & Kumar, Citation2009).
Park and Han (Citation2002) used the k-nearest neighbor algorithm for bankruptcy prediction but could not find the empirical studies specifically dedicated to the use of k-nearest neighbor to predict bank failure. Kolari, Glennon, Shin, and Caputo (Citation2002) developed an early warning system based on the logit model and trait recognition model for large US banks. Lam and Moy (Citation2002) combined several discriminant models and performed simulation analysis to enhance the accuracy of classification results for classification problems in discriminant analysis. Zhao, Sinha, and Ge (Citation2009) compared logit, artificial neural network, and k-nearest neighbor and found that the artificial neural network performs better than other models when financial ratios are used rather than raw data. Several studies have compared artificial neural network and statistical techniques to predict bank failure (Alka, H.A. et al. Citation2018; Barboza, Kimura, & Altman, Citation2017; Bell, Citation1997; Iturriaga & Sanz, Citation2015; Le & Viviani, Citation2018; Olmeda & Fernández, Citation1997).
Min and Lee (Citation2005) was one of the first authors to propose support vector machines (SVM) for bankruptcy prediction. Later, Boyacioglu et al. (Citation2009) examined artificial neural networks, support vector machine and multivariate statistical methods to predict the failure of 65 Turkish financial banks. Overall, the result proved that the support vector machine achieved maximum accuracy. They found that this method outperforms neural network, discriminant analysis, and logit method. Serrano-Cinca and GutiéRrez-Nieto (Citation2013) compared nine different methods to predict the bankruptcy of US banks during the financial crisis, including logistic regression, linear discriminant analysis, support vectors machines, k-nearest neighbor and neural network. The support vector machine was also proved to work better than the neural network through the research of Chiaramonte et al. (Citation2015) for a sample of 3242 European banks. Among several machine-learning techniques, the artificial neural network and support vector machine appears to be the most preferred tool in prediction issues (Ahn, Cho, & Kim, Citation2000; Bell, Citation1997; Boyacioglu et al., Citation2009; Chiaramonte et al., Citation2015; Le & Viviani, Citation2018; Olmeda & Fernández, Citation1997; Serrano-Cinca & GutiéRrez-Nieto, Citation2013; Uthayakumar, Metawa, Shankar, & Lakshmanaprabu, Citation2018).
The most of the previous studies on bank failure prediction were focused on the country where the number of failed banks were large but the country like India where the number of failed banks are very less in comparison to the surviving banks, the problem of imbalanced classes arise and no studies have been attempted to handle these type of problems in failure prediction of banks (Altman, Citation1968; Altman et al., Citation1994; Sinkey, Citation1975; Martin, Citation1977; Ohlson, Citation1980; Boyacioglu et al., Citation2009; Chiaramonte et al., Citation2015; Wang et al., Citation2014; Ahn et al., Citation2000; Le & Viviani, Citation2018; Uthayakumar et al., Citation2018 and many more). The aim of this study is to formulate an analytical approach ranging from the selection of the most significant bank failure specific indicators, converting data from imbalanced to balanced form and the choice of the appropriate machine learning techniques to predict the failure of the bank.
3. Methodology
Since the collected data for this study has imbalanced classes, the SMOTE method (Chawla, Bowyer, Hall, & Kegelmeyer, Citation2002) is used to convert minority classes in balance form. The data with balanced classes are divided into a two-part train and test in the respective ratio of 80% and 20%. Lasso regression has been used to find significant features from 25 features (Pappas et al., Citation2017) listed in Table . Logistics regression, Random Forest and AdaBoost technique (Kumar, Citation2017) have been used to create a best predictive model and comparisons have been done based on predictive accuracy/Type-II error. The information regarding SMOTE, Lasso Regression, Bagging and Boosting are given in proceeding subsections.
3.1. Imbalanced classification and SMOTE
Imbalanced classification (Sun, Wong, & Kamel, Citation2009) is a supervised learning problem where one class outnumbers the other class by a large proportion. In the imbalanced classification problem, the dependent feature has an imbalanced proportion of classes. Some important techniques to deal with imbalanced data are undersampling, oversampling and Synthetic minority oversampling technique (SMOTE). Instead of replicating and adding the observations from the minority class as the Under-sampling and Oversampling does SMOTE overcome imbalances by generating artificial data. It is also a type of oversampling technique. SMOTE is a powerful method and creates artificial data based on feature space similarities from minority samples.
SMOTE (Chawla et al., Citation2002) is a popular oversampling method. The main idea of SMOTE is to construct new minority class samples by interpolating and selecting a near minority class neighbor randomly. The method can be described as follows. First, for each minority class sample, one gets its k-nearest neighbors from other minority class samples. Second, one chooses one minority class sample
among the neighbors. Finally, this generates the synthetic sample
by interpolating between
and
as follows:
Where rand (0, 1) refers to a random number between 0 and 1.
Figure 1. SMOTE algorithm (Synthetic data generation method)
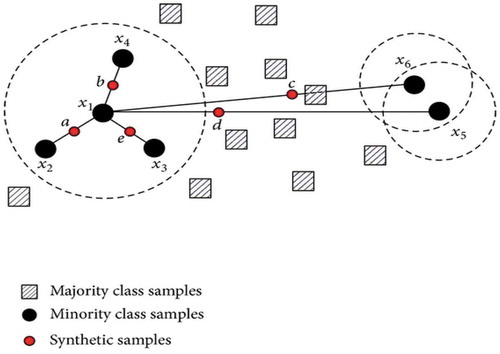
As given in figure-1, x1 and x2 are from the same feature space and “a” is a synthetic feature created with the combination of x1 and x2. SMOTE can be regarded as interpolating between two minority class samples. The decision space for the minority class is expanded that allows the classifier to have a higher prediction on unknown minority class samples.
3.2. Lasso regression (least absolute shrinkage and selection operator)
Lasso regression (Tibshirani, Citation1996) is a feature selection and predictive technique, useful to keep constraints on the parameters that shrink coefficients towards zero for the variable reduction. The goal of lasso regression is to obtain the subset of features that minimizes prediction error for a response variable. The sum of the square of error (SSELasso) for Lasso regression is given by
where y is the true value, is predicted value,
is the shrinkage parameter and
is regression coefficients. The collected data for this study contains 26 features and some of the features are highly correlated, Lasso regression is useful to eliminate the redundant features from 26 features (Pappas et al., Citation2017). The statistically significant variables selected by lasso regression are total assets, reserves, and funds, deposits, equity, liabilities, total capital, loans, net interest revenue, overheads, equity net loans, equity deposits, cost-income ratio, Z-score, return on assets, C3.All, C5.All, GDP growth and net income.
3.3. Logistic regression
Logistic Regression (Kumar, Citation2017) is a classification algorithm used to predict binary outcomes given under a set of independent variables. It predicts the probability of occurrence of an event by fitting data to a Logit function. The fundamental equation of Logistic regression model is:
If p is the probability of success, 1-p will be the probability of failure of events when only two events are associated with the model (failure and non-failure). are independent variables and
are the coefficient estimate.
3.4. Ensemble learning
Ensemble learning is group learning that is used to achieve better accuracy and model stability. The ensemble learning method uses multiple machine learning algorithms to find the optimal value of the parameter as shown in Figure . In the case of classification, it is done by majority voting whereas, in regression, it is done by average.
Figure 2. Ensemble learning method
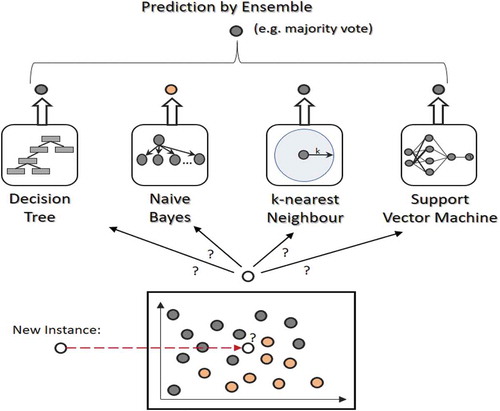
The two types of ensemble methods are known as bagging and boosting. The ensemble models are useful to lower variance, avoid overfitting and to reduce the bias.
3.4.1. Bagging technique (random forest)
Bagging is a technique used to improve the stability of a model by improving accuracy and reducing variance and over-fitting as shown in figure . Bagging is also known as bootstrapping aggregation which is a sampling technique (Momparler et al., Citation2016). Out of “n” available samples from the parent data, “k” samples are selected with replacement. Sampling with replacement is done to get the truly random sample and aggregating refers to combining all predictions from various models to get final predictions.
Figure 3. Bagging procedure for algorithm learning
In bagging, the same learning algorithm is trained with the subsets of the dataset randomly picked from the training dataset. We select the subsets of the training dataset into bags randomly and then train the learning model on each bag (Figini, Savona, & Vezzoli, Citation2016). The final prediction is done by combining all model results. We use a random forest technique to predict the failure of the banks. Random forest operates by constructing a number of decision trees at training time and outputting the class that is the mode of the classes in case of classification and average in case of regression. Bagging technique (Breiman, Citation1996) follows these steps:
A random bootstrap set K is selected from the parent dataset.
Classifiers Dk are conigured on the dataset from step 1.
Steps 1 and 2 are repeated for k = 1 … K.
Each classifier determines a vote,
where x is the data of each element from the training set. In the final step, the class that receives the largest number of votes is elected as the classifier for the dataset.
Random forest is one of the famous bagging technique based on decision tree models. Random forest is particularly robust and allows for the presence of outliers and noise in the training set (Yeh, Chi, & Lin, Citation2014). Finally, the random forest identifies the importance of each variable in the classification results also. Therefore, it provides not only the classification of observations but also information about the determinants of separation among groups (Maione, Batista, Campiglia, Barbosa, & Barbosa, Citation2016). Random forest algorithm (Yeh et al., Citation2014) follow the below steps:
Create random subsets of the parent set composed of an arbitrary number of observations and different features.
Each subset from step-1 produces a decision tree and all elements of the set have a label (Failed or Survived).
For each record, the forest takes a large number of votes. The class with the most vote is chosen as the preferred classification of the element.
3.4.2. Boosting technique (adaboost)
Boosting is one of the ensemble technique that combines weak learners to create a strong learner that can make accurate predictions. Boosting starts out with a weak classifier that is prepared on the training data (Kim & Upneja, Citation2014). A classifier learning algorithm is said to be weak when small changes in data induce big changes in the classification model. In the next iteration, the new classifier focuses on or places more weight to those cases which were incorrectly classified in the last round.
Adaptive boosting (AdaBoost) is one of the machine learning algorithm (Freund & Schapire, Citation1997). It can be used by combining other learning algorithms to make a more improved learning algorithm. AdaBoost combines with weak classifiers to build a learning algorithm with stronger classifiers. The weighted average method is used for combination. The following shows the algorithm that determines the weighted value and classification method used in this study.
In this study, the decision tree is used as a weak classifier algorithm and the depth is set to 26. That is, 26 decision tree algorithms perform classifier learning for each variable. So, each decision tree algorithm uses a single variable. As the depth is 26, the bankruptcy predictive ability is very low. Let’s call a set of 26 weak classifiers “H”.
Assuming that m number of training samples are:. Herein, “x” indicates the features of the subjects for classification and “y” is a class having the value of −1 or 1. In this study, a set of model variables of a bank is “x” listed in Table . The failure of the banks are classified as −1, and survival banks are classified as 1. Each weak classifier attempts classification on feature “x” with a single value. The distribution of weighted value is initialized through W1(i) = 1/k, i = 1,2,…,k. The following are repeated T times from t = 1 to T.
Suppose that the weak classifier with the lowest error is ht. Herein, errors are set according to the distribution of weighted value.
The distribution of weights
In each cycle,
4. Data description and descriptive statistics
In this study, data is collected for failed and survived, private and public sector banks for the period of January 2000 to December 2017 located in India. The data contains the two classes that survived and failed with code 0 and 1. The number of banks in the data set was 56 out of which 44 banks were under the survived category and 12 were under the failed category (Pappas et al., Citation2017). The proportion of the classes survived and failed in the data set is 0.97. The data has 618 records and 26 features as listed in Table with a number of missing values. If the pattern of missing values which are continuous and monotone in nature, the monotone regression has been used for imputation and if the pattern of missing values which are continuous in nature are arbitrary, Markov Chain Monte Carlo full data imputation (Schunk, Citation2008; Yuan, Citation2000) method has been used for missing value imputation.
In this study, a bank fails when any of the following criteria occur: bankruptcy, liquidation, negative total assets, state intervention, and merger or acquisition (Pappas et al., Citation2017). The bank-year remarks immediately preceding the real failure year are graded as failed. The outliers for the surviving banks are winsorized upon the 1 as well as 99 percentile. But in case of failed banks, acute remarks for the failed bank-year interpretation are deemed revealing as they might be signaling some anxiety. The target variable in the failure prediction modeling is the status of the bank “survived” or “failed”. The failure indicator is a two-fold dummy variable that takes the value of 1 in the year immediately previous to the real failure. The variable equalizes zero for the existing banks in all of the sampling years. The important independent variables for bank failure are derived from the statement sheet, balance sheet, financial ratios, and country-specific variables as listed in Table (Pappas et al., Citation2017).
The collected data for this study covers approximately 94% of Indian banks. The target variable in the model is the status of the bank survived or failed. In this study, a bank fails when any of these conditions occur: bankruptcy, dissolution, negative assets, merger or acquisition (Pappas et al., Citation2017).
Table gives descriptive statistics of the banks’ feature considered for the study as given in Table . The study is based on 56 public and private sector Indian banks. All quantitative variables except ratios are in million. As it is clear from Table that the standard deviation of variables and ratios are high indicating the large difference in the banks’ profile.
Table 2. Descriptive statistics for private and public sector Indian banks for the period of 2000–2017
In columns I and II of Table , the comparison is done based on the financial and non-financial profile of surviving and failed banks. The failed banks are significantly smaller than the surviving banks in the financial turnover. The equity and net income for failed banks are 15946 and 2066 while it is 95788 and 1435595 for survived banks. The financial position of failed banks (Equity/Assets) is very low as compared to surviving banks (−0.01 against 0.06). Overall, Table indicates that the surviving banks are characterized by a stronger financial profile than the failed banks.
Table 3. Preliminary data analysis the Table 3 describes the descriptive statistics of accounting profiles to survived vs. Failed banks. The t-tests on the mean difference for different classifications of banks are given below
Table 4. Confusion matrix—Actual values vs predicted results
Table 5. Actual vs predicted—logistic regression
Table 6. Actual vs predicted—random forest method
Table 7. Actual vs predicted—AdaBoost method
Table 8. Accuracy and Type-II error of the different algorithms on the test data
5. Empirical results
The imbalanced data has 618 records in which the proportion of minority and majority classes is 2.4% and 97.6% respectively. The imbalanced data set was divided into a two-part train and test in the proportion of 80% and 20%. The logistic regression model is formulated on train data and validated on the test data without converting it in a balanced form. The precision of the model is 0/0 which is not defined and shows that the model is extremely bad with the threshold value as 0.5. The Recall of the model is very low and gives a higher number of false negatives. The F- value of the model is also not defined and indicates that the accuracy of the model is tremendously bad. The area under the curve (AUC) of the model is 0.5 and gets biased toward the majority class and fails to map minority class and therefore, it is necessary to convert data in the balanced form before applying the appropriate machine learning algorithm.
SMOTE method as discussed in Subsection-3.1 has been used to convert the data from imbalanced to balanced form. In a balanced data set, the proportion of minority and majority classes is approximately equal with 1180 records and 26 features (Pappas et al., Citation2017) as listed in Table . Lasso regression is used to find statistically significant features for bankruptcy. The statistically significant features selected by lasso regression are total assets, reserves and funds, deposits, equity, liabilities, total capital, loans, net interest revenue, overheads, equity net loans, equity deposits, cost-income ratio, Z-score, return on assets, C3.All, C5.All, GDP growth and net income.
The balanced data was divided into train and test in the ratio of 80% to 20%. Due to the use of the SMOTE algorithm on the imbalanced data, there is always a high likelihood that the model consists of bias and over-fitting. To avoid bias and over-fitting on the model, Random forest and AdaBoost algorithm is formulated on train data and validated on the test data. Models may misclassify when they are validated on test data. The test outcome can be positive (failed) or negative (surviving) while the status of the banks may be different and the following four different conditions may occur:
Failed banks correctly predicted as failed banks and failed banks wrongly predicted as surviving banks
Surviving banks wrongly predicted as failed banks and surviving banks correctly predicted as surviving banks
From the above conditions, it is clear that in two cases an error has occurred, surviving banks wrongly predicted as failed banks and failed banks wrongly predicted as surviving banks. These two types of errors are known as Type-I and Type-II errors. In general, the average prediction accuracy and Type-I/II errors are examined for bankruptcy prediction models (Lin et al.). Since the bankruptcy prediction belongs to the imbalanced class where the number of bankrupt cases is much smaller than that of non-bankrupt cases, it is meaningless to examine the average prediction accuracy. The Type-I and Type-II errors are useful to measure the performance of prediction models where the Type-I error means the number of surviving banks classified as failed banks the Type-II error means the number of failed banks classified as a surviving bank. Of these, Type-II error is more critical for banks because if they make wrong decisions regarding which banks are moving towards bankruptcy it arises a difficult situation for banks as time passes. Therefore, the prediction model that can provide the highest accuracy and lowest Type-II error rate is considered as the best model in this study.
The predictive model is formulated using logistic regression. The accuracy and Type-II error of the model is 68.65% and 64.34% respectively.
The performance of the predictive models is measured with high accuracy and low Type-II error. Comparing all these three models based on the ratio of accuracy and Type-II error, AdaBoost gives the best result.
Although none of the machine learning methods used in this study have Type-II error zero. The first reason is that some of the banks were economically in good conditions although the merger has happened due to either government interference or due to a mutual understanding of banks to decrease the operational expenditures. For example, SBI Commercial & Intl. Bank Ltd. has been predicted by the model as surviving banks but as per the data, it is under the category of a failed bank. SBI Commercial & Intl. Bank Ltd. was taken as a failed bank because it is merged with SBI, not due to financial distress but it was due to government intervention to minimize the operational expenditures. The second reason, lasso regression has already reduced the number of features and reduction in feature reduces accuracy also. These scenarios lead to the Type-II error in the model. Based on the trade-off between accuracy, the complexity of the model and Type-II error, AdaBoost is the highest accurate model for failure prediction. The primary reason for the use of the Adaboost technique is to remove the problem of overfitting and bias.
6. Conclusion and implications
In this study, we have developed a systematic framework for assessing and visualizing banks’ financial stability and created a warning system to avoid bankruptcy. We have collected publically available data for private and public sector banks located in India for the period of January 2000 to December 2017. This data contains a number of missing values. If the pattern of missing values that are continuous in nature is monotone, the monotone regression is used for imputation and if the pattern of missing values that are continuous in nature is arbitrary, MCMC (Markov Chain Monte Carlo full data imputation) method is used for imputation.
Since the collected data for this study has imbalanced classes, we have used SMOTE to convert minority classes in the balanced form. Lasso regression has been used to find the statistically significant features of bank failure and these features are further used in the formulation of failure predictive models. The parent data was divided into two-parts called train and test datasets in the ratio of 80% to 20%. The different predictive algorithm was trained on train data and validated on test data to check the accuracy of the model. First, logistic regression is trained on train data to predict the failure of the model. Second, to avoid over-fitting and bias of the model, we have implemented random forest and AdaBoost also. Finally, we have compared all three algorithms based on the Type-II error and accuracy on test data. AdaBoost gives the maximum accuracy in comparison to all other methods. This study offers a systematic approach ranging from the selection of the most significant bank failure specific indicators using lasso regression, converting data from imbalanced to balanced form using SMOTE and the choice of the appropriate machine learning techniques to predict the bankruptcy.
Additional information
Funding
Notes on contributors

P Mary Jeyanthi
Dr. Santosh Shrivastava is an Assistant Professor in the Business Analytics area. Dr. Santosh holds a Ph.D. from Jaypee University of Science and technology in the area of mathematics (nonlinear optimization) and an M.Sc. in Applied Mathematics from IIT Roorkee. Research interests of Dr. Shrivastava include nonlinear modeling and optimization, Bankruptcy Prediction, Artificial Intelligence, Data envelop analysis and Machine learning.
References
- Ahn, B. S., Cho, S. S., & Kim, C. Y. (2000). The integrated methodology of rough set theory and artificial neural network for business failure prediction. Expert Systems with Applications, 18(2), 65–17. doi:10.1016/S0957-4174(99)00053-6
- Alaka, H. A., Oyedele, L. O., Owolabi, H. A., Kumar, V., Ajayi, S. O., Akinade, O. O., & Bilal, M. (2018). A systematic review of bankruptcy prediction models: Towards a framework for tool selection. Expert Systems with Applications, 94, 164–184. doi:10.1016/j.eswa.2017.10.040
- Alfaro, E., García, N., Gámez, M., & Elizondo, D. (2008). Bankruptcy forecasting: An empirical comparison of AdaBoost and neural network. Decision Support Systems, 45(1), 110–122. doi:10.1016/j.dss.2007.12.002
- Altman, E. I. (1968). Financial ratios, Discriminant analysis and the prediction of corporate bankruptcy. The Journal of Finance, 23(4), 589–609. doi:10.1111/j.1540-6261.1968.tb00843.x
- Altman, E. I., Marco, G., & Varetto, F. (1994). Corporate distress diagnosis: Comparisons using linear discriminant analysis and neural network (the Italian experience). Journal of Banking & Finance, 18(3), 505–529. doi:10.1016/0378-4266(94)90007-8
- Balcaen, S., & Ooghe, H. (2006). 35 years of studies on business failure: An overview of the classic statistical methodologies and their related problems. The British Accounting Review, 38(1), 63–93. doi:10.1016/j.bar.2005.09.001
- Barboza, F., Kimura, H., & Altman, E. (2017). Machine learning models and bankruptcy prediction. Expert Systems with Applications, 83, 405–417. doi:10.1016/j.eswa.2017.04.006
- Bell, C. M. (1997). Ritual: Perspectives and dimensions. New York, NY: Oxford University Press. .
- Boyacioglu, M. A., Kara, Y., & Baykan, Ö. K. (2009). Predicting bank financial failures using neural network, support vector machines and multivariate statistical methods: A comparative analysis in the sample of savings deposit insurance fund (SDIF) transferred banks in Turkey. Expert Systems with Applications, 36(2), 3355–3366. doi:10.1016/j.eswa.2008.01.003
- Breiman, L. (1996). Bagging predictors. Machine Learning, 24(2), 123–140. doi:10.1007/BF00058655
- Canbas, S., Cabuk, A., & Kilic, S. B. (2005). Prediction of commercial bank failure via multivariate statistical analysis of financial structures: The Turkish case. European Journal of Operational Research, 166(2), 528–546. doi:10.1016/j.ejor.2004.03.023
- Chawla, N. V. (2009). Data mining for imbalanced datasets: An overview. In Data mining and knowledge discovery handbook (pp. 875–886). Boston, MA: Springer.
- Chawla, N. V., Bowyer, K. W., Hall, L. O., & Kegelmeyer, W. P. (2002). SMOTE: Synthetic minority over-sampling technique. Journal of Artificial Intelligence Research, 16, 321–357. doi:10.1613/jair.953
- Chen, N., Ribeiro, B., & Chen, A. (2016). Financial credit risk assessment: A recent review. Artificial Intelligence Review, 45(1), 1–23. doi:10.1007/s10462-015-9434-x
- Chiaramonte, L., Poli, F., & Oriani, M. E. (2015). Are cooperative banks a lever for promoting bank stability? Evidence from the recent financial crisis in OECD countries. European Financial Management, 21(3), 491–523. doi:10.1111/eufm.v21.3
- Collins, M., Schapire, R. E., & Singer, Y. (2002). Logistic regression, AdaBoost and Bregman distances. Machine Learning, 48(1–3), 253–285. doi:10.1023/A:1013912006537
- Figini, S., Savona, R., & Vezzoli, M. (2016). Corporate default prediction model averaging: A normative linear pooling approach. Intelligent Systems in Accounting. Finance and Management, 23(1–2), 6–20.
- Florez-Lopez, R. (2007). Modelling of insurers’ rating determinants. An application of machine learning techniques and statistical models. European Journal of Operational Research, 183(3), 1488–1512. doi:10.1016/j.ejor.2006.09.103
- Freund, Y., & Schapire, R. E. (1997). A decision-theoretic generalization of on-line learning and an application to boosting. Journal of Computer and System Sciences, 55(1), 119–139. doi:10.1006/jcss.1997.1504
- García, S., Fernández, A., Luengo, J., & Herrera, F. (2009). A study of statistical techniques and performance measures for genetics-based machine learning: Accuracy and interpretability. Soft Computing, 13(10), 959. doi:10.1007/s00500-008-0392-y
- Iturriaga, F. J. L., & Sanz, I. P. (2015). Bankruptcy visualization and prediction using Neural Network: A study of US commercial banks. Expert Systems with Applications, 42(6), 2857–2869. doi:10.1016/j.eswa.2014.11.025
- Joshi, A., Ramakrishman, N., Houstis, E. N., & Rice, J. R. (1997). On neurobiological, neuro-fuzzy, machine learning, and statistical pattern recognition techniques. IEEE Transactions on Neural Network, 8(1), 18–31. doi:10.1109/72.554188
- Kim, S. Y., & Upneja, A. (2014). Predicting restaurant financial distress using decision tree and AdaBoosted decision tree models. Economic Modelling, 36, 354–362. doi:10.1016/j.econmod.2013.10.005
- Kolari, J., Glennon, D., Shin, H., & Caputo, M. (2002). Predicting large US commercial bank failures. Journal of Economics and Business, 54(4), 361–387. doi:10.1016/S0148-6195(02)00089-9
- Konstandina, N. (2006). Probability of bank failure: The Russian case (Vols. 06–01e). EERC Research Network, Russia and CIS, RePEc:eer:wpalle:06-01e.
- Kumar, P. R., & Ravi, V. (2007). Bankruptcy prediction in banks and firms via statistical and intelligent techniques–A review. European Journal of Operational Research, 180(1), 1–28. doi:10.1016/j.ejor.2006.08.043
- Kumar, U. D., 2017. Business Analytics The science of data-driven decision making. doi:10.2174/156802661709170213214101
- Lam, K. F., & Moy, J. W. (2002). Combining discriminant methods in solving classification problems in two-group discriminant analysis. European Journal of Operational Research, 138(2), 294–301. doi:10.1016/S0377-2217(01)00247-8
- Le, H. H., & Viviani, J. L. (2018). Predicting bank failure: An improvement by implementing a machine-learning approach to classical financial ratios. Research in International Business and Finance, 44, 16–25. doi:10.1016/j.ribaf.2017.07.104
- Liang, D., Lu, C. C., Tsai, C. F., & Shih, G. A. (2016). Financial ratios and corporate governance indicators in bankruptcy prediction: A comprehensive study. European Journal of Operational Research, 252(2), 561–572. doi:10.1016/j.ejor.2016.01.012
- Lin, F., Liang, D., Yeh, C. C., & Huang, J. C. (2014). Novel feature selection methods to financial distress prediction. Expert Systems with Applications, 41(5), 2472–2483. doi:10.1016/j.eswa.2013.09.047
- Lin, J. W., Chen, C. W., & Peng, C. Y. (2012). Potential hazard analysis and risk assessment of debris flow by fuzzy modeling. Natural Hazards, 64(1), 273–282. doi:10.1007/s11069-012-0236-z
- Lin, W. C., Lu, Y. H., & Tsai, C. F. (2019). Feature selection in single and ensemble learning‐based bankruptcy prediction models. Expert Systems, 36(1), e12335. doi:10.1111/exsy.12335
- Maione, C., Batista, B. L., Campiglia, A. D., Barbosa, F., Jr, & Barbosa, R. M. (2016). Classification of geographic origin of rice by data mining and inductively coupled plasma mass spectrometry. Computers and Electronics in Agriculture, 121, 101–107. doi:10.1016/j.compag.2015.11.009
- Martin, D. (1977). Early warning of bank failure: A Logit regression approach. Journal of Banking & Finance, 1(3), 249–276. doi:10.1016/0378-4266(77)90022-X
- Martínez, O. J. (ed.). (1996). US-Mexico borderlands: Historical and contemporary perspectives. New York, NY: Rowman & Littlefield Publishers.
- Min, J. H., & Lee, Y. C. (2005). Bankruptcy prediction using support vector machine with optimal choice of kernel function parameters. Expert Systems with Applications, 28(4), 603–614. doi:10.1016/j.eswa.2004.12.008
- Momparler, A., Carmona, P., & Climent, F. (2016). Banking failure prediction: A boosting classification tree approach. Spanish Journal of Finance and Accounting/Revista Española De Financiación Y Contabilidad, 45(1), 63–91. doi:10.1080/02102412.2015.1118903
- Montgomery, H., Santoso, W., Besar, D. S., & Hanh, T. (2005). Coordinated failure? A cross-country bank failure prediction Model.
- Ohlson, J. A. (1980). Financial ratios and the probabilistic prediction of bankruptcy. Journal of Accounting Research, 18, 109–131. doi:10.2307/2490395
- Olmeda, I., & Fernández, E. (1997). Hybrid classifiers for financial multicriteria decision making: The case of bankruptcy prediction. Computational Economics, 10(4), 317–335. doi:10.1023/A:1008668718837
- Paliwal, M., & Kumar, U. A. (2009). Neural network and statistical techniques: A review of applications. Expert Systems with Applications, 36(1), 2–17. doi:10.1016/j.eswa.2007.10.005
- Pappas, V., Ongena, S., Izzeldin, M., & Fuertes, A. M. (2017). A survival analysis of Islamic and conventional banks. Journal of Financial Services Research, 51(2), 221–256. doi:10.1007/s10693-016-0239-0
- Park, C. S., & Han, I. (2002). A case-based reasoning with the feature weights derived by analytic hierarchy process for bankruptcy prediction. Expert Systems with Applications, 23(3), 255–264. doi:10.1016/S0957-4174(02)00045-3
- Pradhan, R. (2014). Z score estimation for Indian banking sector. International Journal of Trade, Economics and Finance, 5(6), 516. doi:10.7763/IJTEF.2014.V5.425
- Schunk, D. (2008). A Markov chain Monte Carlo algorithm for multiple imputation in large surveys. AStA Advances in Statistical Analysis, 92(1), 101–114. doi:10.1007/s10182-008-0053-6
- Serrano-Cinca, C., & GutiéRrez-Nieto, B. (2013). Partial least square discriminant analysis for bankruptcy prediction. Decision Support Systems, 54(3), 1245–1255. doi:10.1016/j.dss.2012.11.015
- Sinkey, J. F., Jr. (1975). A multivariate statistical analysis of the characteristics of problem banks. The Journal of Finance, 30(1), 21–36. doi:10.1111/j.1540-6261.1975.tb03158.x
- Sun, Y., Wong, A. K., & Kamel, M. S. (2009). Classification of imbalanced data: A review. International Journal of Pattern Recognition and Artificial Intelligence, 23(04), 687–719. doi:10.1142/S0218001409007326
- Tam, K. Y., & Kiang, M. Y. (1992). Managerial applications of Neural Network: The case of bank failure predictions. Management Science, 38(7), 926–947. doi:10.1287/mnsc.38.7.926
- Tanaka, K., Kinkyo, T., & Hamori, S. (2016). Random forests-based early warning system for bank failures. Economics Letters, 148, 118–121. doi:10.1016/j.econlet.2016.09.024
- Thomson, J. B. (1991). Predicting bank failures in the 1980s. Federal Reserve Bank of Cleveland Economic Review, 27(1), 9–20.
- Tibshirani, R. (1996). Regression shrinkage and selection via the lasso. Journal of the Royal Statistical Society. Series B (Methodological), 267–288. doi:10.1111/j.2517-6161.1996.tb02080.x
- Uthayakumar, J., Metawa, N., Shankar, K., & Lakshmanaprabu, S. K. (2018). Intelligent hybrid model for financial crisis prediction using machine learning techniques. Information Systems and e-Business Management, 16, 1–29.
- Van Greuning, H., & Iqbal, Z. (2007). Banking and the risk environment. Islamic finance: The regulatory challenge (pp. 11–39). Singapore: John Wiley & Sons.
- Wang, G., Ma, J., & Yang, S. (2014). An improved boosting based on feature selection for corporate bankruptcy prediction. Expert Systems with Applications, 41(5), 2353–2361. doi:10.1016/j.eswa.2013.09.033
- Yeh, C. C., Chi, D. J., & Lin, Y. R. (2014). Going-concern prediction using hybrid random forests and rough set approach. Information Sciences, 254, 98–110. doi:10.1016/j.ins.2013.07.011
- Yeh, Q. J. (1996). The application of data envelopment analysis in conjunction with financial ratios for bank performance evaluation. Journal of the Operational Research Society, 47(8), 980–988. doi:10.1057/jors.1996.125
- Yuan, Y. C., 2000, April. Multiple imputations for missing data: Concepts and new development. Proceedings of the Twenty-Fifth Annual SAS Users Group International Conference, 267, Hog Kong, China.
- Zhao, H., Sinha, A. P., & Ge, W. (2009). Effects of feature construction on classification performance: An empirical study in bank failure prediction. Expert Systems with Applications, 36(2), 2633–2644. doi:10.1016/j.eswa.2008.01.053