
 ?Mathematical formulae have been encoded as MathML and are displayed in this HTML version using MathJax in order to improve their display. Uncheck the box to turn MathJax off. This feature requires Javascript. Click on a formula to zoom.
Abstract
This paper investigates the existence of herding behavior in cryptocurrencies market. Using data of the 20 large cryptocurrencies and MV Index Solution Crypto Compare Digital Assets for large cap index, we found no evidence of herding behavior using cross-sectional absolute standard deviation estimation. However, by applying a rolling window analysis, the results show significant herding behavior, which varies over time. Finally, we find an inverse relationship between herding behavior and the Bloomberg consumer comfort index which means that when traders are less comfortable they prefer to ignore their expectations and follow the market performance.
Keywords:
PUBLIC INTEREST STATEMENT
Irrational behavior can cause dramatic losses for investors and imply higher risk and volatility especially the crowd behavior where investors are following each other blindly without any rational thinking. This paper aims to explore the existence of herding behavior in the cryptocurrency market and try to detect the factors that cause or strengthen this behavior. Our results show evidence of herding behavior during several periods especially during 2016 until the beginning of 2017 and strong inverse relationship with the comfort index.
1. Introduction
Humans naturally find safety in belonging. An individual, for instance, intuits a sense of security when he or she fits in a particular community because the person enjoys a robust social life, and it offers a platform for the exchange of ideas and information. Such dynamics underscore why the herding mentality exists in the financial markets; people’s emotions prompt them to make irrational decisions. Specifically, whenever a financial crash or bubble occurs in the market under consideration, it prompts some traders to either purchase or vend a particular commodity and, as one would anticipate, a considerable number of people would follow suit. Indeed, this emotional contagion engenders pecuniary insatiability in speculative bubbles and aversion to market crashes. In this regard, one of the most significant topical discussions in the financial world is the advent of cryptocurrency and the blockchain technology, which facilitates global, peer-to-peer transactions without the participation of third-party intermediaries or a central authority. Due to its ease of use, decentralization, and the lack of costly intermediaries, therefore, cryptocurrency has become increasingly popular among investors, the world over. Nevertheless, it appears that herding behavior has permeated the cryptocurrency market because germane data over the past decade suggest that significant links exist between market herding and the notion of a crash or bubble. Indeed, the herding mentality persists because crypto-investors lack salient information sources; therefore, they mimic the action of others and invest in the crypto-market price bubbles without exercising due diligence.
We try in this paper to find a response to the question: does herding behavior exist in cryptocurrency market? To do this, we investigate the existence of this behavior using cross-sectional absolute dispersion (CSAD) on the sample of 20 large cryptocurrencies. The estimation is done on a whole period than on rolling windows. Finally, we tried to find an economic explanation to the existence of herding behavior.
Our paper contributes to the existing literature in several ways. First, the use of MVIS Crypto Compare Digital Assets for large cap index as a market benchmark. Second, the period of the study lies from 1 January 2015 to 31 January 2019 which covers very recent data. Third, we explain the existence of herding behavior by the increase in the level of comfort using Bloomberg consumer comfort index.
The paper is organized into five sections. After introduction, we summarize the relevant literature review. The third section presents the data and methodology. The fourth section recaps results and interpretations and the fifth concludes.
2. Literature Review
Over recent years, many researchers have examined cryptocurrencies from behavioral approach due to their extraordinary returns and extreme volatility without obvious justifying basis. Bouri, Shahzad, et al., (Citation2018) examine the presence of herding behavior in the cryptocurrency market by conducting a rolling window analysis and using a logistic regression on daily closing prices of 14 leading cryptocurrencies from 2013 to 2018 and they find that herding tends to occur as uncertainty increases. In another study, the same authors date-stamp price explosivity in leading cryptocurrencies (Bitcoin, Ripple, Ethereum, Litecoin, Nem, Dash, and Stellar) for daily prices from 2015 to 2017 and reveal that all cryptocurrencies investigated were characterized by multiple explosivity.
Hu, McInish, Miller, and Zeng (Citation2018) investigate intraday price behavior of three cryptocurrencies (Bitcoin (BTC), Litecoin (LTC), and Ripple (XRP)) for the period 2011–2018 and find that prices are mainly formed due to negotiations and strategic trading, instead of based on psychology. Stosic, Stosic, Ludermir, and Stosic (Citation2018) analyze cross correlations between price changes of different cryptocurrencies using daily prices from 2016 to 2018 by applying methods of random matrix theory and minimum spanning trees and find that collective behaviors that are present in the cryptocurrency market can be useful for the construction of portfolio of cryptocurrencies as well as for future research on the subject.
Calgar (Citation2018) investigates explosive behavior in the prices of Bitcoin and seven other altcoins: Ethereum, Ripple, Litecoin, Stellar, Nem, Dash, and Monero by analyzing the daily prices of these cryptocurrencies between September 2015 and January 2018 using the new “explosive process framework” and find that all cryptocurrencies other than Nem exhibit explosive behavior and reveal significant pairwise co-movement relationships among the explosive cryptocurrencies.
Vidal-Tomas and Ibanez (Citation2018) analyze the existence of herding in the cryptocurrency market through the cross-sectional standard (absolute) deviation of returns. They use used 65 digital currencies from 2015 to 2017 and show that extreme dispersion of returns is explained by rational asset pricing models although it is possible to observe herding during down markets, which highlights the inefficiency and risk of cryptocurrencies.
Calderón’s (Citation2018) study employs the methodology apparent in Chang, Cheng, and Khorana’s (Citation2000) investigation. They used the top 50 cryptocurrencies from 29 April 2013 to 3 April 2018. According to the findings, most investors discount the rational asset pricing benchmark and follow others—a quintessential case of herding behavior.
LeClair’s (Citation2018) research estimates the market herding dynamics in a CAPM framework. Specifically, the researcher employed the five-minute closing price on a daily interval from 15 August 2017 to 9 March 2018 to estimate the betas of most popular. The findings indicate that whenever shocks emerge in the market, investors seldom apply rational decisions; instead, they observe the market’s popular consensus.
3. Data and methodology
Our data consist of daily closing prices of 20 largest cryptocurrencies by market capitalization from 1 January 2015 to 31 January 2019, which corresponds to a total of 1,492 trading days. All data are downloaded from coinmarketcap.com. We choose MV Index Solution (MVIS) Crypto Compare Digital Assets 100 Index for large cap as a market portfolio (extracted from Bloomberg) which is a market-cap-weighted index that tracks the performance of the 100 largest digital assets. The index serves as a benchmark and universe for the other MVIS CryptoCompare Digital Assets Indices. After that, we calculated the returns ( as follow:
where P denotes the price of a coin i at time t. Table summarizes descriptive statistics for all the data.
Table 1. Descriptive statistics (1 January 2015–31 January 2019)
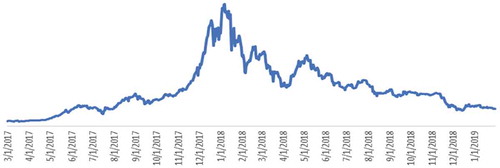
From Table , we can observe the positive performance for the market (mean equal 0.00249) and almost of currencies except Tether, Bitcoin SV, ZCash, and Tezos. These coins have negative performance (negative mean) but this fact has no impact on our study because they represent only 3.6% of the weight of MVIS large cap index. The market index is also approximately symmetric but 70% of data are skewed to the right (45%) or to the left (25%). Also, we have very high value of kurtosis which means that the distribution is leptokurtic. The peaks are very high which means that data are heavy-tailed and profusion of outliers. According to this result, we will divide the data into sub-samples according to the variations detected in the figures below (Figures 1-4).
Figure 1. MVIS variation (1 January 2015–31 January 2019)
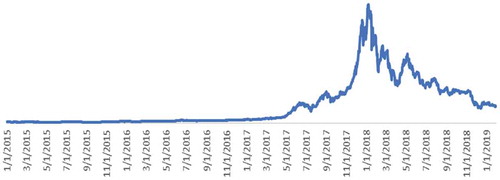
Figure 2. MVIS variation (1 January 2015–2 January 2016)
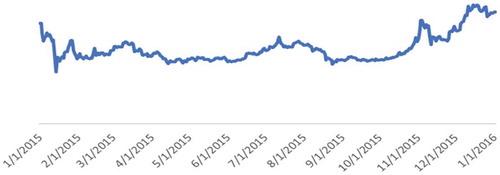
Figure 3. MVIS variation (3 January 2016–28 February 2017)
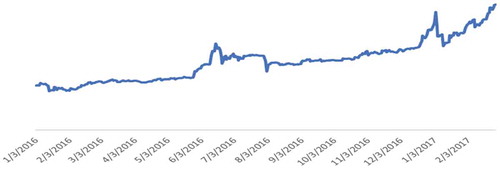
Figure 4. MVIS variation (1 March 2017–31 January 2019)
Following the approach of Chang et al. (Citation2000), we apply the CSADs among 20 cryptocurrencies to express the polynomial relation between the level of cryptocurrency return dispersions and the overall cryptocurrency market return. The CSAD statistic that measures the dispersion of returns is calculated as follows:
where
Ri,t is the return of the cryptocurrency i at time t,
Rm,t is the return of the market at time t,
N is the number of cryptocurrencies in the portfolio at time t.
After that, we will estimate the following polynomial model for return dispersion:
According to Christie and Huang (Citation1995), the probability of herd behavior increases during periods of market stress and large price movements. A significantly negative coefficient indicates the existence of herding, while a significantly positive coefficient
is predicted by rational asset pricing models.
4. Results
Table reports the results for EquationEquation (3)(3)
(3) . The results show that the coefficient α1 is positive and statistically significant, which means that the CSADs of returns on cryptocurrencies are a growing function of the absolute value of market (MVIS). Also, the coefficient α2 is positive and statistically significant which indicates the presence of anti-herding. This means that the absolute dispersion is moving in the same direction of
and increase less-than-proportional rate with the market return which is consistent with rational asset pricing model.
Table 2. Regression results of CSADt
To check the robustness of the results of this estimation, we verify the linearity of residuals. We applied the BDS test of Brocket al. (1996) on the residuals of EquationEquation (3)(3)
(3) to check whether the residuals are independent and identically distributed (iid). According to the results shown in Table , we strongly reject the null hypothesis H0 at level 1% that residuals are iid and we accept the alternative hypothesis H1. The nonlinearity can be also visually confirmed by the scatterplot of residuals in .
Figure 5. Scatterplot of EquationEquation (3)(3)
(3) estimation’s residuals
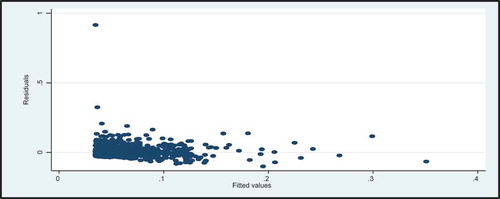
Table 3. BDS test
After examining the static model (EquationEquation 3(3)
(3) ) for the whole sample and with the strong evidence of non-linearity, the more robust process of rolling window regression methodology is used to assess the stability of the model’s parameters and to detect potential time-varying parameters. Since the values of the coefficients in the static model are sensitive to the selected sample period, and according to the results in Table where coefficients are approximately similar for all sub-groups, it is necessary to carefully consider possible variations in the estimation results by shifting more and more the sample period. Also, a structural break could render OLS estimates insufficient providing no information about the dynamics of the system before or after the break. If the parameters are truly constant over the whole sample, then we should expect no significant difference in the estimates over the rolling windows. We choose to a time-varying approach (Stavroyiannis & Babalos, Citation2017) based on a rolling window of 30 days. We select this window to be short enough to have enough windows in order to be able to derive a trend.V
Figures and show, respectively, the values of the coefficient and t-statistic based on rolling window where a positive value represents anti-herding periods and negative ones show evidence of herding behavior. Note that all periods of herding behavior the coefficient is statistically significant (see Table )
Figure 6. The coefficient based on rolling window (30 observations)
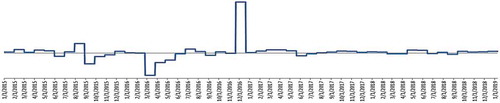
Figure 7. T-statistics based on rolling window (30 observations) and 5% critical value
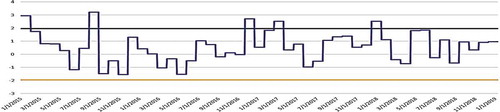
Table 4. Herding periods
Evidence of herding especially between 2016 and 2017 is explained by the new and fast-expanding cryptocurrency market due to its risky price volatility, lack of information disclosure, and the tendency of crypto traders to expect high positive outcomes. So, traders ignore the individual characteristics of cryptocurrencies and herd according to the performance of the cryptocurrency market. We note that the significance of herding periods is based only on rolling window t-statistic which is marginal rather than global.
To reinforce our study, we will try to find an explanation for the existence of herding behavior. In the literature, Bouri, Gupta et al. (Citation2018) found that the herding behavior can be explained by the presence of economic policy uncertainty. In this paper, we will investigate a relationship between herding behavior some factors as the inflation rate, the crude oil prices, and the Bloomberg consumer comfort index for USA extracted for the same period of our original data which is based on responses to a weekly, random-simple national telephone survey asking Americans to rate the economy, the buying climate and their personal finance as excellent, good, not so good, or poor. We attribute 1 to the periods of herding and 0 otherwise, then we implement a logistic regression.
In the logistic regression model, the relationship between Z and the probability of the event of interest is described by this link function.
where
is the probability of the ith case experiences the event of interest,
is the value of the unobserved continuous variable for the ith case,
The z value is the odds ratio. It is expressed by
where
is the jth predictor for the ith case,
is the jth coefficient,
P is the number of predictors,
βs are the regression coefficients that are estimated through an iterative maximum likelihood method. The results are reported in Table .
Table 5. Estimation of logistic model
The results reported in Table 5 show the significant inverse relationship between the consumer comfort index and herding behavior. A decrease in comfort will increase a herding behavior which means that when traders feel less comfortable, they will be less confident in their individual expectations and prefer to herd and follow the marker performance.
The decrease in consumer comfort can be explained by several events detected in the periods of herding behavior as: the increase in key interest rate by FED in 2015 and 2016, the declaration of Russian Central Banker that Bitcoin’s legal recognition is not guaranteed, and the OPEC cut of production which decreases the prices of oil. Also, in 2016, Trump wins the presidential elections in the USA where consumer confidence has reached post-recession highs in 2017.
The results in Table show that there is no significant relationship between the inflation rate, crude oil prices, and herding in cryptocurrency market. So these two factors are not the driving forces of herding behavior in cryptocurrency market according to the results of our regression.
Table 6. Estimation of logistic model
5. Conclusion
This paper contributes to the literature exploring the formation of behavioral-based patterns in cryptocurrencies market. We used the cross-sectional absolute deviation measure of Chang et al. (Citation2000) to detect herding behavior using a sample of 20 cryptocurrencies that constitute the MVIS large cap digital index from 1 January 2015 to 31 January 2019. The results show evidence of anti-herding behavior during the whole period and during three different sub-groups. Using a rolling window, we found evidence of herding behavior during several periods especially during 2016 until the beginning of 2017.
We applied a logistic regression to find an explanation for herding behavior based on the Bloomberg consumer comfort index, inflation rates, and crude oil prices for the same period. We found an inverse relationship between the index and herding behavior. And, we can see that during the year 2016 where herding behavior was excessive, the consumer comfort index decreases because Americans’ confidence suffered its biggest setback in more than a year as optimism about personal finances slumped. For inflation rates and crude oil prices, there is no significant relationship.
The existence of herding behavior in cryptocurrency is an indicator on market inefficiency and provoke higher levels of risk and volatility. So, this issue has to be taken into consideration by regulators in order to stabilize the market.
For future researches, we will incorporate other components of Bloomberg comfort index as Americans’ rate of the economy, the buying climate, and their personal finance. Also, we can include other indicators as Federal funds rate a measure of monetary policy.
Additional information
Funding
Notes on contributors

Amina Amirat
Amina Amirat is an Algerian citizen; she is an assistant professor in finance at college of business (Department of Finance and Economics - University of Jeddah) with an extensive academic experience and research skills. Prior to joining University of Jeddah, she worked between 2009 and 2016 as full position in high school of business (Algeria), central university (Tunisia), and Najran university (KSA). She published several articles in refereed journals and attended different international conferences.
Wafa Alwafi
Wafa Alwafi is a saoudian citizen; she is a lecturer in finance at college of business (Department of Finance and Economics -University of Jeddah). She is preparing PhD in finance and she is also a supervisor in Bloomberg international trade competition.
References
- Bouri, E., Gupta, R., & Roubaud, D. (2018). Herding behaviour in cryptocurrencies. Finance Research Letters.
- Bouri, E., Shahzad, S. J. H., & Roubaud, D. (2018). Co-explosivity in the cryptocurrency market. Finance Research Letters.
- Calderón, O. P. (2018). Herding behavior in cryptocurrency markets. Universitat Autònoma de Barcelona. Department of Applied Economics Spain.
- Calgar, G. E. (2018). Explosive behavior in the prices of Bitcoin and altcoins. Finance Research Letters, 29, 398–403.
- Chang, E. C., Cheng, J. W., & Khorana, A. (2000). An examination of herd behavior in equity markets: An international perspective. Journal of Banking Finance, 24(10), 1651–10.
- Christie, W. G., & Huang, R. D. (1995). Following the pied piper: Do individual returns herd around the market? Financ. Analytic of Journal, 51(4), 31–37.
- Hu, B., McInish, T., Miller, J., & Zeng, L. (2018). Intraday price behavior of cryptocurrencies. Finance Research Letters, 28, 337–342.
- LeClair, E. M. (2018. Herding in the cryptocurrency market. Research Gate.
- Stavroyiannis, S., & Babalos, V. (2017). Herding, faith-based investments and the global financial crisis: Empirical evidence from static and dynamic models. Journal of Behavioral Finance, 18(4), 478–489.
- Stosic, D., Stosic, D., Ludermir, T. B., & Stosic, T. (2018). Collective behavior of cryptocurrency price changes. Physica A, 507, 499–509. doi:10.1016/j.physa.2018.05.050
- Vidal-Tomas, D., & Ibanez, A. (2018). Semi-strong efficiency of bitcoin. Finance Research Letters, 27, 259–265. doi:10.1016/j.frl.2018.03.013