
 ?Mathematical formulae have been encoded as MathML and are displayed in this HTML version using MathJax in order to improve their display. Uncheck the box to turn MathJax off. This feature requires Javascript. Click on a formula to zoom.
Abstract
Purpose: The liquidation culture in South Africa has proven to be disastrous for its macroeconomic and social goals. Premised on the financial distress continuum theory, which not only determines investment, but also provides early warning signals for firms to pursue remedies, this article investigated the financial health and stability of listed firms. To detect and/or remedy the negative consequences of corporate failures in a timely manner, this study employed the De la Rey K-score model as a risk-based model. Design: The investigation period was over six years with a final sample of 673 company-year observations. This study used the statistical methods of one-way ANOVA and OLS. Findings: The results indicated that the average K-scores from 2011 to 2016 have severely declined, illustrating the magnitude of financial distress among industries. The mean K-score is in the healthy range for the consumer services and consumer goods sectors for each year of the investigation period. This study found that the telecommunications and health care sectors were classified as “grey” zone, which exhibited considerable inter-year variation in financial health. Whilst the industrial and technology sectors were financially distressed. This study also found a significantly positive relationship between the K-score and performance variables. Recommendations: This study recommends that the grey zone sectors should consider turnaround strategies to prevent companies from regressing into the financially distressed category. Furthermore, the distressed sectors should consider embarking on the two pre-insolvency proceedings in the Companies Act (2008). Originality: This study uniquely applied the K-score model as an early warning signal for financial distress and linked the K-score model to the financial distress continuum theory. The results of this study have important implications for policymakers, practitioners, and regulatory authorities, especially those in emerging economies.
PUBLIC INTEREST STATEMENT
For the continual growth of the global economy, it is vital that businesses remain as going concerns. The reality is that businesses are often faced with financial distress. Living in an environment with businesses closing down, constrains the consumer’s lifestyle needs due to the impacts of unemployment and inflation on society. If financial distress of companies were forecasted ahead of time, stakeholders could act proactively to pursue remedies to avoid losing these businesses. Since businesses do not simply fail or succeed but rather sit on a continuum of different degrees of progressing or regressing. Failure to effectively intervene when a company is regressing will result in corporate death. This study assessed the degree of financial distress in South Africa by categorising sectors into healthy, grey zone and financially distressed. In order to prevent financial distress, grey zone companies require turnaround strategies. However, distressed companies need more drastic pre-insolvency proceedings.
1. Introduction
The persistently depressed global economic environment has several negative implications particularly for developing countries. For instance, South Africa (SA) is an emerging economy with a well-regulated capital market but an ailing economy. In 2019, SA had its highest unemployment rate in over 16 years, standing at 29.1%, with 6.7 million people unemployed (SA Stats, Citation2019a). Burdened by rising administered prices and other taxes, consumers remain highly constrained and are increasingly disinclined to spend, specifically on non-essentials (IDC, Citation2019). The concomitant consequences of reduced spending negatively affects businesses, leading them into a financially distressed state. In this context, a hefty premium is placed on retaining jobs and on the sustainability of businesses, mainly due to the disproportionate level of unemployment in SA.
The Companies Act no. 71 of 2008 (herein referred to as “Companies Act”) highlights the corporate rescue of financially distressed SA corporations (Parliament of the Republic of South Africa, Citation2009), in an effort not to escalate the already high unemployment rate. Yet the estimated number of insolvencies still increased by 39,9% in the third quarter of 2019 compared with the third quarter of 2018 (SA Stats, Citation2019b). The high number of liquidations each year infer that SA is still plagued with a liquidation culture despite the contemporary rescue provisions under the Companies Act to aid ailing debtors. As cited in Kastrinou and Jacobs (Citation2016), this liquidation culture originates from the prevailing creditor-friendly approach to insolvency matters resulting in the slow move to a rescue culture. To avoid market stagnation, firms through their governing boards need to adapt to the fluctuating market conditions and pursue growth orientated strategies in order to maximise shareholders returns and for their long-term survival (Sewpersadh, Citation2019a). However, these growth strategies cannot be achieved as long as company information remains asymmetrical since there are risks of management’s adverse decision-making, which either diminish or expropriate shareholder value (Sewpersadh, Citation2019b).
When corporate giant, Steinhoff International’s share price plunged by 98% after one of the largest cases of corporate fraud in SA, this highlighted the need for established frameworks and systems that govern a firm’s internal operating controls and systems. This will assure stakeholders of value as well as wealth creation and maintenance. Emphasising the need for pre-emptive strategies rather than post-mortem exercises were the recent large corporate failures of African Bank collapsing due to bad debt, and Group 5 following major financial losses, amongst others. Formalising and legislating companies’ financial distress processes and business rescue practices recognises that there are few companies that fail without initially being identified, by one or more determinants, as financially distressed. An analysis of United Kingdom (UK) firms illustrated that a firm takes up to three years to enter a state of bankruptcy (Tinoco & Wilson, Citation2013). These early warning predictors can be detected by using analytics on a firm’s financial statements, which imposes the need for reliable predictive financial distress models.
This study contributes to the literature by extending the application of the financial distress continuum theoretical framework to the K-score model to examine the early warning signals for financial distress and/or failure. It contends that there are significant benefits in identifying these signals for financial distress in advance to avoid the corporate death of a company. The rest of the paper is organised as follows: research questions and hypotheses, the literature review ; a discussion on the research method; the results with discussion; and conclusion.
2. Research aims and hypotheses
Premised on the Companies Act, where the inability of a company to pay their debts is an indicator of financial distress (Parliament of the Republic of South Africa, Citation2009), and the financial distress continuum, this study sought to address this research question, “Can the K-score model serve as an early warning signal for financial failure?”. The developer, De la Rey (Citation1981), recommended that the model can be a failure prediction model as well as a risk-based model. For this reason, this study used the K-score as an early warning signal for financial distress since there is more value in early warning systems than a failure prediction model that dichotomously predicts failed or healthy firms. Additionally, this study used the financial distress continuum theory that supports the notion that companies are not simply failed or healthy but lie on a distress continuum that can either regress or progress (Cybinski, Citation2001).
Accordingly, the main objective of this study was to investigate the usefulness of the K-score model on the JSE listed companies as a financial distress predictor. The following research aims were identified:
To examine whether there is a degree of financial distress in JSE listed companies and if so, whether financial distress varies across the JSE sectors.
To determine the ranking order of JSE listed sectors in terms of financial health using the K-score model.
To investigate the relationship between the K-score and performance variables (firm growth and profitability). To achieve this aim, the following hypotheses were derived:
H0: There is no relationship between performance variables and the K-score.
H1: There is a significant relationship between performance variables and the K-score.
3. Literature review
3.1. De la Rey K-score
In SA, the Bureau of Financial Analysis at the University of Pretoria followed the multivariate model of Altman (Citation1968) and developed an MDA-based failure prediction model specifically from a domestic perspective. The K-score model was developed using 32 failed and 32 non-failed companies matched according to industry, size and age, like the “original” Altman Z-score. The companies used in the De la Rey (Citation1981) sample were from the industrial sector. However, over time some of these companies that were hotels and investment holdings have been reclassified in the current JSE listed sectors. The model was developed intuitively, according to a trial and error method, by testing 194 combinations of financial ratios, of which six were selected for the model. The De la Rey K-score model successfully scored 94.5% of non-failed firms and 98.6% of failed firms two years before failure. The average success rate was 96.6%. According to De la Rey, a score above + 0.2 is regarded as relatively safe whilst the most dynamic companies have scores between +0.6 and +0.8. The De la Rey K-score model’s zone of ignorance (grey area) stretches from -0.19 to + 0.2.
De la Rey (Citation1981) recommended that the K-score model should be used by banks as a credit evaluation procedure that would categorise companies according to their risk assessment. This model theorised that the further the business moved positively away from zero, the more financially sound it would be and accordingly it would have a lower probability of failing (De la Rey, Citation1981). Conversely, businesses will be financially unsound if the K-scores became negative. In this context, any company with a score below −0.19 would have a high chance of failure unless corrective action was taken and any business with a K-score of −0.2 or less would be well beyond saving (De la Rey, Citation1981). Van der Colff and Vermaak (Citation2015) used the De la Rey K-score in an attempt to build a failure prediction model with non-financial variables. A Cramer’s V statistical test indicated a strengthening relationship between the K-Score and the non-financial variables. However, the study had insufficient evidence to establish the supremacy of the proposed model beyond a reasonable doubt.
3.2. Financial distress continuum theory
Traditionally, the most successful failure prediction studies such as Altman (Citation1968) and De la Rey (Citation1981) have only considered the dichotomous classification of firms into failed or non-failed on the success-failure continuum. Subsequently, Cybinski (Citation2001) has posited the financial distress continuum theory, proposing that a company is not simply placed in a failed or non-failed status but can be positioned anywhere on a continuum.
Figure 1. Financial distress continuum
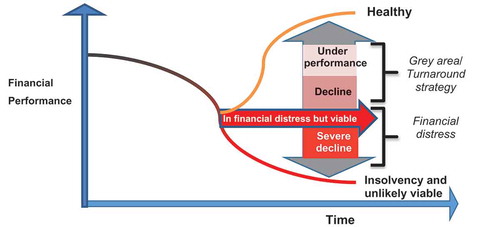
As illustrated in Figure , financial distress can be temporary in nature (grey area), or of a permanent nature (insolvent and unlikely to be viable). Temporary financial distress could potentially be the result of several determinants, the reversal of which is dependent on the early detection of financial distress and the success of the turnaround strategies implemented. As shown in Figure , if inappropriate or no action is taken to remedy the distress situation, a financially distressed company regresses from underperformance to decline followed by severe decline. In the severely declined state, the company becomes insolvent and viability is highly unlikely which turns into corporate failure.
3.3. The Companies Act (2008) and financial distress
The financial distress process is governed by each country’s legislation. In SA, the previous “Judicial Management” under section 327 to 440 of the Companies Act 1973 failed to assist financially distressed companies (Joubert, Citation2013). This led to the amended Companies Act, which aligned SA’s rescue procedure with those of international jurisdictions such as the United States of America (USA), the UK and Australia (Joubert, Citation2013).
In order to achieve firm growth, businesses often rely on leverage as a source of finance which has tax saving benefits but could attract financial distress costs (Sewpersadh, Citation2019c). Chapter 6 of the Companies Act describes “financially distressed” companies as “companies that are reasonably unlikely to be able to pay all of their debts as they fall due and payable within the immediately ensuing six months, or it appears to be reasonably likely that the company will become insolvent within the immediately ensuing six months” (Parliament of the Republic of South Africa, Citation2009). Accordingly, the Companies Act provides for the identification of two distinct distress phases in companies as “unable to pay debts” and “insolvent”. The Companies Act also provides for two pre-insolvency proceedings, these being, “Business Rescue” and “Compromise with creditors” (Parliament of the Republic of South Africa, Citation2009). These two mechanisms provide a debtor in financial distress with access to corporate reorganisation remedies to try to circumvent insolvency. The Companies Act defines “Business Rescue” as measures to facilitate in the recovery of a business that is financially distressed, by providing for:
provisional management and supervision of the business by a business rescue practitioner;
provisional moratorium on claimants’ rights against the business or its property; and
an approved plan to rehabilitate the business by restructuring its affairs to maximise the prospect of ongoing existence on a solvent basis, or to provide a healthier return for the business’s creditors or shareholders as compared to the business’s immediate liquidation.
However, should the business agree to a “Compromise with creditors” and all parties concerned consent to such a compromise, the court will dismiss the “Business Rescue” and make this concession an order of the court (Parliament of the Republic of South Africa, Citation2009). The financial distress continuum theory and the Companies Act are presented pictorially in Figure , showing when there is a decline in company performance over the short term that may be temporary in nature. Reorganisation processes are required to reverse the underperformance of the firm, the success of which depends on the timely corrective action of management, and/or informal creditor workouts. However, where a company’s economic value is greater than its liquidation value, the firm should reorganize using the formal business rescue procedures and continue to operate, which carries a high cost and a high failure rate. The futility of these rescue procedures would lead to imminent failure for the company, when the formal liquidation processes will be enacted.
Figure 2. Process of a financially distressed company
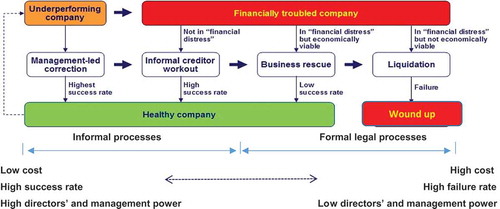
Figure 3. Liquidations over the last 12 years
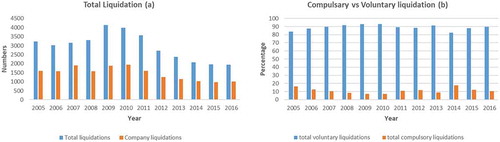
However, despite the amendment to the Companies Act, SA still has a culture of liquidations. With over 50% of the total liquidations comprising of companies liquidating each yearFootnote1 (see Figure (a)), the liquidation rate remains a significant problem in SA. Notably in Figure (a), the highest numbers of total liquidations were recorded at the height of the global recession in 2009 (4 133 liquidations) and 2010 (3 992 liquidations).
Of note, as seen in the slight peak in 2016 compared to 2015, there was an increase of 5.74% in 2016, with 43 more liquidations compared to 2015, specifically for companies (SA Stats, Citation2017). Since liquidation can be either voluntary or compelled by the Companies Act, it is evident that the common form of liquidations is voluntary, comprising more than 80% of the total liquidations (see Figure (b)). The majority of these voluntary liquidations represented in Figure (b) illustrate how companies exercise great caution when faced with financial distress by voluntarily entering into liquidation instead of being compelled to do so, thus indicating tacit compliance to the Companies Act, Section 22 (1) which prohibits reckless trading.
4. Research methodology
The study used descriptive statistics, discriminant analysis, and Pearson correlation to analyse the K-score and the other study variables (profitability, firm size, firm age, sector identity and the growth of the firm). The one-way analysis of variance (ANOVA) is an inferential statistical test that tests whether any of several means are different from one another. It assumes that the dependent variable has an interval or ratio scale, but it is also often used with ordinally scaled data. This study also used regression analysis to test for relationships between profitability and growth of the firm by employing the pooled ordinary least squares (OLS) model. For the selection of a fixed or random effects model, an overidentification testFootnote2 was employed. The Sargan-Hansen statistic is 21.55 (p-value = 0.07) which implies that the random effects estimator is most appropriate since the p-value is significant at 10%. The random effects estimator uses more orthogonality conditions than the fixed effects estimator, and these are responsible for the increased efficiency of the random effects estimator when compared to the fixed effects estimator (Schaffer & Stillman, Citation2010). However, the extra orthogonality conditions might not be valid. The null hypothesis is that they are valid, and a rejection implies that the fixed effect model is preferable.
For this study, secondary data from the JSE was collected for six successive years (2011 to 2016). The IRESS Research Domain was used to extract the financial variables for the K-score model from 673 annual reports. The robustness of the data and the equality of means was tested using the Welch test. The data were processed by using Microsoft Office Excel, Statistical Package for the Social Sciences (SPSS) and StataSE.
4.1. Data sampling techniques
A phased approach was applied to the JSE listed companies in the sample period (2011 to 2016) to eliminate companies listed on the Altx, venture capital market, secondary listings and traded securities. Additionally, companies with no inventory were eliminated because the K-score uses inventory as a variable in the model. Due to the differing nature of operations and accounting conventions, companies listed in the basic materials, oil and gas, and financial industries were excluded from the sample. The number of companies as well as the delisting of companies per sector in the year of the delisting is shown in Table . The highest number of delistings occurred in 2014 and the industrial sector recorded the most delistings (8) in the sample period of analysis.
Table 1. Sample of listed and delisted firms
4.2. Model selection
The K-score model for this study is employed for the following reasons:
The model has liquidity, profitability and efficiency ratios.
Evidence indicates that the seminal distress prediction models do not perform well when used to predict financial distress conditions (besides bankruptcy) for more recent and longer periods (Pindado et al., Citation2008).
Seminal distress prediction models when applied to countries other than the USA, even when the parameters are re-estimated, offers an inconsistent pattern in terms of significance and sign of the coefficients across different periods and countries (Begley et al., Citation1996; Grice & Dugan, Citation2001).
In addition to these reasons, the K-score model also accounts for inflationary effects on a company’s assets. The macroeconomic state of affairs is an important signal of a potential financial catastrophe for a firm, since the greater a firm’s sensitivity to inflation and to decreases in inventory levels, the greater the firm’s exposure to financial distress. However, the limitations of these early proponents and their subsequent successors in the failure prediction genre are the inability to capture the underlying economic variables. In this context, the selection of the K-score model is apt because the model’s financial ratios quantify the internal state of the firm and the prevailing macroeconomic conditions, appropriately assessing the external environment of the firm. The financial distress continuum theory can be effectively examined by the use of the K-score model because it distinguishes healthy, distressed and grey area firms. The K-score equation is illustrated below:
where a, b, c, d, e, and f are defined in Table . The function of—0.068881 at the end of the model is a constant, capturing the K-score when all else = 0. The K-score measures financial distress inversely, therefore the smaller the values of the K-score, the higher will be the risk of financial distress thus categorising companies as follows:
Healthy (>+0.2)
Grey zone (−0.19 to +0.2)
Financially distressed (<-0.19)
Table 2. Definition of variables used in the K-score model
4.3. Empirical model
Since the K-score model was proposed as a risk-based assessment tool, this study examined its effectiveness in creating value for the company. According to Drucker (Citation1954), the firm is an economic institution that creates value for stakeholders by profit-making and supporting growth to ensure the firm’s existence. Thus, it is essential to examine the relationship of the K-score concerning profitability and firm growth since these are essential for the firm’s continued existence. The proxy for the profitability is the return on sales (ROS = EBIT/Sales) and the firm’s growth is calculated as the market-to-book value less the total value of the company. This study uses OLS for the pooled cross-section time series data. The relationship between performance and the K-score can be written in functional form as Performance = f (K-score, firm age, firm size, sector ID). The model is proposed as:
where i indicates a particular firm, t (2011–2016) denotes the time in years, and ϵit is a stochastic error term that represents the unobserved time-invariant firm effects.
5. Results and discussion
The De la Rey model (Citation1981) uses a six variable MDA model to differentiate between “Healthy” companies and those that are “Likely to Fail”. The K-scores for listed and delisted firms in the sample were calculated and various analyses were conducted on the K-scores.
5.1. Descriptive analysis
Table shows the descriptive statistics for this study. The mean K-scores (i.e. aggregated across companies and years within an industry) that ranked sectors as healthy, grey zone or financially distressed is presented in Table . The sample (n = 673) had an average K-score of 0.159, which is in the grey zone (−0.19 to +0.20) with a standard deviation of 1.079. Only 46% of the companies in this study were healthy, 20% were in the grey zone and 34% were financially distressed. The industrial sector had the highest number of financially distressed companies (43%) followed by the technology sector (40%). Consequently, the technology sector also had the highest number of grey zone companies (32%). Consumer services (61%) and consumer goods (60%) sectors had the highest number of healthy companies.
Table 3. Descriptive statistics
5.1.1. Financially healthy
As can be seen from Table , consumer services (0.62) and consumer goods (0.40) were classified as financially healthy since these sectors had the highest K-scores on average, with the standard deviations of both sectors being 1.1 and 0.98 respectively. According to De la Rey (Citation1981), most dynamic companies have K-scores between +0.6 and +0.8. Therefore, the consumer services sector have the most dynamic companies of all the other sectors. The consumer services sector was also ranked as the best performing sector, which is evident, by the large difference in the average K-scores between consumer services and the sector ranked second, consumer goods. In a study by Sewpersadh (Citation2019c), it was found that the consumer goods sector had the lowest leverage when compared to the other JSE sectors. The theoretical value of debt as well as the accompanying risks, could prove disastrous in a distressed economy (Sewpersadh, Citation2019c).
5.1.2. Grey zone category
From Table , it can be seen that the telecommunications and health care sectors were classified as the grey zone area of ignorance, showing that these sectors are neither healthy nor distressed. Under the financial distress continuum theory, the grey zone sectors are placed precariously on the continuum where a decline in performance may lead to financial distress. The grey zone sectors enact turnaround strategies expeditiously to improve their sector performance thus moving up the continuum into the healthy category. However, the failure to implement turnaround strategies or the inadequacy thereof may regress these sectors into the distressed category. The negative mean of the health care sector (−0.023) implies that the performance of this sector is worse than the telecommunications sector’s positive mean (0.012). With reference to Figure , it is evident that the health care sector is declining on the distress continuum, and is shown to be in a precarious situation of regressing down the continuum into the financially distressed category. This supports the results of the study by Sewpersadh (Citation2019c) that found that the health care sector had the highest leverage amongst the other JSE sectors. The study cautioned that it is extremely risky for the health care sector to be so highly geared, and that it may face financial distress if its profits decline or interest rates rise (Sewpersadh, Citation2019c). The telecommunications sector is underperforming on the continuum and, without any intervention, may decline, eventually regressing to financially distressed.
5.1.3. Financially distressed
The industrial (−0.195) and technology (−0.244) sectors had the lowest mean K-scores when compared to the other JSE sectors. With reference to Figure , industrial and technology sectors are under the financial distress category, where these companies will have to consider the two pre-insolvency procedures under the Companies Act to facilitate their recovery. There is a significant difference in the K-scores categories between the most financially distressed sector, technology and the declining grey zone sector, health care (−0.023). The technology sector was found to be the worst performing sector and consequently ranked last. The predictive powers of the K-score can be seen in the demise of Gijima Group Ltd from the technology sector, where the K-score was −3.18 in 2011, thereafter declining to −3.48 in 2014 and subsequently delisting in 2015. Similarly, Securedata Holdings Ltd also showed early warning signals, with K-scores of −1.78 in 2011, declining to −1.55 in 2013, before delisting in 2014.
5.2. ANOVA F-test
The ANOVA test was used in analysis to test the average difference of the K-scores of all sectors in this study. The ANOVA F-test provides a method of aggregating the differences among the means of multiple groups and testing this study’s null hypothesis of no difference in the means as opposed to the alternative. The sum of squares between-groups, “Mean Square Treatment”, examines the differences among the group means by calculating the variation of each mean around the grand mean; whereas, the sum of squares within-groups examines the variation of individual scores around each group mean “Mean Square Error”. In the case of variance analysis, the ANOVA table (Table ) shows the mean between-groups and within-groups, while the significance level below 0.05 shows a statistically significant correlation.
Table 4. K-scores across sectors
In Table , ANOVA tests whether there is a significant difference in the average K-scores depending on which sector the K-score derives from. There are significant differences in the average K-scores across sectors: F (5, 116) = 2.864, p =.018, MSerror = 0.922, α = .05. However, the p-value is less than α level, and accordingly, this study rejects the null hypothesis that all the means are equal.
5.3. Trend analysis
The trend analysis was examined by the aggregated sector K-scores, plotted in the graph below. In Figure , the average K-scores for all the periods under examination are shown to be in the grey zone of ignorance. Therefore, the annual mean K-scores illustrate that the SA market is declining, as can be seen by the downward trend in the graph (Figure ).
Figure 4. Analysis of K-score variables across the entire sample
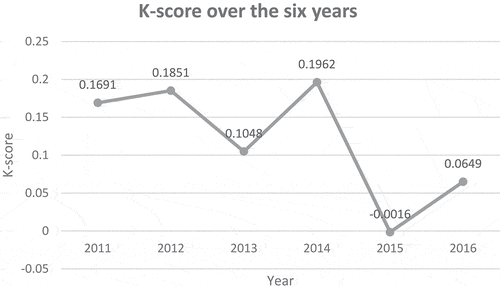
It is also evident in the graph that the worst performing year for this study is in 2015, which can be explained by a report published by Deloitte Touche Tohmatsu Ltd, where Gwala (Citation2016) outlined the following factors that severely depressed the SA economic environment in 2015:
The rand is one of the currencies most exposed to China, hence, after the People’s Bank of China devaluated the Yuan by 2%, the rand lost approximately 26% of its value.
From January 2015 to January 2016, the rand weakened more than 40% against the dollar, which represented the biggest fall compared to currencies of other outsourcing countries.
Consumers were severely constrained due to the interest rate increase of 25 basis points in November 2015 and the maize price increase of 50% from December 2015.
As seen in Figure , the recovery in 2016 was not robust enough since the K-score is the second-worst score for the entire six-year period shown.
5.4. Correlation matrix
The correlation analysis is presented in Table shows that, ROS has a significantly positive relationship (p < 1%) with the K-score, firm size and firm growth, implying that with increases in ROS there will be increases in the K-score, firm size and firm growth. However, there is a 10% significantly negative relationship between ROS and sector identity. There is a significantly positive relationship (p < 1%) between growth and ROS, K-score, firm size and firm age.
Table 5. Pearson correlation matrix
5.5. Regression results
In Table , it can be seen that the coefficient of multiple determination for the pooled OLS (R2 = 0.47) and random effects (R2 = 0.46) in examining ROS are higher than the coefficients for growth’s pooled OLS (R2 = 0.17) and random effects (R2 = 0.6). Higher R-squared values represent smaller differences between the observed data and the fitted values.
H1: There is a significant relationship between performance variables and the K-score
In Table , the hypothesis is supported due to the significant relationship between the performance variables (ROS and growth) and K-score. As illustrated in Table , the K-score has a significantly positive relationship (p < 1) with ROS in both OLS and the random effects model. However, growth has a 1% and 5% significantly positive relationship with the K-score in the OLS and random effects model respectively.
Table 6. OLS and random effects results
In Table , it can also be seen that there is a significantly positive relationship between the control variable (firm size) and ROS, as well as growth in all the models. This implies that with an increase in the size of a company, there are increases in the ROS and growth of the company. This can be explained by the fact that the expansion of the company enables it to have enough resources to boost sales and firm growth. However, firm age has a significantly negative relationship with ROS and growth. This implies that as a firm establishes itself in industry, there are decreases in ROS and growth of the company. This finding suggests that in the initial years of the incorporation of a firm, there is significant profitability and growth that then reaches a plateau and thereafter declines. In older companies in industry, this negative correlation could be explained by their inability to stay relevant by keeping up with the changes in the market and due to the lack of innovation to drive sales and growth.
6. Conclusion
The purpose of this study was to investigate whether there is a presence of financial distress in JSE listed firms under the various sectors using the K-score model. To achieve this objective, a total of 673 annual reports was examined from 122 companies in six sectors over a six-year period of analysis. The results revealed that the only two financially sound sectors are, the consumer goods and services sectors. Notably, this study has shown that the industrial and technology sectors are financially distressed sectors within the JSE. The technology sector was found to be the most distressed in comparison to all the sectors and is thus ranked last. As these sectors contribute to the SA economic environment, the corporate death of the productive entities under these sectors will lead to economic and societal costs. The two pre-insolvency proceedings under the Companies Act should be consulted, since if these distressed sectors are ignored or ineffectively remedied, there will be a rise in liquidations. Notably, there is a small difference in the negative K-scores between the industrial and technology sectors. The K-score model has some valuable predictive powers, since two companies from the industrial sector in this study’s sample illustrated early warning signals of extreme distress due to their K-scores being below −0.2 for all the years from 2011 to 2016. For instance, Buildmax Ltd's worst K-scores of −3.37 (2011) and −3.8 (2016) illustrate early warning signals of extreme distress that were insufficiently addressed thus culminating in this company's delisting in 2018. Similarly, Basil Read Holdings Ltd showed their lowest K-scores of −1.43 (2012) and −3.15 (2014), and in 2018 its shares plummeted from 23 cents to 1 cent, eventually resulting in a delisting from the JSE.
The health care and telecommunications sectors exhibited early warning signs of financial distress by lying in the grey zone of ignorance on the financial distress continuum. The financial continuum theory suggests the need to institute management efficiency actions to prevent firms in the grey zone from regressing into financial distress. If these early warning signals are disregarded or fruitlessly managed, these companies will become financially distressed. The health care sector is already highly leveraged which carries financial risks, and coupled with a negative K-score, implies a high risk of becoming financially distressed.
The ranking order of performance per sector was also presented in this study, where it was found that the consumer services sector is ranked first and technology being ranked last. Furthermore, this study illustrated a downward trend in the SA economic environment by the declining average K-scores during the six-year period of analysis, which requires government intervention. It was also revealed that 2015 was one of the worst performing years in SA as evidenced by the lowest average K-score in the six-year period under examination. This was explained by the currency attacks on the rand, which resulted in its continued weakening during 2015 and revealed a grim recovery in 2016.
In addition, this study also showed significantly positive relationships between K-score and the performance variables, ROS and growth. Therefore, this finding illustrates that, should turnaround strategies be directed towards profitability and growth in the distressed and grey area sectors, there will be an increase in the K-scores leading to companies progressing along the financial distress continuum into the healthy category.
7. Recommendations
This study recommends that a focus on case study research may be useful in establishing a timeframe for early warning signals and to determine which variables are pushing the firms into the grey or distressed zones. Furthermore, research examining quantitative and qualitative failure prediction models comparatively, to determine the best failure prediction model would be applicable to emerging markets, may be useful. Particularly, the coefficient on current ratio, inventory efficiency, and cash flows does not show a consistent pattern of significance and should be replaced in the development of a new failure prediction model.
8. Limitations
The findings of this study may not be generally applicable to developed economies. The risk-based model, K-score employed in this study may also have limitations.
Additional information
Funding
Notes on contributors

Navitha Singh Sewpersadh
Navitha Singh Sewpersadh CA(SA) ACMA CGMA, is a double board certified chartered accountant (SAICA and CIMA). The focus of her research is on corporate governance, financial distress and the 4th industrial revolution. Navitha’s research can be found on her author page, https://www.researchgate.net/profile/Navitha_Sewpersadh. Navitha is a reviewer for accredited international journals namely, International Journal of Finance and Economics; Journal of Economics, Finance and Administrative Science; Journal of Accounting in Emerging Economies; and African journal of business and economic research.
After holding various senior management positions in the public sector, Navitha moved to the private sector and worked for Mondi Ltd before finally pursuing an academic career in UKZN. Navitha provides postgraduate lectures on advanced accounting and financial management. She also supervises honours and masters students. Navitha serves as a member on the SAICA disciplinary committee and on UKZN teaching and learning committee.
Notes
1. Total liquidation includes companies, close corporations, partnerships and individuals.
2. This study used the stata command, “xtoverid” as an overidentification test which under conditional homoskedasticity is asymptotically equivalent to the usual Hausman test but extends directly to heteroskedastic and cluster-robust versions.
References
- Altman, E. L. (1968). Financial ratios, discriminant analysis and the prediction of corporate bankruptcy. The Journal of Finance, 23(3), 589–16. https://doi.org/10.1111/j.1540-6261.1968.tb00843.x
- Begley, J., Ming, J., & Watts, S. (1996). Bankruptcy classification errors in the 1980s: An empirical analysis of Altman’s and Ohlson’s models. Review of Accounting Studies, 1(4), 267–284. https://doi.org/10.1007/BF00570833
- Corporate Renewal Solutions, 2009. CRS turnaround management. [Online]: [Retrieved February 7, 2017, from http://www.turnaround-sa.com/timeline%20of%20financial%20distress/liquidation.php
- Cybinski, P. (2001). Description, explanation, prediction – The evolution of bankruptcy studies? Managerial Finance, 27(4), 29–44. https://doi.org/10.1108/03074350110767123
- De la Rey, J. H. (1981). Finansiele verhoudingsgetalle en die voorspelling van finansiele mislukking by nywerheidsondernemings in die Republiek van Suid-Afrika (“Financial ratios and the prediction of financial distress of industrial companies in the Republic of South Africa”). University of Pretoria: Bureau of Financial Analysis.
- Drucker, P. F. (1954). The practice 0f management. Harper & Row.
- Grice, J. S., & Dugan, M. T. (2001). The limitations of bankruptcy prediction models: Some cautions for the researcher. Review of Quantitative Finance and Accounting, 17(2), 151–166. https://doi.org/10.1023/A:1017973604789
- Gwala, S. (2016). Rand depreciation. Deloitte Touche Tohmatsu Limited.
- IDC. (2019) . Economic trends: Key trends in the South African economy, Sandton. The department of Research and Information, Industrial Development Corporation of South Africa Ltd.
- Joubert, T. (2013). ‘Reasonable possibility’ versus ‘Reasonable prospect’: Did business rescue succeed in creating a better test than judicial management? Journal of Contemporary Roman-Dutch Law, 76, 550–563. https://ssrn.com/abstract=2430581
- Kastrinou, A., & Jacobs, L. (2016). Pre-insolvency procedures: A United Kingdom and South African perspective. Reimagining Rescue, 91–108. http://irep.ntu.ac.uk/id/eprint/29645/1/6974_Kastrinou.pdf.
- Parliament of the Republic of South Africa. (2009). Companies Act No. 71 of 2008. Government Gazette.
- Pindado, Julio, Luis Rodrigues, and Chabela de la Torre. (2008). “Estimating financial distress likelihood.” Journal of Business Research 61(9), 995-1003. https://doi.org/10.1016/j.jbusres.2007.10.006
- SARB, 2017. Rates: SARB. [Online]: [Retrieved October 15, 2017 https://www.resbank.co.za/Research/Rates/Pages/Rates-Home.aspx.
- Schaffer, M., & Stillman, S., 2010. xtoverid: Stata module to calculate tests of overidentifying restrictions after xtreg, xtivreg, xtivreg2 and xthtaylor [Online]: Retrieved March 23, 2019 http://ideas.repec.org/c/boc/bocode/s456779.html.
- Sewpersadh, N. S. (2019a). Governing board attributes as profitability influencers under endogeneity: An econometric analysis in South Africa. ACRN Journal of Finance and Risk Perspectives, 8(1), 133–151. https://doi.org/10.35944/jofrp.2019.8.1.009
- Sewpersadh, N. S. (2019b). An examination of CEO power with board vigilance as a catalyst for firm growth in South Africa. Measuring Business Excellence, 23(4), 377–395. https://doi.org/10.1108/MBE-10-2018-0083
- Sewpersadh, N. S. (2019c). A theoretical and econometric evaluation of corporate governance and capital structure in JSE-listed companies. Corporate Governance: The International Journal of Business in Society, 19(5), 1063–1081. https://doi.org/10.1108/CG-08-2018-0272
- Stats, S. A., 2017. Statistics South Africa. [Online]: Retrieved November 15, 2017, from http://www.statssa.gov.za/.
- Stats, S. A., 2019a. Unemployment rises slightly in third quarter of 2019. [Online]: Retrieved December 28, 2019, from http://www.statssa.gov.za/wp-content/uploads/2019/10/qlfs_fig1.jpg
- Stats, S. A. (2019b). Statistics of liquidations and insolvencies. Statistics South Africa.
- Tinoco, M. H., & Wilson, N. (2013). Financial distress and bankruptcy prediction among listed companies using accounting, market and macroeconomic variables. International Review of Financial Analysis, 30, 394–419. https://doi.org/10.1016/j.irfa.2013.02.013
- Van der Colff, F., & Vermaak, F. (2015). Predicting financial distress using financial and non-financial variables. Journal of Economic and Financial Sciences, 8(1), 243–260. https://doi.org/10.4102/jef.v8i1.93