
 ?Mathematical formulae have been encoded as MathML and are displayed in this HTML version using MathJax in order to improve their display. Uncheck the box to turn MathJax off. This feature requires Javascript. Click on a formula to zoom.
Abstract
The paper investigates the impact of an unconventional monetary policy of the U.S. on the institutional investor flows in India. We assess the relationship between institutional investor flows and market returns before, during and after the U.S. quantitative easing (QE) period. We find a bi-directional Granger causality between domestic institutional investor flows and market returns in the pre QE period. However, the post QE period shows a bi-directional Granger causality between foreign institutional investor flows and market returns. This indicates that the power to influence market returns in India has shifted from the domestic institutional investors to foreign institutional investors during the QE period. Thus, we find evidence for a change in the market dynamics of an emerging country due to spillover effects of an unconventional monetary policy of a foreign country.
PUBLIC INTEREST STATEMENT
Monetary policies of advanced countries have spillover effects on emerging economies. In this paper we examine the impact of the U.S. quantitative easing (QE) policy on the Indian capital markets. We use daily data on institutional capital flows and market returns in India from 2007 to 2017. Our econometric analysis indicates that the volatility of foreign capital flows in India around the QE period has increased the impact of foreign institutional investors (FII) on the Indian capital markets. In the pre-QE period, domestic institutional investors (DII) influenced market returns in India. However, in the post-QE period FIIs influence market returns. This changing dynamic indicates the importance of understanding and using FII flows in forecasting capital market returns in India.
1. Introduction
Global financial integration has made emerging economies sensitive to the policy changes of the developed countries. Literature indicates that monetary policy changes of the developed countries have spillover effects on other economies (e.g., Bowman et al., Citation2015; Kim, Citation2001; Mackowiak, Citation2007). The spillover effects on the receiving countries is, at times, larger than the domestic effect of the policy on the initiating country.Footnote1 The magnitude of the spillover depends on the country characteristics of the receiving country (Georgiadis, Citation2016).
The objective of our paper is to evaluate the spillover effects of an unconventional monetary policy of a developed country on an emerging economy. Specifically, we investigate the spillover effect of an unconventional monetary policy of quantitative easing (QE) implemented by the U.S. Federal Reserve as a response to the global financial crisis of 2007–08 on an emerging economy, India, using (high frequency) daily data from 2007 to 2017. We assess the role of institutional capital flows as a channel for the policy spillover. We analyze the investments made by the institutional investors before, during and after the U.S. QE period. We study the foreign institutional investor (FII) flows and domestic institutional investors (DII) flows separately to understand the effect of policy spillover on the investment patterns of these two major group of players. Also, through Granger causality tests, we analyze the robustness of the Indian capital market in attracting institutional investors through the market returns.
Policymakers use unconventional monetary policies during crisis to supplement the traditional policy tools (Dedola et al., Citation2013). Literature indicates that unconventional policies are unusually large isolated events that have international spillover effects (Chen et al., Citation2016; Georgiadis, Citation2016; Hajek & Horvath, Citation2018; Neely, Citation2015). The U.S. QE policy led to investors rebalancing their portfolios impacting capital flows globally (Fratzscher et al., Citation2016). We choose FII as a proxy for foreign institutional investment as FII’s being highly liquid, reflect the impact of policy changes more quickly than any other form of foreign investment (e.g., foreign direct investment).
Emerging economies are affected more strongly and quickly by the external policy spillovers than the large and developed economies (Mackowiak, Citation2007). In the emerging economies, the U.S. QE policy led to an increase in the inflow of foreign capital during the QE period and a large capital outflows back to the U.S. market at the end of the QE period (Gagnon, Raskin, Remache and Sack, Citation2011; Bouraoui, Citation2015). The capital flow volatility due to the QE policy affected market liquidity leading to severe market fluctuations in the emerging economies (Rajan, Citation2015).
Our focus on the study of capital flows is a result of the importance of foreign investment for emerging economies as well as the limited ability of emerging economies to control these flows. Literature has documented that strategic foreign capital inflows promotes industrial growth in emerging economies (e.g., Aizenman et al., Citation2013). However, this relationship breaks down during crisis (Igan et al., Citation2016). Emerging countries may implement transitory capital controls to curb the sudden volatility in foreign flows. Research documents that capital controls had a limited impact on the foreign capital flows in India during the financial crisis (Patnaik & Shah, Citation2012). Country level studies on China (Ho et al., Citation2018) and Brazil (Barroso et al., Citation2016) indicate that the capital flows was an important channel for transmission of the spillover effect.
A significant share of the total FII inflows in India is from the U.S. Data indicates that the share of the U.S. was 44 percent of the total FII flows in 2004 (SEBI, Citation2004). Though this share has reduced to 32 percent in 2017, the U.S. is still the largest source of FII flows in India (CDSL, Citation2017). During the U.S. QE period, India received the third largest equity inflow from the U.S. among the emerging economies after China and Brazil (Khatiwada, Citation2017). Hence we test the impact of the U.S. QE policy on Indian capital markets.Footnote2
Prior literature on Indian capital market indicates that FII’s do not destabilise the markets and FII flows are caused by the returns in the stock market (Batra, Citation2003; CitationAhmad et al., 2005; Chandra, Citation2012; Vardhan & Sinha, Citation2016). However, the volatile capital flows in India during the period under review raise questions such as: How do the changing foreign capital inflows affect the Indian capital markets? How do the domestic investors respond to this volatility? Do these capital shocks affect the influence of domestic and foreign investors on the Indian capital markets?
Our results indicate a shift in the power to influence market returns from the DII’s to the FII’s during the QE period. Capital market returns in India have been a pull factor for the investment flows of both the DII’s and the FII’s during the entire period under study. In the pre QE period, we find a bi-directional Granger causality between the DII flows and the capital market returns. However, the post QE period indicates a bi-directional Granger causality between the FII flows and capital market returns. Thus, the spillover effects of the U.S. QE policy have altered the internal market dynamics in the Indian capital markets.
The contribution of our paper is threefold. First, we test the effect of an unconventional monetary policy of a developed country on an emerging economy. We extend the literature on the international spillover of unconventional monetary policies (e.g., Aït-Sahalia et al., Citation2012; Neely, Citation2015). Using the Indian capital market setting, we show that the spillover effect of the QE policy has resulted in a new institutional investor dynamics in India.
Second, the paper extends literature on the growing role of institutional investors as major capital market players in the emerging economies (e.g., Lakshman et al., Citation2013). This is the first paper to test the effects of the QE policy on the institutional investor flows in the Indian capital markets. Our analysis duration from 2007 to 2017 enables us to evaluate the full impact of the QE policy covering periods before, during and after the U.S. QE. Our paper extends the causality studies on the impact of institutional investors in India. Though prior research suggests that FII flows do not destabilize the Indian capital markets (Batra, Citation2003; CitationAhmad et al., 2005 ; Chandra, Citation2012; Vardhan & Sinha, Citation2016); our results provide evidence for an increase in the influence of FII’s in the post QE period in India.
Third, we establish the robustness of the Indian capital markets in influencing the investment flows. Our results support literature findings that U.S. investors looked at emerging markets for better returns during the QE regime causing an acceleration of capital flows to emerging markets (e.g., Bhattarai et al., Citation2018). We find that Indian capital market returns have influenced the institutional investor flows for both the DII’s and the FII’s throughout our study period.
The remainder of the paper is organized as follows. Section 2 introduces the data followed by the methodology in Section 3. Section 4 reports the results and discussion of results. Section 5 presents our robustness checks and Section 6 provides concluding remarks.
2. Data
We use three primary variables for our analysis: index returns, FII net flows and DII net flows. We use daily index returns from the National Stock Exchange (NSE)Footnote3 as a proxy for market returns. NSE was the first exchange to introduce a fully automated screen based trading system in India. The NSE NIFTY 50 index is a well-diversified 50 companies index reflecting overall market conditions in India. We collect the daily index values from the stock exchange website.
We use daily net purchase data for domestic institutional investors (DII’s) and foreign institutional investors (FII’s) collated and released by the National Stock Exchange (NSE) of India. This data is available separately for the FII’s and the DII’s. The data includes all the activities such as trades done in the secondary market, primary market and activities involved in right/bonus issues, private placement and merger & acquisition undertaken by FII’s and DII’s in the Indian capital markets. The data is reported in INR every day by NSE. We assume that the NSE uses appropriate rates for conversion from foreign currency to INR. This data was first made available publicly for both DII’s and FII’s on 16 April 2007 by the NSE and hence we start our analysis from this date. Thus, our study covers the period April 2007 to May 2017 having a total of 2,462 trading days.
To test the cumulative impact of FII’s and DII’s we calculate a variable: All Institutional Investors (AIIs). We restrict the scope of AIIs to the cumulative investment of FIIs and DIIs for this paper. Appendix 1 presents the details of the variables used.
3. Methodology
3.1. Granger causality testing
We test the causality relationship between institutional investor flows and market returns using the Granger’s Causality Test. Our choice of the bi-directional causality test is motivated by the need to explore the possible endogeneity between institutional investor flows and market returns. Granger’s Causality Test (Granger, Citation1969) is used to test the existence of a temporal statistical relationship between two variables. The standard Granger’s Causality Test examines whether past changes in one stationary variable X help to predict current changes in another stationary variable Y, beyond the explanation provided by past changes in Y itself. If not, then X does not “Granger cause” Y.
Granger’s definition of probabilistic causality assumes 3 basic axioms: (i) the cause must precede the effect in time (ii) the cause contains some unique information concerning the effect’s future value and (iii) while the strength of causal relations may vary over time, their existence and direction are time-invariant (Granger, Citation1980). Granger viewed theconcept of causality as essential to a decision-science approach for analyzing economic behavior. Causes would be understood as inputs to a fixed decision rule, “effects” the observed outputs. Thus, the test helps to identify the presence of a relationship as well as measure its impact over the period considered.
Granger’s Causality measures precedence and information content but does not by itself indicate causality, as is normally understood. The true significance of Granger’s Causality pertains only to a correlation between the current value of one variable and the past values of others (Brooks, Citation2008). The optimal lag lengths are determined by AIC or Akaike Information Criteria.
We run bivariate regressions of the form:
where x and y are the institutional investor flows and market return respectively and the optimal lag length is l. We test the null hypothesis of “no-Granger-causality” between x and y using the standard linear F-test. We test whether the institutional investor flows impact the market returns or vice versa, based on Chi square statistics (Wald statistics) and the resulting p-values. Rejecting the null hypothesis indicates the presence of Granger-causality between the two variables.
We run our causality tests to evaluate the relation between (i) Net foreign institutional investors flows and stock market returns; (ii) Net domestic institutional investors flows and stock market returns and (iii) Net All institutional investor flows and stock market returns
3.2. Sub-period analysis
In this paper, we focus on the quantitative easing policies announced by the U.S. as a response to the global financial crisis. We implement a sub period analysis to examine how consistent the causality has been before, during and after the U.S. QE period. Similar to any monetary policy, the spillover effect of the QE announcements is not immediate. However, the announcements mark distinctive shifts in policy that merit separate analysis to understand its impact. Sub-period analysis helps examine the “broad picture” to identify evolving patterns between key variables. These patterns are useful to improve the forecasting efficiency of market returns and capital flows.To study the impact of the U.S. QE on the Indian capital markets, we identify key dates to determine a timeline for our test. These dates are derived from public statements. We use data from Factiva to screen through the key announcements to identify our event windows. For our analysis, we have identified 25 November 2008 to 18 December 2013 as the duration of the U.S. QE period. Refer Appendix 2 for the key event timeline. Based on the timeline, we divide the total period under study into three sub-periods: pre-QE, during QE and post-QE.
4. Results and analysis
4.1. Descriptive statistics and correlation analysis
We present data on the growth of Indian capital markets in Table . The stock market capitalization has grown at a CAGR of 13.5 percent over the period under study. Table shows the net investment made by institutional investors in Indian capital market over the period analyzed. The FII flows reduced at the start of the crisis period. Post which, there has been a growth in the FII flows which has tapered down at the end of the quantitative easing period. Table presents the summary statistics for the entire data comprising of 2,462 market days. The returns show high kurtosis indicating the presence of heavy tails or outliers. We have not adjusted for the outliers in our data to have a more representative analysis of the market returns over a long period.
Table 1. Overview of the Indian Capital Markets (National Stock Exchange of India)
Table 2. Net FII and net DII investment flows in India
Table 3. Descriptive statistics
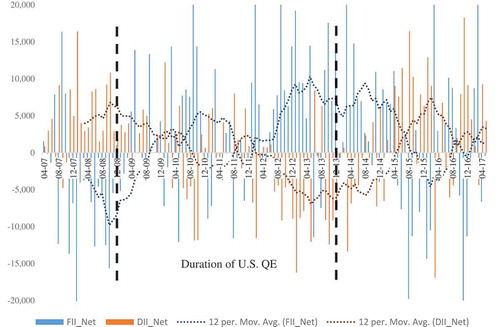
We find that there is a negative correlation between FII and DII net flows (Table ). Domestic investors play a stabilizing role in the face of the volatility in foreign capital flows. Domestic investors create a market smoothing effect. However, this correlation has become less strong in recent periods. Refer Figure for the investment trend over the period analyzed.
Table 4. Correlation analysis
Figure 1. Net FII and net DII investment flows in India
4.2. Study of stationarity and normality
The standard Granger Causality test is performed on a stationary series. To test whether the time series is stationary or not, we employ the Kwiatkowski–Phillips–Schmidt–Shin (KPSS) test. The null hypothesis of the KPSS test is that the series is stationary. We test both the index returns and institutional flows for stationarity. Based on the KPSS tests, we can conclude at 5 percent LOS that the index returns are stationary. However, the institutional flows (both DII flows and FII flows) are not stationary. When the individual series are non-stationary, a first difference transformation is used to obtain stationarity. We create two new series ΔDII net flows and ΔFII net flows. We again use KPSS test to check for stationarity of the first difference series. The new series are stationary. Hence we use the first difference of DII flows and FII flows for our Granger causality tests.We also test for the normality of index returns. The series is not Normal, as can be seen from the JB Statistics (Jarque Bera is very high for the period under study:13816). This is similar to several other studies that indicate similar return characteristics (e.g., Peiro, Citation1999). Normality of data is not an assumption of the Granger causality test. Also, the Wald statistic we use is robust to several non-normal distributions.
4.3. Granger causality flows
We have checked for stationarity of variables. Using stationary variables, we can conduct the Granger Causality test—whether institutional investment flows “Granger-cause” stock market returns or vice versa—as the series are stationary. We use a bi-directional Granger causality test to determine the direction of the causality among variables. Table shows a summary of Granger Causality results between returns and flows.
Table 5. Test of Granger causality between returns and flows using U.S. QE event window
4.3.1. Analysis of causality between FII flows and stock market returns
The analysis for the whole period from April 2007 to May 2017 shows that stock market returns “Granger cause” FII flows. However, if we take a look at the period pre and post the QE, we find that the impact of FII flows on stock market returns has increased. In the pre-QE period, only the stock market returns “Granger caused” FII flows. However, post the QE window, FII flows have a bi-directional causality with stock market returns. Thus, we do not reject the null hypothesis in the pre QE period at 5 percent LOS. However, we reject the null hypothesis in the post QE period.
4.3.2. Analysis of causality between DII flows and stock market returns
The analysis for the whole period from April 2007 to May 2017 shows that stock market returns “Granger cause” DII flows. However, if we take a look at the period pre and post the QE, we find that the impact of DII flows on stock market returns has decreased. In the pre-QE period, DII flows have a bi-directional causality with stock market returns. However, post the QE window, stock market returns “Granger cause” DII flows. Thus, we reject the null hypothesis in the pre QE period, but we do not reject the null hypothesis in the post QE period.
4.3.3. Analysis of causality between AII flows and stock market returns
The analysis for the whole period from April 2007 to May 2017 shows that stock market returns “Granger cause” AII flows. Post the QE period, AII flows and returns exhibit a bidirectional causality. Thus, we reject the null hypothesis in the post QE period only.
4.3.4. Impact of QE1, QE2 and QE3 announcements
On further sub-dividing the QE period based on announcements of QE1, QE2 and QE3, we find that the direction of causality is consistent over the QE period. During the QE, market returns “Granger cause” FII and DII flows. Refer Panel B of Table .
4.4. Increase in influence of FII’s
If we look at the data for the whole period from April 2007 to May 2017, we see that the stock market returns “Granger Causes” both DII and FII flows. Though we present data for NSE Nifty index only, we get qualitatively similar results using BSE Sensex index.Footnote4 Thus, we can say that it is the robustness of the markets that influences the institutional investor flows. This is a positive sign for the strength of the stock markets in India.
Next, we analyze the results for the sub-periods studied. In this paper, we have used the events of the QE program to understand the change in causality with the stock market. Before QE was announced, DII flows (not FII flows) and stock market returns exhibit a bidirectional causality. During the QE, the markets appear robust, and only the stock market returns Granger Cause both FII and DII flows. However, in the post QE window, the trend changes to FIIs flows (not DII flows) and stock market returns exhibiting a bi-directional causality. Pre QE the DIIs had an impact on the market. During and post the QE regime, the activities of FIIs have a stronger influence on the stock market returns. The impact of institutional investors on index returns has become stronger post the U.S. QE.
We acknowledge that our results are affected by the limitation of the Granger causality test methodology. The Granger causality test measures precedence and correlation and not “causality” in the variables. Zellner (Citation1988) criticizes Granger causality tests for potential omission of relevant variables (based on economic theory). In the absence of a strong theoretical background, the variables may be related because of some underlying economic processes that systematically affect both the variables being tested for causality. Our paper is a part of boarder literature that explores the growing role of institutional investors as major capital market players in the emerging economies (e.g., Lakshman et al., Citation2013). Hence, we do not expect our results to be driven by common-cause fallacy. Also, we only test for the linear causal relationships between capital flows and index returns in this paper.
5. Robustness tests
We run the sub-period analysis using the global financial crisis as our event. We find that for the all three sub-periods (pre, during and post the financial crisis), stock market returns cause the rise or fall in the flow of the FII activity (uni-directional causality). However, DIIs show a different trend. Before the financial crisis, DII Flows and returns exhibit a bidirectional causality indicating a strong influence of DIIs on the stock market returns. However, during and after the crisis it is the stock market returns that cause DII flows. Hence the data shows a fall in the influence of DIIs on the stock markets returns during and post the global financial crisis. Refer Appendix 3 for sub-periods used in analysis. Table presents results of causality tests.
Table 6. Test of Granger causality between returns and flows using global financial crisis event window
Our results are also robust to the choice of index used as a proxy for market returns in India. Results are qualitatively the same if we use an alternative index, the BSE Sensex index, of the Bombay Stock Exchange as a proxy for market returns. This indicates the robustness of both the major Stock Exchanges in India.
6. Concluding remarks
In this paper, we study the impact of the U.S. quantitative easing (QE) policy on the institutional investor flows in the Indian capital market. We contribute to the literature by comparing the investment flows of domestic versus foreign institutional investors in India from April 2007 to May 2017. Using causality tests, we find that the Indian capital markets are robust in attracting both domestic and foreign institutional investors through stock market returns. Domestic investors play a stabilizing role in the face of the volatility in foreign capital flows. Results also show that the impact of FIIs in India has increased during and after the U.S. QE regime. There is a shift in the power to influence market returns from the domestic institutional investors to the foreign institutional investors during the U.S. QE period.
We find evidence for the spillovers effect of an unconventional monetary policy of a developed country on an emerging market. Our results indicate the need to take into account the unintentional spillover effects through various transmission mechanisms while framing an unconventional monetary policy. The unconventional monetary policies of a developed country may affect the financial stability of emerging economies.
While the results of the test run on market indices reveal the increasing impact of the FII in India in recent years, we do not rule out the possibility that the study of individual stocks may reveal a different trend on the relationship between the institutional investors and stock market returns. Further research can look at how other economic factors influence the relation between institutional investors and stock market returns. Future research can also consider spillover effect through the different transmission channel on the Indian stock markets.
Acknowlegments
We would like to thank Rajesh Sinha, Igor Rivera (discussant) and the participants at the India Finance Conference (2017), Global Finance Conference (2019) and World Banking and Finance Symposium (2019) for their helpful comments and suggestions.
Additional information
Funding
Notes on contributors
Harshali Damle
Harshali Damle is a PhD student in Finance & Accounting area at the Indian Institute of Management Bangalore, India.
Sankarshan Basu
Sankarshan Basu is a Professor in Finance & Accounting at the Indian Institute of Management Bangalore, India. His research interest includes Financial Calculus, Option Pricing, Bond and Portfolio Valuation, Applications of Quantitative Techniques to Finance, Insurance, Reinsurance, Risk Management, Biostatistics and Corporate Finance. He has, to his credit, a number of papers in international journals of repute like Insurance: Mathematics and Economics and the Journal of Statistical Planning and Inference. He is currently President of the Asia-Pacific Risk and Insurance Association (APRIA).
Notes
1. “Initiating country” is the country which implements the monetary policy resulting in spillover effects to other countries called the “receiving countries”.
2. Several countries implemented unconventional monetary policies post the global financial crisis including the U.S., the U.K., Japan, European Union, Switzerland and Sweden.
3. Refer Table for overview of the exchange. Another large stock exchange in India is the Bombay Stock Exchange (BSE). There is a high correlation (0.97) between index returns of BSE and NSE.
4. BSE Sensex index (another index used a proxy for market returns in India) comprises of the 30 largest companies on the Bombay Stock Exchange of India.
References
- Ahmad, K. M., Ashraf, S., & Ahmed, S. (2005). Foreign institutional investment flows and equity returns in India. The ICFAI Journal of Applied Finance, 11, 16–17. https://www.iupindia.in/305/IJAF_Foreign_Institutional_Investment_16.html.
- Aït-Sahalia, Y., Andritzky, J., Jobst, A., Nowak, S., & Tamirisa, N. (2012). Market response to policy initiatives during the global financial crisis. Journal of International Economics, 87(1), 162–177. https://doi.org/10.1016/j.jinteco.2011.12.001
- Aizenman, J., Jinjarak, Y., & Park, D. (2013). Capital flows and economic growth in the era of financial integration and crisis, 1990–2010. Open Economies Review, 24(3), 371–396. https://doi.org/10.1007/s11079-012-9247-3
- Barroso, J., Barata, R. B., da Silva, L. A. P., & Sales, A. S. (2016). Quantitative easing and related capital flows into Brazil: Measuring its effects and transmission channels through a rigorous counterfactual evaluation. Journal of International Money and Finance, 67, 102–122. https://doi.org/10.1016/j.jimonfin.2015.06.013
- Batra, A. (2003). The dynamics of foreign portfolio inflows and equity returns in India (Working Paper No.109). Indian Council For Research On International Economic Relations.
- Bhattarai, S., Chatterjee, A., & Park, W. Y. (2018). Effects of US quantitative easing on emerging market economies. SSRN.
- Bouraoui, T. (2015). The effect of reducing quantitative easing on emerging markets. Applied Economics, 47(15), 1562–1573. https://doi.org/10.1080/00036846.2014.1000524
- Bowman, D., Londono, J. M., & Sapriza, H. (2015). U.S. Unconventional monetary policy and transmission to emerging market economies. Journal of International Money and Finance, 55, 27–59. https://doi.org/10.1016/j.jimonfin.2015.02.016
- Brooks, C. (2008). Introductory econometrics for finance. Cambridge University Press.
- CDSL. (2017). Fii/fpi auc country-wise (top 10 countries) data. https://www.cdslindia.com/publications/FII/AUC_CWTen.html
- Chandra, A. (2012). Cause and effect between FII trading behaviour and stock market returns: The Indian experience. Journal of Indian Business Research, 4(4), 286–300. https://doi.org/10.1108/17554191211274794
- Chen, Q., Filardo, A., He, D., & Zhu, F. (2016). Financial crisis, US Unconventional Monetary Policy and International spillovers. Journal of International Money and Finance, 67, 62–81. https://doi.org/10.1016/j.jimonfin.2015.06.011
- Dedola, L., Karadi, P., & Lombardo, G. (2013). Global implications of National unconventional policies. Journal of Monetary Economics, 60(1), 66–85. https://doi.org/10.1016/j.jmoneco.2012.12.001
- Fratzscher, M., Lo Duca, M., & Straub. (2016). ECB unconventional monetary policy: Market impact and international spillovers. IMF Economic Review, 64(1), 36–74. https://doi.org/10.1057/imfer.2016.5
- Gagnon, J., Raskin, M., Remache, J., & Sack, B. (2011). The financial market effects of the federal reserve’s large-scale asset purchases. International Journal of Central Banking, 7(1), 3-43.
- Georgiadis, G. (2016). Determinants of Global Spillovers from US Monetary Policy. Journal of International Money and Finance, 67(C), 41–61. https://doi.org/10.1016/j.jimonfin.2015.06.010
- Granger, C. W. J. (1969). Investigating causal relations by econometric models and cross-spectral methods. Econometrica, 37(3), 424–438. https://doi.org/10.2307/1912791
- Granger, C. W. J. (1980). Testing for causality. A personal viewpoint. Journal of Economic Dynamics & Control, 2, 329–352. https://doi.org/10.1016/0165-1889(80)90069-X
- Hajek, J., & Horvath, R. (2018). International spillovers of (Un)conventional monetary policy: The effect of the ECB and the US fed on non-euro EU countries. Economic Systems, 42(1), 91–105. https://doi.org/10.1016/j.ecosys.2017.10.001
- Ho, S. W., Zhang, J., & Zhou, H. (2018). Hot money and quantitative easing: The spillover effects of U.S. Monetary policy on the Chinese Economy. Journal of Money, Credit, and Banking, 50(7), 1543–1569. https://doi.org/10.1111/jmcb.12501
- Igan, D., Kutan, A., & Mirzae, A. (2016). Real effects of capital inflows in emerging markets. IMF Working Papers, 16(235), 1. https://doi.org/10.5089/9781475558555.001
- Khatiwada, S. (2017). Quantitative easing by the fed and international capital flows (IHEID Working Papers). Economics Section, The Graduate Institute of International Studies.
- Kim, S. (2001). International Transmission of U.S. Montary policy shock: Evidence from VAR’s. Journal of Moneatry Economics, 48(2), 339–372. https://doi.org/10.1016/S0304-3932(01)00080-0
- Lakshman, M. V., Basu, S., & Vaidyanathan, R. (2013). Market-wide herding and the impact of institutional investors in the Indian capital market. Journal of Emerging Market Finance, 12(2), 197–237. https://doi.org/10.1177/0972652713494046
- Mackowiak, B. (2007). External Shocks, U.S. Monetary policy and macroeconomic fluctuations in emerging markets. Journal of Monetary Economics, 54(8), 2512–2520. https://doi.org/10.1016/j.jmoneco.2007.06.021
- Neely, C. J. (2015). Unconventional monetary policy had large international effects. Journal of Banking and Finance, 52, 101–111. https://doi.org/10.1016/j.jbankfin.2014.11.019
- Patnaik, I., & Shah, A. (2012). Did the Indian capital controls work as a tool for macroeconomic policy. IMF Economic Review, 60(3), 439–464. https://doi.org/10.1057/imfer.2012.16
- Peiro, A. (1999). Skewness in financial returns. Journal of Banking & Finance, 23(6), 847–862. https://doi.org/10.1016/S0378-4266(98)00119-8
- Rajan, R. G. (2015). Competitive monetary easing: Is it yesterday once more? Macroeconomics and Finance in Emerging Market Economies, 8(1–2), 5–16. https://doi.org/10.1080/17520843.2014.992451
- SEBI. (2004). Securities and exchange board of India bulletin. https://www.sebi.gov.in/reports/sebi-bulletin/dec-2004/december-2004-bulletin-pdf_13517.html
- SEBI, BSE, NSE, Moneycontrol, NSDL and CDSL official website
- Vardhan, H., & Sinha, P. (2016). Influence of Foreign institutional investments (FIIs) on the Indian stock market: An Insight by VAR models. Journal of Emerging Market Finance, 15(1), 49–83. https://doi.org/10.1177/0972652715623677
- Zellner, A. (1988). Causality and causal laws in economics. Journal of Econometrics, 39(1–2), 7–22. https://doi.org/10.1016/0304-4076(88)90038-3
Appendix 1.
Variable definitions and data sources
Appendix 2.
Key timeline for the U.S quantitative easing policy
For our analysis we have used the following sub-periods:
Appendix 3.
Key timeline for the global financial crisis
For our analysis have used the following windows: