
 ?Mathematical formulae have been encoded as MathML and are displayed in this HTML version using MathJax in order to improve their display. Uncheck the box to turn MathJax off. This feature requires Javascript. Click on a formula to zoom.
Abstract
The study investigated that whether the relationship between macroeconomic fluctuations and stock indexes is symmetrical or asymmetrical in nature. This study employed nonlinear autoregressive distributed lag models for the times before and after 2008 economic crises. The overall sample period contains 168 observations between January 2004 and December 2018. The period between January 2004 and December 2007 was considered as pre-economic crisis period containing 48 observations whereas, period between January 2008 and December 2018 was considered as post-economic crisis containing 120 observations. Four different types of unit root tests, i.e., augmented Dickey Fuller test, Philips Perron test, Zivot-Andrew unit root, and Kwiatkowski Philips Schmidt Shin test have been employed to find out the stationarity in data. Findings suggested that in the long run and before global financial crisis, investors react differently to gold prices and oil prices. In long run and after crisis, investors have shown different reactions to all macroeconomic fluctuations. This showed that after crisis, investors reacted differently to positive and negative shocks of gold prices, exchange rate, and interest rate. Another interesting aspect that after global financial crisis, investors reacted only to positive shocks of gold prices, interest rates, and exchange rate in long run. This research contributes to existing literature by identifying that relationship between macroeconomic fluctuation and stock prices is asymmetric in nature whereas, in previous researches authors have assumed linearity in the time series data. The asymmetric effect of macroeconomic variables on stock prices should be considered for investors, governments, and other stakeholders during investment decisions.
PUBLIC INTEREST STATEMENT
During 2008, Pakistan was not directly affected by the global financial crisis, however, suffered from severe macroeconomic imbalances. GDP growth rate has been depreciated from 6.8% to 4.1%, with the current account deficit in Pakistan. The global financial crisis has depleted Pakistan’s currency reserves and hindered the growth of overall economy. FDI has been depreciated from $5400 million in 2007 to only $3710 million in 2009. Due to decline in FDI, GDP, unemployment, and exports, Pakistan reached IMF for bailout package. Fiscal deficit rose to 7.1% with current account deficits raised above 8.1% of total GDP. Pakistan had $16 billion in foreign-currency reserves before the global financial crisis, however, foreign exchange reserves depleted to only $5 billion but after the crisis. The consumer price index was elevated which resulted in unemployment and higher interest rates. This research is unique because it investigated asymmetric effect of macroeconomic variability on stock prices for three specified time frames, e.g., precrisis, postcrisis, and over the entire period.
1. Introduction
Building upon the arbitrage pricing theory, macroeconomic fluctuations have their effect on stock prices. Objectives of this research article are to explain short-run and long-run asymmetrical effects of macroeconomic variability on stock prices for three specified time frames such as pre-crisis, post-crisis, and when whole sample period is selected. In order to study the relation between exchange rate, oil prices, and the stock prices of US oil companies, Mollick and Nguyen (Citation2015) used arbitrage pricing model as underpinning theory and found that stock returns of US oil companies are positively affected by increase in oil prices. This research contributes to existing literature by investigating asymmetrical effect of gold prices, oil prices, and exchange rate on stock indexes, which is assumed to be symmetrical in existing literature.
Figure 1. Effect of global financial crisis on KSE-100 index.
This research article investigates the asymmetrical effect of macroeconomic fluctuation on Pakistan’s stock market because of its highly volatile property (Almansour et al., Citation2016; Asad & Farooq, Citation2009; Shaker et al., Citation2018). Figure explains that KSE-100 index drops from 15,500 index points to only 5,400 index points during 2008, vertical axis portrays KSE-100 indexes from 2004 to 2018 and horizontal axis shows the time series frequencies from January 2004 to June 2018. Moreover, Government of Pakistan has also made certain macroeconomic adjustment during global financial crisis 2008 (Alkhuzaie & Asad, Citation2018). This furthermore motivates the researcher to explore asymmetric relationship between macroeconomic variables and stock price before crisis (2004–2008), after crisis (2008–2018), and over the entire sample period (2004–2018).
In existing literature, Simbolon and Purwanto (Citation2018) investigated positive symmetrical effect of interest rate, exchange rate, and inflation on Indonesian stock prices. In comparison to the Simbolon and Purwanto (Citation2018) analysis, by using generalized autoregressive conditional heteroscedasticity (GARCH) model, Camilleri et al. (Citation2019) have found a negative correlation between interest and exchange rates and Chinese stock price, but inflation remained insignificant. There is no consistent evidence of macroeconomic fluctuation on stock prices, as studies suggested that macroeconomic fluctuations and market indices are linked positively (Adjasi et al., Citation2011; Ajaz et al., Citation2017; Singhania & Prakash, Citation2014; Tuna, Citation2018), however, some others have shown significantly negative link between macroeconomic variables and stock indexes (Agyire‐Tettey & Kyereboah‐Coleman, Citation2008; Andriansyah & Messinis, Citation2019; Apergis & Miller, Citation2005; Ghosh et al., Citation2004).
Moreover, macroeconomic movements and stock price volatility are examined only by using linear models (Black et al., Citation2015; Chen et al., Citation2012; Gregoriou et al., Citation2015; Inoguchi, Citation2014; Khan et al., Citation2017; Saumya, Citation2012; Shakil et al., Citation2018; Tiwari et al., Citation2015; Zaheer, Citation2019; Khalil et al., Citation2018) and no effort was made to find out nonlinear impact of these macroeconomic variations on stock indexes. However, Bahmani-Oskooee and Saha (Citation2015) purposed to study the asymmetrical impact of macroeconomic variations on stock indexes.
A few researchers have contributed to literature with respect to the impact of macroeconomic fluctuation on stock prices but their studies were carried out in different context, e.g., Malaysia (Ibrahim, Citation2012), China (Wang & Fan, Citation2014), Singapore (Pandey & Vipul, Citation2018) and did not undertake the importance of global financial crisis while studying investors reaction to macroeconomic fluctuations. Therefore, the current research intends to find out the asymmetrical effect of macroeconomic fluctuation on Pakistani stock exchange in pre-crisis, post-crisis, and for the entire period. Most studies were carried out in Pakistan regarding effect of macroeconomic variables on stock prices, e.g. (Kumar & Dhankar, Citation2017; Nguyen & Ngo, Citation2014; Singhania & Prakash, Citation2014; Syed & Shaikh, Citation2013; Asad, Citation2011) did not undertake importance of global financial crisis and are symmetrical in nature.
Firstly, this research contributes to existing literature by examining that either relationship between macroeconomic fluctuation and stock prices is symmetrical in nature or asymmetrical. The nonlinear autoregressive distributive lag (NARDL) model has the potential to decompose independent variables into positive and negative shocks. One of the limitations of the previous studies was the assumption that relationship between macroeconomic fluctuation and stock prices is linear in nature. Furthermore, majority of the authors have utilized linear models like VAR, VECM, and ARDL model to explore the symmetrical effect of macroeconomic fluctuation on stock prices (Adjasi, Citation2009; Adjasi et al., Citation2011; Mongi, Citation2017; Pradhan et al., Citation2015; Tiwari et al., Citation2015; Wickremasinghe, Citation2011) and failed to explain asymmetric effect of macroeconomic variability on stock indexes. One of major limitation in previous studies is that these authors have utilized standard cointegration techniques like ARDL by assuming linear relationship between macroeconomic fluctuation and stock prices. Rajesh (Citation2019) argued that most studies have assumed linearity by using time series data, however, in fact they are nonlinear. The term “hidden cointegration” is suggested by Granger and Yoon (Citation2002) to describe long-term equilibrium relationship between positive and negative shocks of underlying variables. In this study, Brock-Dechert-Scheinkman (BDS) test of nonlinearity has been applied in order to detect serial dependence and independence in time series data. Calculated test statistics for BDS test of nonlinearity is greater than critical value, thus, null hypothesis can be rejected that time series is independent and identically distributed. Rejection of null hypothesis of BDS test for nonlinearity justified the utilization of NARDL model in order to find out asymmetrical effect of macroeconomic fluctuation on stock prices (Galadima & Aminu, Citation2020; Kim et al., Citation2003; Muhammad, Citation2017a).
Secondly, existing literature hardly considered that how the global financial crisis influences the asymmetric effect of the independent variables on stock prices (Ajaz et al., Citation2017; Shakil et al., Citation2018). Ghulam (Citation2018) found that all asset classes are severely affected by global financial crisis. Husain et al. (Citation2019) also found that asymmetric behavior of independent variables is also effected by global financial crisis. Therefore, this research article also contributes to existing literature by finding out asymmetrical relationship between macroeconomic fluctuation and stock prices for three specified durations.
Findings suggested that in long run before global financial crisis, investors react differently to gold prices and oil prices. In long run after crisis, investors show different reaction to all macroeconomic fluctuations. This shows the reaction of investors to positive and negative shocks of macroeconomic variables changes in case of tail event like global financial crisis. This is an important theoretical contribution to existing literature as it explains the asymmetrical effect of macroeconomic fluctuation on stock prices which is being studied as symmetrical by majority of the researchers.
After global financial crisis and in long run, investors only react to positive shocks of gold prices, oil prices, and exchange rate and did not react to negative shocks of underlying variables. This means that after global financial crisis only positive shocks associated with macroeconomic fluctuation have become important for investors and they did not put much importance on negative shocks.
This paper is arranged in following four sections. First section covers introduction (in which authors explain about theoretical linkage between macroeocnomic variability and stock prices, which need to be studied. Section 2 reviewed the existing literature and information about effect of macroeocnomic variability on stock indexes. Author has taken into account gold prices, oil prices, and exchange rate in order to explain their asymmetrical effect on stock indexes. Section 3 explains data sets, variables employed in the model, and research methodology which has been followed. Sections 4 and 5 represent results and conclusion, respectively.
2. Literature review
2.1. Macroeconomic fluctuation and stock prices nexus
Higher macroeconomic instability not only raises stock price volatility but also plays an important role in reducing it. Adjasi (Citation2009) incorporated macroeconomic variables like consumer price index as proxy for inflation, money supply, interest rates, gold prices, cocoa prices, and oil prices in order to determine their effect on stock price volatility through the utilization of exponential generalized autoregressive conditional modelling. Higher volatility in cocoa and interest rate increase volatility of stock prices and higher volatility in gold prices, oil prices, and money supply reduces the volatility of stock prices (Adjasi, Citation2009). Canonical correlation analyses have also be used by Mazuruse (Citation2014) in order to find out the effect of macroeconomic variations in exchange rate, interest rate, treasury bills, unemployment rate, industrial index, and money supply on Zimbabwe stock exchange.
Khanh Ngoc and Hussainey (Citation2009) examined the effect of US macroeconomic volatility on Vietnamese stock prices and found Vietnamese stocks to be mainly influenced by the US economy. Moreover, in order to analyze the effect of macroeconomic fluctuation and stock prices, Tsoukalas (Citation2003) used VECM and Granger causality to determine causality between Cyprus macroeconomic variables and Cyprus stock prices. Inoguchi (Citation2014) employed multinomial logistic regression and found that fluctuation in foreign stock market has significantly affected East Asian banking sector. Japanese and American macroeconomic variability has not only influenced banking industry’s stock prices in Singapore, Malaysia, Thailand and Korea before Asian financial crisis as well as after the recent Global financial crisis of 2008–2009 (Inoguchi, Citation2014).
Higher interest rates have shown to act as an impediment to business activities, because potential opportunities in any given country will limit investments in business resulting increased investment in bank deposits (Asad & Qadeer, Citation2014; Bashir & Asad, Citation2018; Shaker et al., Citation2018). Umar and Sun (Citation2015) analyzed the relationship of country risk, stock prices, and Chinese currency (renminbi) with US dollar and established cointegration of renminbi and Chinese stock index. US dollars are deemed foreign currency for many developing and advanced countries and its strengthening may increase inflation and adversely affect stock prices, but the renminbi exchange rate is a main determinant of Chinese stock prices. Fluctuations in Chinese renminbi as compared to US dollars’ act as country risk for Chinese economy due to significant influence over Chinese stock index.
Existing literature consider only the symmetric effect of macroeconomic variation on stock prices without underlying the consideration of global financial crisis.
2.2. Exchange rate (USD/PKR) and KSE-100 index
Exchange rate risk has affected the stock returns of all four selected European countries, however, interest rates have only affected stock returns of Germany and France (Hyde, Citation2007). Hyde (Citation2007) analyzed the effect of market exchange-rate fluctuations and interest-rate sensitivity on stock returns by taking into account four European regions such as France, Germany, Italy, and UK. Andriansyah and Messinis (Citation2019) estimated a Toda Yamamoto causality test between exchange rates and stock prices of heterogeneous panel of eight countries and found that exchange rates Granger causes the stock prices fluctuations in all seven countries, however, in Indonesian market stock prices are Granger causing exchange rate fluctuation through portfolio equity flows. Ajaz et al. (Citation2017) found that changes in interest rates and exchange rates are causing asymmetric effect on Indian stock indexes because of tight monetary arrangements. Ajaz et al. (Citation2017) utilized vector autoregressive in order to find out the volatility spillover between Indian, South Africa, Brazil stock prices and exchange rates, furthermore, they also have utilized GARCH with time varying covariance as a benchmark against spillover methodology as set by Diebold and Yilmaz, for the purpose of finding out the volatility spillovers between Indian, South African, Brazil stock prices and exchange rates. Kumar (Citation2013) found volatility spillover between exchange rates and stock prices of IBSA countries (India, Brazil, and South Africa).
Tang and Yao (Citation2018) have reported indirect relationship between stock prices and exchange rates whereas, Simbolon and Purwanto (Citation2018) purposed significant direct relationship between exchange rate and stock prices; however, limited literature has enlightened the issues of asymmetrical effect of exchange rate on stock prices for developing country like Pakistan, especially before and after the adverse events. In existing literature, most articles have used only symmetrical models for exploration of exchange rate and stock index nexus (Adjasi, Citation2009; Adjasi et al., Citation2011; Ajaz et al., Citation2017; Arfaoui & Ben Rejeb, Citation2017; Chiang Leong & Hui, Citation2014; Ghauri, Citation2014; Günsel et al., Citation2009; Hyde, Citation2007; Kumar, Citation2013; Nezu & Kurihara, Citation2006; Shrestha & Liu, Citation2008; Simbolon & Purwanto, Citation2018; Tang & Yao, Citation2018; Umar & Sun, Citation2015; Vezos & Lael Joseph, Citation2006) and only Salvatore (Citation2019) used NARDL model for asymmetrical impact of exchange rate on stock prices. However, they did not undertake importance of global financial crisis in their model and incorporated only interest rates and exchange rates as their independent variables in Mexican context.
Asymmetrical models like NARDL is having the capacity to decompose independent variables into positive and negative shocks to analyze either investors react differently to both positive and negative shocks before crisis, after crisis, and for entire period. Bahmani-Oskooee and Saha (Citation2015) purposed to study the asymmetrical effect of macroeconomic variations on stock prices. Moreover, as per Khan et al., (Citation2017) study which has established a significant long-term stock index-exchange rate nexus, but is limited to developed countries and also ignored asymmetrical effect of exchange rate fluctuation on stock prices. Therefore, the first hypothesis is proposed as:
H1: Relationship between exchange rate and stock indexes is asymmetric in nature.
2.3. Gold prices, oil prices, and stock market fluctuation
There exists a negative relationship between oil prices and stock prices, however, oil prices are positively affected by US dollar index in global context. Arfaoui and Ben Rejeb (Citation2017) used simultaneous equation modeling in order to explain the interdependencies between oil, gold, and stock prices in global context. Fan et al. (Citation2014) explored the impact of macroeconomic indices on gold prices during financial crisis and found that commodity price index, US dollar index, and US treasure CDS spread have positive correlation with gold prices during financial crisis, however, gold-stock prices relationship has been ignored. A hedge is considered as a property which provides protection against decreasing value of another asset in time of turmoil. Gold is having hedging properties against increasing inflation, decreasing stock prices, and depreciating currency against dollars in Saudi Arabia. In Saudi Arabia, gold protects investment against rising inflation, lower stock values, and currency deflation as Shakil et al. (Citation2018) used an ARDL to investigate the hedging properties of gold against macroeconomic determinants such as Saudi Arabian stock prices and found that gold is having hedging properties against Saudi Arabia’s stock prices. Adjasi (Citation2009) indicated that only higher volatility in cocoa and interest rate increase volatility of stock prices and higher volatility in gold prices, oil prices, and money supply reduces the volatility of stock prices.
In existing literature, Ghosh et al. Citation2004 have found insignificant effect of gold prices on stock prices, whereas, Tuna (Citation2018) has found long-term cointegration between gold and stock prices. Most of studies on integration between gold, oil, and stock prices have been carried out in different context like Malaysia (Ibrahim, Citation2012), China (Fan et al., Citation2014), and Singapore (Pandey & Vipul, Citation2018), and most of authors have used only symmetrical models while explaining the effect of macroeconomic variability on stock prices (Adjasi, Citation2009; Fan et al., Citation2014; Husain et al., Citation2019; Ibrahim, Citation2012; Lili & Chengmei, Citation2013; Rangan, Citation2013; Reid & Gupta, Citation2013; Shakil et al., Citation2018; Tuna, Citation2018). However, to best of our knowledge, no effort was made, in the course of the global financial crisis, to detect the asymmetrical effect of gold and oil prices on the Pakistan stock exchange. Therefore, the second and third hypotheses are proposed as:
H2: Relationship between gold prices is asymmetric in nature.
H3: Relationship between oil prices and stock indexes is asymmetric in nature.
3. Data, methodology, and model specification
In existing literature, researchers have examined symmetrical effect of macroeconomic variability on stock indexes, which means that increase in dollar prices has a negative impact on stock prices and dollar depreciation has opposite effect. According to Bahmani-Oskooee and Saha (Citation2015) this may not be the case, there is possibility that investors react differently to both increase or decrease in dollar prices. For example, US dollar depreciation causes produce prices to move in downward direction and increases the profit margin and stock indexes for many firms. In case of dollar appreciation, firms can absorb the increasing cost of producer prices in order to maintain market share by giving up their profit margin (Bahmani-Oskooee & Saha, Citation2015). Thus, stock prices react differently to both positive and negative shocks. In case of negative shocks to exchange rate (US dollars), there is positive effect and incase of positive shock to exchange rate, stock prices did not react to appreciation in exchange rate. This relationship is given the name of asymmetrical effect of exchange rate on stock prices. This research follows Bahmani-Oskooee and Saha (Citation2015) in order to find out asymmetrical effect of macroeconomic fluctuation on stock indexes because in existing literature, many research articles examine symmetrical relationship and limited effort is made to find out asymmetrical effect of macroeconomic variability on stock prices.
3.1. Data
Monthly level data sets for macroeconomic variables such as US dollars’ index (USD/PKR), gold prices, and oil prices are taken from World Bank macroeconomic indicators, Trading economics.com and Investing.com. Pakistan stock exchange website is having monthly level data sets of KSE-100 index with its high values, low values, and capitalization as well. Study period is divided into three portions, i.e., precrisis period, postcrisis period, and entire period in order to find out the asymmetric effect of macroeconomic variation on stock prices in different scenarios. Precrisis period includes the observation from January 2004 to January 2008, postcrisis period starts from January 2010 to January 2018, and entire period is time series data based upon 168 months from January 2004 to January 2018.
3.2. Methodology
ARDL model as specified by Shin et al. (Citation2014) can be implemented when all variables are incorporated at a certain order, for instance, when all of the variables are stationary at level I(0), or all are stationary at first difference I(1), or when none of the variables is stationary at second differencing or I(2). ARDL model can also be implemented when some of variables are I(0) and some are I(1). Optimal lag length is usually selected with help of minimum values of AIC, BIC, and SC. Asymmetric effects between macroeconomic fluctuation and stock prices can be examined through nonlinear ARDL followed by residual diagnostics such as Breusch Pegan test for hetrosekadascity, LM test for autocorrelation, Ramsey reset test for model specification, normality test, variance inflation factor test for multicolinearity, and CUSUM, CUSUM-residual squared test for stability of coefficients. In equation 1, Yt indicates the dependent variables and Xt includes all set of regressors (k*1 set of vectors), is called intercept, and
is used for differencing of variables. b1 and c1 are used for short-run coefficient and
and
are used for long-run coefficient. p and q are used for lag orders of dependent and independent variables. In nonlinear autoregressive distributive lag, null hypothesis for testing cointegration is
and alternative hypothesis is
. According to Shin et al. (Citation2014) if the value of F-statistics is lower than the upper bound and lower bound values, we cannot be able to reject the null hypothesis that there is no long-term cointegration.
3.3. Model specification
3.3.1. General form of unrestricted error correction model for nonlinear ARDL
3.3.2. Model for nonlinear ARDL for asymmetric effect of macroeconomic fluctuation on stock prices is as follow
All independent variables are broken down into positive and negative signs in nonlinear ARDL to assess the asymmetric effect of macroeconomic variation on stock prices. This research follows the interpretation of Bahmani-Oskooee and Saha (Citation2015) in order to explain that how investors react differently to positive and negative shocks. EquationEquation 2(2)
(2) explains that exchange rate, gold prices, and oil prices are decomposed into positive and negative shocks in order to find out asymmetrical effect of macroeconomic variability on stock indexes in precrisis period, postcrisis period, and when whole sample is selected.
4. Empirical analysis
This research explores the asymmetrical interaction of exchange rate, gold prices, oil prices, and stock prices through the use of the NARDL model by Shin et al. (Citation2014). NARDL models are used to explain the asymmetric macroeconomic fluctuation on stock prices for three specified periods in Pakistan.
The functional focus of NARDL model is to assess the nonlinear impact of macroeconomic variability on stock prices, although the asymmetrical effect of macroeconomic fluctuations on stock prices by decomposing independent variables into positive and negative shocks cannot be demonstrated by ARDL. Nonlinear ARDL model is having the propensity to decompose independent variables into positive and negative shocks in order to understand how investors react differently to both positive and negative shocks (Olaleke, Citation2019a; Salvatore, Citation2019). Empirical analysis is based on following, sections such as BDS test of nonlinearity for detecting serial dependency in time series, unit root detection in time series, and NARDL model for decomposing macroeconomic variables into negative and positive signs. Researchers perform augmented Dickey Fuller test, Philips Perron test, and Kwiatkowski Philips Schmidt Shin (KPSS) test to determine the seasonality effect in data. The null hypothesis for the ADF and PP test is that the data have a root, but is inverted in the case of the KPSS. According to Shin et al. (Citation2014) if the value of F-statistics is lower than the upper bound and lower bound values, null hypothesis cannot be rejected, i.e., there is no long-term cointegration. ECM is also carried out in order to confirm long-run cointegration between macroeconomic fluctuation and stock prices. ECM value should be negative and significant which means that system is getting back toward long-run equilibrium at specific speed (Ajaz et al., Citation2017; Mathur Citation2018; Olaleke, Citation2019).
4.1. Brock-Dechert-Scheinkman (BDS) independence test
A BDS nonlinearity test is employed to identify serial dependence in time series data. This test was developed by Brooks (Citation1996) and has been employed in various research articles such as (Brooks, Citation1996; Galadima & Aminu, Citation2020; Kim et al., Citation2003) in order to find out that either residuals are identically distributed(iid) or are independent. Following are alternative and null hypothesis for test:
Null hypothesis: Time series is independent and identically distributed or time series are linearly dependent.
Alternative hypothesis: Time series is not identically distributed or time series are not linearly dependent.
If calculated BDS test statistics are greater than critical values then time series is not independent and identically distributed, which shows that undertaken time series is nonlinear dependent for Pakistan. Application of nonlinear autoregressive distributive model is justified if null hypothesis of BDS test is rejected, otherwise linear models are appropriate because of identical distribution of time series (Brooks, Citation1996; Kim et al., Citation2003).
BDS test can be written in following manner:
is defined as standard deviation of
.
Table shows that null hypothesis for BDS test has been rejected and nonlinear autoregressive distributive lag model is more suitable for the analysis. Table supports that actual relationship between macroeconomic fluctuation and stock prices is nonlinear rather than linear. Tables – explains about descriptive statistics of macroeconomic variables during three specified time frames such as preeconomic crisis 2008, posteconomic crisis 2008, and when whole sample period is selected (January 2004–December 2018). From examination of Table 1, that in comparison to all other independent variables gold prices are having the highest volatility throughout the period and US dollars to Pakistani rupee is lowest volatile variable. Tables and present descriptive statistics of macroeconomic variables and stock indexes before global financial crisis and after global financial crisis, respectively. Gold prices are having the highest volatility among all other macroeconomic independent variables and its volatility increases after crisis. Stock indexes as representation of KSE-100 index became more volatile after crisis which shows that they tend to fluctuate more often from their mean values after crisis. Volatility of all independent variables such as gold prices, exchange rate, and oil prices tend to increase after the crisis. There is also a broad gap between the maximum and minimum values of the independent variables before and after crisis. The mean values of all independent variables in precrisis period are comparatively lower than postcrisis period. This further motivates the researchers to investigate that either investors react differently to macroeconomic positive and negative shocks for three identified periods, i.e., before crisis, after crisis, and when whole sample is selected.
Table 1. BDS test for nonlinearity
Table 2. Descriptive statistics for whole sample period
Table 3. Descriptive statistics for pre-crisis sample period
Table 4. Descriptive statistics for Post-crisis period
Tables – show the results of unit root analysis. ADF and PP unit root results show that all variables (exchange rate, gold prices, oil prices, and stock indexes) are integrated at same order as all of the variables are nonstationary at level I(0) and become stationary at first difference. Null hypothesis in case of ADF and PP is that data have unit root which is reversed in case of KPSS. Results from KPSS unit root test indicate that all variables except oil prices are nonstationary at level and became stationary at first differencing. If value of KPSS is greater than critical value at 1% and 5% then alternative hypothesis is accepted that data have unit root (data are not stationary in nature). Results indicate that null hypothesis is rejected for all variables except oil prices which is stationary at level. According to KPSS unit root test, some of variables are I(0) and some are I(1) and none of them is I(2), thus NARDL model can be suitable for application. According to ADF, PP all variables are integrated at same order, which again confirms suitability of NARDL for analysis. Table reports the results of Zivot Andrew unit root test. If Zivot Andrew test statistics is lower than critical values, then null hypothesis cannot be rejected (Tehreem, Citation2018). Null hypothesis of Zivot Andrew unit root test is that data are having a unit root (variables are nonstationary). Table shows that all variables are integrated at same order and also reports structural break dates.Footnote1 Significant dummy variable is also included in our NARDL pre and postcrisis models.
Table 5. ADF unit root test
Table 6. PP unit root test
Table 7. KPSS unit root test
Table 8. Zivot Andrew unit root test
Table represents results of NARDL model before global financial crisis and reports nonlinear effect of exchange rate, gold prices, and oil prices on stock prices. Each independent variable is decomposed into positive and negative shocks in order to find out the positive and negative effects of every independent variable on stock prices. In long run and before global financial crisis, results indicate that investors react differently to positive and negative shocks of gold prices and oil prices. However, relationship between exchange rate and stock prices is symmetrical in nature in long run and before global financial crisis, which means that 1% appreciation in US dollars causes depreciation in stock Prices when a positive shock is given and appreciation to stock prices in case of negative shocks to exchange rate.
Table 9. NARDL before crisis
In short run and before global financial crisis, investors react differently to exchange rate, gold prices, and oil prices. Asymmetrical relationship is established between exchange rate, gold prices, and oil prices in short run before global financial crisis. These results are in contrast with several researches (Abbas et al., Citation2017; Bhargava, Citation2014; Black et al., Citation2015; Camilleri et al., Citation2019; Chiang Leong & Hui, Citation2014; Ghauri, Citation2014; Merikas & Merika, Citation2006; Umar & Sun, Citation2015) because they have only explained symmetrical effect of macroeconomic fluctuation and stock prices and did not undertake importance of global financial crisis as tail even.
ECM value is −1.07 which shows that system is correcting itself at speed of 107% toward long-run equilibrium. Ramsey test indicates that there exist no misspecification errors in case of NARDL model before global financial crisis. F-statistics value is greater than upper bound and lower bound test statistics which shows a long-run co-integration between macroeconomic fluctuation and stock prices.
Table reports the results for nonlinear autoregressive regarding the asymmetrical effect of macroeconomic fluctuation on stock prices, F-statistics value is greater than upper bound and lower bound critical values which confirm long-term integration between decomposed macroeconomic variables and stock prices. ECM term of −0.49 confirms this long-term relation as system gets back to long-term equilibrium at speed of 49% per month. In long run and after global financial crisis, asymmetrical relationship is established between all macroeconomic variation and stock prices. Investors react differently to all macroeconomic variables such as gold prices, oil prices, and exchange rate in long run after financial crisis. For example, when a positive shock occurs in exchange rate, oil prices, and gold prices there exist a direct and significant relationship with stock index, however, no significant relationship has been established in case of negative shock. According to Bahmani-Oskooee and Saha (Citation2015), such types of relationship is called asymmetrical effect.
Table 10. NARDL results after crisis
In short run after global financial crisis, asymmetrical relationship is established only between gold prices, exchange rate, and stock indexes. This means that in short run after global financial crisis investors react differently to positive and negative shocks of only gold prices and exchange rates. In long run, investors react differently to all macroeconomic variations. These results are in contradiction with (Adjasi, Citation2009; Arfaoui & Ben Rejeb, Citation2017; Fan et al., Citation2014; Ghosh et al., Citation2004; Ibrahim, Citation2012; Lili & Chengmei, Citation2013; Mongi, Citation2017; Pandey & Vipul, Citation2018; Rangan, Citation2013; Reid & Gupta, Citation2013; Shakil et al., Citation2018; Tuna, Citation2018) because they have only explained symmetrical effect of gold prices and stock prices and did not undertake importance of global financial crisis as tail even. Ramsey test-retest explains that nonlinear autoregressive distributed lag model is correctly specified. ECM of −0.49 means that system is correcting itself toward long-run equilibrium at speed of 49% per month.
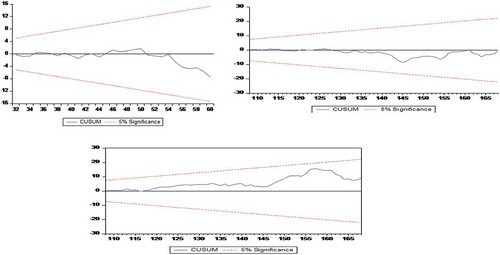
Table reports nonlinear autoregressive distributed lag model results when whole sample period is selected. According to Table , positive and negative shocks to oil prices have an asymmetrical effect on stock prices in long run because investors react differently to both positive and negative shocks to oil prices. Only negative shocks to oil prices cause depreciation in stock prices and investors didn't react to positive shocks. In short run when entire study period is selected, there exists an asymmetrical relationship between gold prices, oil prices, 2 months’ prior prices of exchange rate, and stock prices. F-statistics shows a long-term cointegration between asymmetric macroeconomic variables and stock indexes, ECM of −0.331 confirms that model is getting back to its position of long-run equilibrium at seed of 33%. Figures 3–9 confirms that all symmetrical and asymmetrical models are stable because CUSUM test shows stability in all symmetrical and asymmetrical models.
Table 11. NARDL when whole sample is selected
4.2. Some stylized facts and comparison between before crisis and after crisis asymmetric results
It is important to study three scenarios rather than only taking whole period into consideration.
4.2.1. In long run
In long run before global financial crisis, investors react differently to gold prices and oil prices. In long run after crisis, investors show different reaction to all macroeconomic fluctuations. This shows the reaction of investors to positive and negative shocks of macroeconomic variables generally changes in case of tail event like global financial crisis. This is an important theoretical contribution to existing literature as it explains the asymmetrical effect of macroeconomic fluctuation on stock prices, which is being studied as symmetrical by majority of the researchers (Abbas et al., Citation2017; Bhargava, Citation2014; Black et al., Citation2015; Camilleri et al., Citation2019). This research article clasifies that investors react differently to positive and negative shocks of gold prices and oil prices in pre-criis, and react differently to all macroeconomic fluctuation in long run after crisis. This shows the importance of studying tail events like global financial crisis. Investors, brokerage houses, and governmental regulatory agencies should take into account the different scenarios like global financial crisis before doing any kind of analysis.
After global financial crisis and in long run, investors only react to positive shocks of gold prices, oil prices, and exchange rate and did not react to negative shocks of underlying variables. This means that after global financial crisis only positive shocks associated with macroeconomic fluctuation have become important for investors and they did not put much importance on negative shocks.
4.2.2. In short run
In short run before global financial crisis, investors react differently to exchange rate, gold prices, and oil prices. But in short run after crisis, investors only react differently to gold prices and exchange rate. This shows the importance of scenario-based study, because after crisis, asymmetrical relationship is different between macroeconomic fluctuation and stock prices. These results are in contradiction with several authors (Abdullah, Citation2018; Chandra, Citation2012; Jehan & Rashid, Citation2014; Rexford, Citation2019; Shakil et al., Citation2018; Simbolon & Purwanto, Citation2018; Tsoukalas, Citation2003; Wickremasinghe, Citation2011; Yu & Leistikow, Citation2011) because they have only used symmetrical model like VAR, VECM, ARDL, or GARCH and did not inculcate scenario similar to global financial crisis in their study.
In the short run before global financial crisis, investors react to positive shocks of exchange rate and gold prices and negative shocks of exchange rate, gold prices, and oil prices. In short run after Global economic crisis, investors react to positive shocks of 2 months’ prior prices of exchange rate, and 1 month prior prices of gold. This means that in short run after crisis, investors only react to negative shocks of gold prices. Another possibility is that investors show least importance to negative shocks associated with oil prices and exchange rate in short run after crisis. In short run before global financial crisis, oil prices are having asymmetrical effect on stock prices but after crisis this asymmetrical relationship is changed into symmetrical because investors react equally to positive and negative shocks to oil prices. These results are in contrast with several prior studies (Abdullah, Citation2018; Andriansyah & Messinis, Citation2019; Camilleri et al., Citation2019; Ghauri, Citation2014; Jehan & Rashid, Citation2014; Mouna, Citation2019; Nezu & Kurihara, Citation2006; Rexford, Citation2019) because these studies are only based upon symmetrical models without undertaking any kind of scenarios.
4.3. Robustness checks
Figure confirms that all asymmetrical models are stable because CUSUM test shows stability in all asymmetrical models. Tables ,, confirm that asymmetrical models are free from autocorrelation and heteroscedasticity. Ramsey test indicates that models are correctly specified as obtained value is lower than critical value which means functional form of models is correctly specified.
Figure 4. CUSUM test results for NARDL before crisis, after crisis, and whole sample.
5. Conclusions and practical implications
In the existing literature, some of researches reported significant relationship between macroeconomic fluctuation and stock prices while others have reported insignificant relationships. There is lack of consensus in results regarding the relationship between macroeconomic variability and stock indexes. Moreover, most of researchers utilized only symmetrical models for investigating the effect of macroeconomic variability on stock prices and did not inculcate the importance of global financial crisis.
This research contributes to existing literature in following ways. (1) This research contributes to existing literature by investigating asymmetrical relationship between macroeconomic variability and stock prices which is assumed to be symmetrical. (2) This research examined asymmetrical effect of macroeconomic variability on stock prices in three specified time frames, e.g., precrisis, postcrisis, and entire period and found that investors react differently to macroeconomic variations before and after crisis. This shows that asymmetrical relationship between macroeconomic variability and stock index changes in case of tail event like global financial crisis.
In long run and before global financial crisis, investors react differently to gold prices and oil prices. In the long run after crisis, investors show different reaction to all macroeconomic fluctuations. This shows that reaction of investors to macroeconomic positive and negative shocks changes in case of tail event like global financial crisis. This is an important theoretical contribution to existing literature that there is asymmetrical effect of macroeconomic fluctuation on stock prices which is being studied as symmetrical.
In the short run before global financial crisis, investors react to positive shocks of exchange rate and gold prices and negative shocks of exchange rate, gold prices, and oil prices. In short run after crisis, investors react to positive shocks of 2 months’ prior prices of exchange rate, 1 month prior prices of gold. This shows that in short run and after crisis, investors only react to negative shocks of gold prices. Another possibility is that investors ignore negative shocks associated with oil prices and exchange rate in short run after crisis. In short run before global financial crisis, oil prices are having asymmetrical effect on stock prices but after crisis this asymmetrical relationship is changed into symmetrical because investors react equally to positive and negative shocks to oil prices.
5.1. Practical implications
In exiting literature, researchers have focused on linear relationship between macroeconomic fluctuation and stock prices while ignoring the asymmetrical effect of macroeconomic variables on stock prices. NARDL model is having the capacity to decompose independent variable into positive and negative shocks. Overall findings suggest that relationship is asymmetrical between macroeconomic fluctuations and stock prices which is being studied as symmetrical. In long run before global financial crisis, investors react differently to gold and oil prices but after crisis in long run, they have shown different reactions to all macroeconomic variables including exchange rate, gold prices, and oil prices. This implies that investors need to consider asymmetrical relationship between macroeconomic variability and stock prices while making long-term decisions. In short run before global financial crisis, investors react differently to positive and negative shocks of gold prices, oil prices, and exchange rate. However, they ignored oil prices in short run after crisis. This shows that investors need to consider any tail event like global financial crisis, because making a decision without considering the scenario or tail event may lead toward unfavorable consequences. Researchers also need to shift their focus on asymmetrical relationship between macroeconomic variables and stock prices because ignoring such event while exploring the macroeconomic stock price nexus lead toward spurious results.
5.2. Limitation and future directions
Like all other time series studies on macroeconomic variables, this research has its own limitation as current study is only limited to context of developing country like Pakistan. Future research should be conducted on comparing the results of developing countries such as India, Pakistan, Sri Lanka, and Bangladesh through implementing NARDL in order to get more diversified perspective of positive and Negative impact of fluctuations of macroeconomic variables on stock prices in the developing countries.
Additional information
Funding
Notes on contributors
Umaid A. Sheikh
Umaid A. Sheikh has also published previously in Journals indexed in Web of Science Core Collection and Australian Business Dean Council. He has completed several academic degrees including BBA(hons), MBA, and Master of Philosophy in Accounting and Finance. His research interest includes Behavioral Finance, Financial Economics, Development Economics, Energy Economics, Business Economics, Time series and Panel data modelling.
Muzaffar Asad
Dr. Muzaffar Asad is working as an Assistant Professor at University of Bahrain, College of Business Administration. He completes his PhD in Entrepreneurial Finance and has supervised several research projects in the field of entrepreneurship, finance, and business management.
Zahid Ahmed
Dr. Zahid Ahmad has been associated with the University of Central Punjab for the last 10 years. He is a well-known professor of Statistics holding MPhil and PhD (Statistics) from Government College University, Lahore.
Umer Mukhtar
Umer Mukhtar is Assistant Professor at GIFT Business School, GIFT University.
Notes
1. A dummy variable is also created in order to deal with structural breaks. 0 is for period before 2008 and 1 for period after 2008. Dummy variables is included in NARDL models of postcrisis and whole sample period.
References
- Abbas, G., McMillan, D. G., & Wang, S. (2017). Conditional volatility nexus between stock markets and macroeconomic variables: Empirical evidence of G-7 countries. Journal of Economic Studies, 45(1), 77–20. https://doi.org/10.1108/JES-03-2017-0062
- Abdullah, O. A. H. (2018). Identification of macroeconomic determinants for diversification and investment strategy for Islamic unit trust funds in Malaysia. International Journal of Emerging Markets, 13(4), 653–675. https://doi.org/10.1108/IJoEM-03-2017-0074
- Adjasi, C. K. D. (2009). Macroeconomic uncertainty and conditional stock‐price volatility in frontier African markets: Evidence from Ghana. The Journal of Risk Finance, 10(4), 333–349. https://doi.org/10.1108/15265940910980641
- Adjasi, C. K. D., Biekpe, N. B., & Osei, K. A. (2011). Stock prices and exchange rate dynamics in selected African countries: A bivariate analysis. African Journal of Economic and Management Studies, 2(2), 143–164. https://doi.org/10.1108/20400701111165623
- Agyire‐Tettey, K. F., & Kyereboah‐Coleman, A. (2008). Impact of macroeconomic indicators on stock market performance: The case of the Ghana stock exchange. The Journal of Risk Finance, 9(4), 365–378. https://doi.org/10.1108/15265940810895025
- Ajaz, T., Nain, M. Z., Kamaiah, B., & Sharma, N. K. (2017). Stock prices, exchange rate and interest rate: Evidence beyond symmetry. Journal of Financial Economic Policy, 9(1), 2–19. https://doi.org/10.1108/JFEP-01-2016-0007
- Alkhuzaie, A. S., & Asad, M. (2018). Operating cashflow, corporate governance, and sustainable dividend payout. International Journal of Entrepreneurship, 22(4), 1–9. https://www.semanticscholar.org/paper/Operating-Cash-Flow%2C-Corporate-Governance-And-Alkhuzaie-Asad/277d3af85315e99810f22ea8524bc798701f3b9c
- Almansour, A. Z., Asad, M., & Shahzad, I. (2016). Analysis of corporate governance compliance and its impact over return on assets of listed companies in Malaysia. Science International, 28(3), 2935–2938. https://www.researchgate.net/publication/309202451_Analysis_of_Corporate_Governance_Compliance_and_its_Impact_Over_Return_on_Assets_of_Listed_Companies_of_Malaysia
- Andriansyah, A., & Messinis, G. (2019). Stock prices, exchange rates and portfolio equity flows: A Toda-Yamamoto panel causality test. Journal of Economic Studies, 46(2), 399–421. https://doi.org/10.1108/JES-12-2017-0361
- Apergis, N., & Miller, S. (2005). Money volatility and output volatility: Any asymmetric effects?: Evidence from conditional measures of volatility. Journal of Economic Studies, 32(6), 511–523. https://doi.org/10.1108/01443580510631397
- Arfaoui, M., & Ben Rejeb, A. (2017). Oil, gold, US dollar and stock market interdependencies: A global analytical insight. European Journal of Management and Business Economics, 26(3), 278–293. https://doi.org/10.1108/EJMBE-10-2017-016
- Asad, M. (2011). Working capital management and corporate performance of textile sector in Pakistan. Paradigms: A Research Journal of Commerce, Economics and Social Sciences, 6(1), 100–114. https://doi.org/10.24312/paradigms060101
- Asad, M., Ahmad, I., Haider, S. H., & Salman, R. (2018). A critical review of islamic and conventional banking in digital era: A case of Pakistan. International Journal of Engineering & Technology, 7(4.7), 57–59. https://doi.org/10.14419/ijet.v7i4.7.20382
- Asad, M., & Farooq, A. (2009). Factors influencing KSE 100 index/share prices. Pardigms A Journal of Commerce, Economics, and Social Sciences, 3(1), 34–51. https://doi.org/10.24312/paradigms030102
- Asad, M., & Qadeer, H. (2014). Components of working capital and profitability: A case of fuel and energy sector of Pakistan. Pardigms A Journal of Commerce, Economics, and Social Sciences, 8(1), 50–64. https://doi.org/10.24312/paradigms08010
- Bahmani-Oskooee, M., & Saha, S. (2015). On the relation between stock prices and exchange rates: A review article. Journal of Economic Studies, 42(4), 707–732. https://doi.org/10.1108/JES-03-2015-0043
- Bashir, A., & Asad, M. (2018). Moderating effect of leverage on the relationship between board size, board meetings and performance: A study on textile sector of Pakistan. American Scientific Research Journal for Engineering, Technology, and Sciences (ASRJETS), 39(1), 19–29.
- Bhargava, A. (2014). Firms’ fundamentals, macroeconomic variables and quarterly stock prices in the US. Journal of Econometrics, 183(2), 241–250. https://doi.org/org/10.1016/j.jeconom.2014.05.014
- Black, A. J., McMillan, D. G., & McMillan, F. J. (2015). Cointegration between stock prices, dividends, output and consumption: Evidence and forecasting ability for 29 markets. Review of Accounting and Finance, 14(1), 81–103. https://doi.org/10.1108/RAF-09-2013-0103
- Brooks, C. (1996). Testing for non-linearity in daily sterling exchange rates. Applied Financial Economics, 6(4), 307–317. https://doi.org/10.1080/096031096334105
- Camilleri, S. J., Scicluna, N., & Bai, Y. (2019). Do stock markets lead or lag macroeconomic variables? Evidence from select European countries. The North American Journal of Economics and Finance, 48(1), 170–186. https://doi.org/org/10.1016/j.najef.2019.01.019
- Chandra, A. (2012). Cause and effect between FII trading behaviour and stock market returns: The Indian experience. Journal of Indian Business Research, 4(4), 286–300. https://doi.org/10.1108/17554191211274794
- Chen, Y., Yang, S., & Lin, F. (2012). Foreign institutional industrial herding in Taiwan stock market. Managerial Finance, 38(3), 325–340. https://doi.org/10.1108/03074351211201442
- Chiang Leong, C., & Hui, T.-K. (2014). Macroeconomic and non-macroeconomic variables linking to Singapore hotel stock returns. In Advances in hospitality and leisure (Vol. 10, pp. 2–21). Emerald Group Publishing Limited. https://doi.org/org/doi:10.1108/S1745-354220140000010000
- Fan, W., Fang, S., & Lu, T. (2014). Macro-factors on gold pricing during the financial crisis. China Finance Review International, 4(1), 58–75. https://doi.org/10.1108/CFRI-09-2012-0097
- Galadima, M. D., & Aminu, A. W. (2020). Nonlinear unit root and nonlinear causality in natural gas - economic growth nexus: Evidence from Nigeria. Energy, 190(1), 116415. https://doi.org/org/10.1016/j.energy.2019.116415
- Ghauri, S. M. K. (2014). Determinants of changes in share prices in banking sector of Pakistan. Journal of Economic and Administrative Sciences, 30(2), 121–130. https://doi.org/10.1108/JEAS-05-2013-0014
- Ghosh, D., Levin, E. J., Wright, R. E., & Macmillan, P. (2004). Gold as an inflation hedge? Studies in Economics and Finance, 22(1), 1–25. https://doi.org/10.1108/eb043380
- Ghulam, A. (2018). Conditional volatility nexus between stock markets and macroeconomic variables. Journal of Economic Studies, 45(1), 77–99. https://doi.org/10.1108/JES-03-2017-0062
- Granger, C., & Yoon, G. (2002). Hidden cointegration (Royal Economic Society Annual Conference 2002). Royal Economic Society. https://econpapers.repec.org/RePEc:ecj:ac2002:92
- Gregoriou, A., Healy, J., & Gupta, J. (2015). Determinants of telecommunication stock prices. Journal of Economic Studies, 42(4), 534–548. https://doi.org/10.1108/JES-06-2013-0080
- Günsel, N., Türsoy, T., & Rjoub, H. (2009). The effects of macroeconomic factors on stock returns: Istanbul Stock Market. Studies in Economics and Finance, 26(1), 36–45. https://doi.org/10.1108/10867370910946315
- Husain, S., Tiwari, A. K., Sohag, K., & Shahbaz, M. (2019). Connectedness among crude oil prices, stock index and metal prices: An application of network approach in the USA. Resources Policy, 62(1), 57–65. https://doi.org/org/10.1016/j.resourpol.2019.03.011
- Hyde, S. (2007). The response of industry stock returns to market, exchange rate and interest rate risks. Managerial Finance, 33(9), 693–709. https://doi.org/10.1108/03074350710776244
- Ibrahim, M. H. (2012). Financial market risk and gold investment in an emerging market: The case of Malaysia. International Journal of Islamic and Middle Eastern Finance and Management, 5(1), 25–34. https://doi.org/10.1108/17538391211216802
- Inoguchi, M. (2014). The impact of external shocks on stock prices in the East Asian domestic banking sector. In Risk management post financial crisis: A period of monetary easing (Vol. 96, pp. 6–97). Emerald Group Publishing Limited. https://doi.org/org/doi:10.1108/S1569-375920140000096004
- Jehan, Z., & Rashid, A. (2014). The response of macroeconomic aggregates to monetary policy shocks in Pakistan. Journal of Financial Economic Policy, 6(4), 314–330. https://doi.org/10.1108/JFEP-04-2013-0016
- Khalil, R., Asad, M., & Khan, S. N. (2018). Management motives behind the revaluation of fixed assets for sustainability of entrepreneurial companies. International Journal of Entrepreneurship, 22(Special), 1–9. https://www.researchgate.net/publication/328926350_Management_motives_behind_the_revaluation_of_fixed_assets_for_sustainability_of_entrepreneurial_companies
- Khan, H. H., Naz, I., Qureshi, F., & Ghafoor, A. (2017). Heuristics and stock buying decision: Evidence from Malaysian and Pakistani stock markets. Borsa Istanbul Review, 17(2), 97–110. https://doi.org/org/10.1016/j.bir.2016.12.002
- Khanh Ngoc, L., & Hussainey, K. (2009). The impact of macroeconomic indicators on Vietnamese stock prices. The Journal of Risk Finance, 10(4), 321–332. https://doi.org/10.1108/15265940910980632
- Kim, H. S., Kang, D. S., & Kim, J. H. (2003). The BDS statistic and residual test. Stochastic Environmental Research and Risk Assessment, 17(1), 104–115. https://doi.org/10.1007/s00477-002-0118-0
- Kumar, M. (2013). Returns and volatility spillover between stock prices and exchange rates: Empirical evidence from IBSA countries. International Journal of Emerging Markets, 8(2), 108–128. https://doi.org/10.1108/17468801311306984
- Kumar, R., & Dhankar, R. S. (2017). Financial instability, integration and volatility of emerging South Asian stock markets. South Asian Journal of Business Studies, 6(2), 177–190. https://doi.org/10.1108/SAJBS-07-2016-0059
- Lili, L., & Chengmei, D. (2013). Research of the influence of macro-economic factors on the price of gold. Procedia Computer Science, 17(Suppl.C), 737–743. https://doi.org/org/10.1016/j.procs.2013.05.095
- Mathur, S. K. (2018, January 1). Exchange rate nonlinearities in India’s exports to the USA. In S. Abhishek (Ed.), Studies in economics and finance, (pp. 244-255). https://doi.org/10.1108/SEF-07-2015-0179
- Mazuruse, P. (2014). Canonical correlation analysis: Macroeconomic variables versus stock returns. Journal of Financial Economic Policy, 6(2), 179–196. https://doi.org/10.1108/JFEP-09-2013-0047
- Merikas, A. G., & Merika, A. A. (2006). Stock prices response to real economic variables: The case of Germany. Managerial Finance, 32(5), 446–450. https://doi.org/10.1108/03074350610657454
- Mollick, A., & Nguyen, K. H. (2015). U.S. oil company stock returns and currency fluctuations. Managerial Finance, 41(9), 974–994. https://doi.org/10.1108/MF-02-2014-0029
- Mongi, A. (2017). Oil, gold, US dollar and stock market interdependencies: A global analytical insight. European Journal of Management and Business Economics, 26(3), 278–293. https://doi.org/10.1108/EJMBE-10-2017-016
- Mouna, A. (2019, January 1). Transmission of shocks between Chinese financial market and oil market. (B.-A. Mouna Ed.). International Journal of Emerging Markets, (Vol. 15 No. 2, pp. 262-286). https://doi.org/10.1108/IJOEM-07-2017-0244
- Muhammad, A. (2017a). Modelling the asymmetric impact of defence spending on economic growth: An evidence from non-linear ARDL and multipliers. Journal of Economic and Administrative Sciences, 33(2), 131–149. https://doi.org/10.1108/JEAS-03-2017-0010
- Nezu, E., & Kurihara, Y. (2006). Recent stock price relationships between Japanese and US stock markets. Studies in Economics and Finance, 23(3), 211–226. https://doi.org/10.1108/10867370610711057
- Nguyen, T., & Ngo, C. (2014). Impacts of the US macroeconomic news on Asian stock markets. The Journal of Risk Finance, 15(2), 149–179. https://doi.org/10.1108/JRF-09-2013-0064
- Olaleke, F. I. (2019). Oil and agricultural commodity prices in Nigeria: New evidence from asymmetry and structural breaks. International Journal of Energy Sector Management, 13(2), 377–401. https://doi.org/10.1108/IJESM-07-2018-0004
- Pandey, V., & Vipul. (2018). Volatility spillover from crude oil and gold to BRICS equity markets. Journal of Economic Studies, 45(2), 426–440. https://doi.org/10.1108/JES-01-2017-0025
- Pradhan, R. P., Arvin, M. B., & Ghoshray, A. (2015). The dynamics of economic growth, oil prices, stock market depth, and other macroeconomic variables: Evidence from the G-20 countries. International Review of Financial Analysis, 39(Suppl.C), 84–95. https://doi.org/org/10.1016/j.irfa.2015.03.006
- Rajesh, S. (2019). Dynamism between selected macroeconomic determinants and electricity consumption in India. International Journal of Social Economics, 46(6), 805–821. https://doi.org/10.1108/IJSE-11-2018-0586
- Rangan, G. (2013). Macroeconomic surprises and stock returns in South Africa. Studies in Economics and Finance, 30(3), 266–282. https://doi.org/10.1108/SEF-Apr-2012-0049
- Reid, M., & Gupta, R. (2013). Macroeconomic surprises and stock returns in South Africa. Studies in Economics and Finance, 30(3), 266–282. https://doi.org/10.1108/SEF-Apr-2012-0049
- Rexford, A. (2019, January 1). “Corporate performance volatility and adverse macroeconomic conditions. A causal interaction perspective”. Journal of Financial Economic Policy, 11(4), 533-547. https://doi.org/10.1108/JFEP-11-2018-0158
- Salvatore, C. (2019). The long-run interrelationship between exchange rate and interest rate: The case of Mexico. Journal of Economic Studies, 46(7), 1380–1397. https://doi.org/10.1108/JES-04-2019-0176
- Saumya, R. D. (2012). Investor sentiment, risk factors and stock return: Evidence from Indian non‐financial companies. Journal of Indian Business Research, 4(3), 194–218. https://doi.org/10.1108/17554191211252699
- Shaker, R. Z., Asad, M., & Zulfiqar, N. (2018). Do predictive power of fibonacci retracements help the investor to predict future? A study of Pakistan stock exchange. International Journal of Economics and Financial Research, 4(6), 159–164. https://ideas.repec.org/a/arp/ijefrr/2018p159-164.html
- Shakil, M. H., Mustapha, I. M., Tasnia, M., & Saiti, B. (2018). Is gold a hedge or a safe haven? An application of ARDL approach. Journal of Economics, Finance and Administrative Science, 23(44), 60–76. https://doi.org/10.1108/JEFAS-03-2017-0052
- Shin, Y., Yu, B., & Greenwood-Nimmo, M. (2014), “Modelling asymmetric cointegration and dynamic multipliers in a nonlinear ARDL framework”, Festschrift in Honor of Peter Schmidt, Springer, New York, NY, pp. 281-314
- Shrestha, K. M., & Liu, M. (2008). Analysis of the long‐term relationship between macro‐economic variables and the Chinese stock market using heteroscedastic cointegration. Managerial Finance, 34(11), 744–755. https://doi.org/10.1108/03074350810900479
- Simbolon, L., & Purwanto. (2018). The influence of macroeconomic factors on stock price: The case of real estate and property companies. In Global tensions in financial markets (Vol. 34, pp. 2–19). Emerald Publishing Limited. https://doi.org/org/doi:10.1108/S0196-382120170000034010
- Singhania, M., & Prakash, S. (2014). Volatility and cross correlations of stock markets in SAARC nations. South Asian Journal of Global Business Research, 3(2), 154–169. https://doi.org/10.1108/SAJGBR-04-2012-0056
- Syed, A. A. S. G., & Shaikh, F. M. (2013). Effects of macroeconomic variables on gross domestic product (GDP) in Pakistan. Procedia Economics and Finance, 5(1), 703–711. https://doi.org/org/10.1016/S2212-5671(13)00082-8
- Tang, X., & Yao, X. (2018). Do financial structures affect exchange rate and stock price interaction? Evidence from emerging markets. Emerging Markets Review, 34(C), 64-76. Elsevier. https://doi.org/org/10.1016/j.ememar.2017.10.004
- Tehreem, F. (2018). An aggregate and disaggregate energy consumption, industrial growth and CO2 emission: Fresh evidence from structural breaks and combined cointegration for China. International Journal of Energy Sector Management, 12(1), 130–150. https://doi.org/10.1108/IJESM-08-2017-0007
- Tiwari, A. K., Dar, A. B., Bhanja, N., Arouri, M., & Teulon, F. (2015). Stock returns and inflation in Pakistan. Economic Modelling, 47(1), 23–31. https://doi.org/org/10.1016/j.econmod.2014.12.043
- Tsoukalas, D. (2003). Macroeconomic factors and stock prices in the emerging Cypriot equity market. Managerial Finance, 29(4), 87–92. https://doi.org/10.1108/03074350310768300
- Tuna, G. (2018). Interaction between precious metals price and Islamic stock markets. International Journal of Islamic and Middle Eastern Finance and Management, 12(1), 96–114. https://doi.org/10.1108/IMEFM-06-2017-0143
- Umar, M., & Sun, G. (2015). Country risk, stock prices, and the exchange rate of the renminbi. Journal of Financial Economic Policy, 7(4), 366–376. https://doi.org/10.1108/JFEP-11-2014-0073
- Vezos, P., & Lael Joseph, N. (2006). The sensitivity of US banks’ stock returns to interest rate and exchange rate changes. Managerial Finance, 32(2), 182–199. https://doi.org/10.1108/0307435061064193
- Wang, Y., & Fan, W. (2014). R&D reporting methods and firm value: Evidence from China. Chinese Management Studies, 8(3), 375–396. https://doi.org/10.1108/CMS-01-2013-0019
- Wickremasinghe, G. (2011). The Sri Lankan stock market and the macroeconomy: An empirical investigation. Studies in Economics and Finance, 28(3), 179–195. https://doi.org/10.1108/10867371111141954
- Yu, S., & Leistikow, D. (2011). Abnormal stock returns, for the event firm and its rivals, following the event firm’s large one‐day stock price drop. Managerial Finance, 37(2), 151–172. https://doi.org/10.1108/03074351111103686
- Zaheer, A. (2019). How do Islamic equities respond to monetary actions? International Journal of Emerging Markets, 14(4), 503–522. https://doi.org/10.1108/IJOEM-11-2017-0459