
Abstract
We examine 112,792 daily candles using more than one million spot quotes among 24 currency pairs between 2000 and 2018. We find that chart patterns are profitable. Relying on these visually based patterns achieves returns of more than 600% after accounting for the transaction costs. Nevertheless, the transaction costs are substantial. In particular, the spread is a large burden on profitability. Overall, our evidence suggests that technical analysis could generate excess returns and that the profitability of technical analysis cannot be explained by market inefficiency. Rather, the evidence is consistent with that on the link between the efficiency and profitability of technical analysis.
PUBLIC INTEREST STATEMENT
The paper investigates the profitability of technical analysis in the forex market using chart patterns. We examine a large dataset of 24 currency pairs between 2000 and 2018. Our results show that technical analysis can be profitable when equipped with the right trading strategies and the right risk management tools. Relying on the chart patterns we use: the piercing line and dark cloud cover patterns, and trading only 10% of the offered margin enabled us to generate profit of above 600% after accounting for all transaction costs. This is a return of about 11% annually over our time span.
1. Introduction
When technical analysis (TA) proves successful, it is the market that is inefficient; however, when it fails, researchers agree that the market is efficient and TA has no merit. Accordingly, TA is not accepted in the academic world under any circumstances. No study has attempted to link market efficiency and TA profitability. The issue in the finance literature is that TA contradicts Fama’s (Citation1970), Fama (Citation1991)) efficient market hypotheses and even refutes the weakest form of Jensen’s (Citation1978) market efficiency. Bessembinder and Chan (Citation1998) were perhaps the first to point to this important issue, stating that “technical analysis profitability needs not be inconsistent with market efficiency.” The present study provides evidence in this regard.
The root of TA goes back to Japanese rice traders in the 1600s (Zhu & Zhou, Citation2009). TA can be defined as “a method for forecasting asset price movements using past prices” (Park & Irwin, Citation2007). It is widely used in speculative markets by practitioners, financial analysts, and fund managers (Cheung & Chinn, Citation2001; Gehrig & Menkhoff, Citation2004; Menkhoff, Citation1997; Smidt, Citation1965b). However, contrary to practitioners, academics do not adopt TA for two major reasons. First, as noted above, TA contradicts the weakest form of the efficient market hypothesis (random walk theory). Second, TA lacks a theoretical foundation. There is thus a huge gap between academic theories and TA. This controversy is perhaps one of the oldest in the finance literature, with the first empirical evidence found by Cowles in 1933.
The findings on the profitability of TA are mixed. Levich and Thomas (Citation1993) examine the profitability of TA in the future forex market between 1976 and 1990 and find that simple technical trading rules led to profits over the entire period and between intervals. Dooley & Shafer, Citation1975, Dooley & Shafer, Citation1983) use filter rules on spot rates for nine currencies between 1973 and 1981 and find positive profits after accounting for transaction costs and interest rate differentials. SWEENEY (Citation1986), Sweeny (Citation1988)) also finds positive profits among 10 currencies, using filter rules from 1973 to 1980 and in stock markets.Footnote1
On the contrary, a large number of studies reject TA. Fama and Blume (Citation1966) were among the first to report the failure of TA in the stock market, especially after accounting for transaction costs. Hudson et al. (Citation1996) repeat the study of Broke et al. (Citation1992) in the UK market and find that technical rules are unprofitable if transaction costs are accounted for. Lee, Gleason et al. (Citation2001) examine 13 Latin American currencies and find that technical rules are profitable for four currencies but not for the others. Lee, Pan et al. (Citation2001) examine nine Asian currencies and show that technical rules do not generate significant positive results.
The contributions of this study are threefold. First, it attempts to determine the possible links between market efficiency and TA profitability in the forex market, the largest market in the world (about 5 USD trillion daily volume). The forex market, which has 24-hour trading, is also a high-frequency trading market, which enables it to trade freely with minimal pips (Levich, Citation1989; Menkhoff et al., Citation2016; Piccotti, Citation2018).Footnote2
Second, this is the first study to examine what Achelis (Citation2001) calls “the long forgotten Asian secrets.” Visually based pattern studies include the early study by Levy (Citation1971) of the five-point pattern, head and shoulders by Osler and Chang (Citation1995), that of Lucke (Citation2003), the study of the bull flag by Leigh et al. (Citation2002), and the study of various patterns by Lo et al. (Citation2000). Our study differs in that we examine a different type of pattern that can be expressed algebraically. We use Japanese candlesticks for the pattern identifications as well as for our entry and exit procedure without subjectivity. In other words, our pattern can be re-examined and replicated. One of the major problems among chart patterns is subjectivity (Chang & Osler, Citation1999; Levy, Citation1971; Osler & Chang, Citation1995). Niftci (Citation1991) states that these visual patterns are a broad class of prediction rules with unknown statistical properties.
The third contribution is that this is the first study to examine the profitability of TA in the forex market using margins by employing different methods and techniques to evaluate its performance. Individual investors need a margin to access the forex market to exploit the small proportions of daily currency movements in pips (basis points). Most previous studies of the forex market ignore this fact.
Our evidence supports the use of TA. We detect 1,677 trades for 24 currency pairs over 19 years. We use three trading strategies: (i) setting our target equal to the stop/loss (1:1 reward/risk ratio), (ii) using a 2:1 reward/risk ratio, and (iii) using a 3:1 reward/risk ratio. Using strategy (i) is unprofitable. Indeed, the pattern does not offer more than a 50% winning probability. However, when we apply the 2:1 reward/risk ratio, total returns increase to approximately 268%, even though the number of profitable trades is reduced by half. Therefore, the pattern carries strong predictive power when employed correctly. Lastly, using the 3:1 reward/risk ratio increases total returns to 642% even though our profitable trades become only one-third of total trades.
Furthermore, we find that the transaction costs of the spread and rollover influence the profitability of TA significantly in line with Menkhoff and Taylor (Citation2007) finding that transaction costs do not necessarily eliminate profitability. Our study empirically reports the significant impact of this cost.Footnote3 The total spread paid on 1,677 trades amounts to 12,861 pips. This is a huge cost (income for forex brokers) compared with our net income of about 5,000 pips. In addition, the total interest earned on these positions amounts to 2,780. USD Finally, we find that 14 pairs show profitability and 10 show negative results. In particular, the pound pairs show the best outcome due to volatility, followed by the Canadian dollar, whereas the euro and Swiss franc perform the worst.
2. Piercing line and dark cloud cover patterns
TA can be divided into quantitative and qualitative analyses. Our study falls under the qualitative type because it relies on chart patterns with no clear statistical properties. The piercing line and dark cloud cover patterns are reversal sign patterns (Achelis, Citation2001). They represent a potential reverse (U-turn) in the price when they occur. The piercing line represents a potential shift in the market from a falling bearish market to a rising bullish market. The dark cloud cover pattern indicates the opposite: a shift from a rising bullish market to a declining bearish market. Both patterns consist of two consecutive candles that occur after a severe upward or downward trend.
Figure shows the piercing line pattern. Initially, there is a downward trend, and the price heads south. Then, we observe two consecutive candles, a large bearish candle to the left (the previous candle, or PC) and a large bullish candle (the current candle, or CC) to the right. The PC represents the end of the downward trend and the CC represents the potential reversal. With the constitution of the CC, bears attempt to lower the price further and succeed at the beginning where the CC records a new low (a lower low). However, bulls fight back and succeed in pushing the price back up. Eventually, bulls win the battle and manage to close the candle as bullish. The bullish CC is close to 50% of the PC’s real size, which means that bulls retrace most of bears’ gain. The low of the CC characterizes an ideal area to place the stop/loss since the price might have bottomed out (a support level).
Figure illustrates the dark cloud cover pattern. It is the same as the piercing line pattern, but in the other direction. Initially, the price heads north. This upward trend is followed by two consecutive candles, namely, the PC to the left and the CC to the right. The PC is firmly bullish, while the CC is bearish. At the beginning, bulls try to raise the price further, and they succeed initially where the CC records a new high (a higher high). However, bears fight back and manage to return the price down. Eventually, bears win the battle and succeed in closing the candle as a solid bearish candle (close to open). The CC closes at a level below 50% of the real PC size. This means that bears manage to retrace most of bulls’ gains. At this stage, the market is prepared for a further decline. The high of the CC characterizes an ideal area to place the stop/loss because it represents a potential high (a resistance level).
From a behavioral finance perspective, the bullish piercing line and bearish dark cloud cover patterns represent a potential shift and reversal in the market. If there is no shift in the market, we observe no fluctuations, and the price will head in one direction. The movement of the price between upward and downward trends reflects the psychology and behavior of buyers and sellers at various points in time. Achelis (Citation2001) states, “I have met investors who are attracted to candlesticks by their mystique—maybe they are the ‘long forgotten Asian secret’ to investment analysis.” These visually based patterns are well known among practitioners, but have never been tested empirically. Other long forgotten Asian secrets include the hammer and hanging man patterns, bullish and bearish engulfing patterns, doji star, and morning star. All these patterns rely on the formation of candles and how they represent certain drawings that reflect changing behavior in the price action. Other previously visually based patterns tested include the head and shoulders pattern, bull flag pattern, and five-point pattern. Asian patterns differ in that they can be programmed under clearly defined conditions. For instance, we can determine at which candle(s) particularly to look and when to enter/exit.
Figure 1. Piercing line and dark cloud cover patterns.
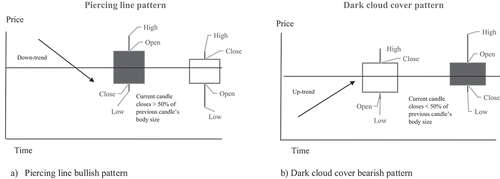
The figure explains the piercing line and dark cloud cover patterns. The pattern consists of two consecutive candles: the CC to the right and the PC to the left. Both patterns occur after a clear trend. The piercing line pattern (a) occurs after a downward trend. The downtrend is followed by two consecutive candles (pattern). The dark cloud cover pattern (b) is the same but in the opposite direction, which occurs after an up-trend.
3. Data and methodology
3.1. Data sources
We collect daily quote data for currency spot exchange rates from the Forex Capital Market, a global forex broker. We collect spot quotes on 24 currency pairs, as shown in Table . The study period runs from the beginning of 2000 to the end of 2018. We collect complete daily data for 16 pairs, including major pairs (4,834 daily quotes). For eight pairs, we collect 4,431 daily quotes, starting from their day of inception in the Forex Capital Market on 28 November 2001. Therefore, we collect the spot quotes of 112,792 daily candles.
Table 1. Summary statistics for the 24 currency pairs between 2000 and 2018
For each pair, we collect eight quotes: the open bid/ask, high bid/ask, low bid/ask, and close bid/ask. The calculations of the mid-point provide four additional observations, leading to more than a million spot observations. Pairs’ exchange rates are quoted in an indirect quotation, where the first currency (the base) represents the domestic currency and the second currency represents the foreign currency.Footnote4 Cross rates are collected without adjustments, assuming no-triangular arbitrage (Piccotti, Citation2018).
The data points on the interest rates for all eight currencies are collected from Bloomberg. We use the LIBOR overnight rate to calculate the interest rate differentials. This benchmark rate represents the interest rate at which banks lend funds to one another in the international interbank market in the short term.
3.2. Summary statistics
Table shows the summary statistics for the 24 currency pairs in the analysis. For the first seven major pairs, we observe that the British pound belongs to the most volatile pairs among the majors. It fluctuates by more than 660,000 pips over the 19 years with an average daily movement of 137 pips. The other pound crosses show the same pattern of high volatility. GBP/NZD records the highest volatility, rising by more than 1.2 million pips between 2001 and 2018. The spread of the pound is relatively high, ranging between 4.5 and 20 pips. In addition, we detect extreme daily movements for the pound. For instance, the GBP/USD maximum daily movement is 1,791 pips, which was recorded on the day of the Brexit announcement.Footnote5
Looking next at the euro, EUR/USD has a daily price movement of almost 100 pips. The pair has the lowest spread at 2.6 pips, which is understood given that it is the most heavily traded. This pair alone controls 23.1% of the over-the-counter forex market with a daily average turnover of 1,172 USD billion. The other euro crosses show the second largest volatility after the British pound crosses. EUR/AUD and EUR/NZD have large daily price movements of 136 and 172 pips, respectively and both show a spread of over 10 pips. The inverse relationship is found between volatility and spread and between liquidity and spread.
Moving to the Japanese yen pairs, USD/JPY rises by more than 374,000 pips over the 19-year period. This pair has a relatively moderate daily price movement of 88 pips and the second lowest spread at 3.3 pips. Moreover, it is the second largest traded pair in the over-the-counter market with a 901 USD billion daily turnover. The most volatile yen crosses are with the pound (i.e., GBP/JPY), which has a daily price movement of 159 pips, and the least volatile is NZD/JPY at 84 pips. The yen is always quoted in a way that it represents the counter currency.Footnote6 USD/CHF seems to mirror the EUR/USD pair, as it shows the same price daily movement of 99 pips. However, the franc pairs show extreme daily movement, which is linked to the sudden peg removal of the franc with the euro at 1.2/euro maximum adopted by the Swiss National Bank. The franc pairs show an immediate deterioration against all currencies. For instance, it lost 20% against the US dollar.
3.3. Methodology
The midpoint is calculated as follows:
This is used for all four quotes: open, high, low, and close. The four quotes are needed for the entry and exit procedure we employ. When the conditions of the piercing line pattern occur, we enter into a long position by buying at the opening ask price of the next candle. Similarly, when the conditions for the dark cloud cover pattern occur, we enter into a short position by selling at the opening price bid. These are used to account for the spread. Additionally, we close the position once the price hits either our set stop/loss or the target.
3.3.1. Theoretical framework and model setup
Behavioral finance can be defined as “finance from a broader social science perspective including psychology and sociology.” Our study falls under behavioral finance, where the candles represent investors’ behavior and actions. Japanese candlesticks reveal much of the conflict between buyers (demanders) and sellers (suppliers). Tversky and Kahneman (Citation1974) were early researchers in the field of behavioral finance.
Two key players are added into this model: arbitrageurs and noise traders. Arbitrageurs are sophisticated rational traders, whereas noise traders are irrational investors. De Long et al. (Citation1991) suggest that noise traders may control the market over arbitrageurs, even in the long run, which gives rise to the profitability of TA. Buying when prices rise and selling when prices fall attract more investors to the market and exaggerate the rise or decline (optimism or pessimism). Froot et al. (Citation1992) state that the large number of uses of TA and charting may generate positive returns for chartists. Behavioral finance differs from efficient market assumptions in that investors are assumed to be irrational, and this irrationality creates market anomalies, which allows TA to be profitable.
To identify the piercing line and dark cloud cover patterns, our model consists of 12 consecutive candles. The first 10 candles are used to identify the trend and the last two are used to identify the pattern. The last two candles are labeled the CC, which occurs at time , and the PC, which occurs at time
. We identify the trend by comparing the first candle before the PC, which occurs at time
(
, with the 10th candle before the PC, which occurs at time
(
). Therefore, the piercing line pattern has the following criteria:
Hence, for a piercing line pattern to arise, first the trend has to be downward, where the high of the candle () is lower than the low of the candle (
, to ensure that the pattern follows a downward trend. Ten candles are used to identify the trend, which represents the past price movement of two weeks. In addition, the PC has to be a bearish candle, where it closes lower than its opening:
; this confirms the continuing of the downward trend. Moreover, the CC has to be a bullish candle, where it closes higher than its opening:
. Nevertheless, the CC starts by declining further, which enables it to record a new low (a lower low). Thus, the CC is a bullish candle firmly with a new recorded low:
. This new low is now considered to support price movement. Lastly, the CC closes as bullish and at a level over half the PC’s real size:
. At this stage, bulls are taking control and the market is prepared for a surge. The stop/loss can be safely placed underneath the CC low (bottom).
The dark cloud cover has the same criteria, but in the opposite direction as follows:
Hence, for a dark cloud cover pattern to arise, first, the trend has to be upward, where the low of the candle is higher than the high of the candle
. This confirms the upward trend. In addition, the PC has to be a bullish candle, where it closes higher than its opening
, which indicates a continuing trend. Moreover, the CC has to be a bearish candle, where it closes lower than its opening
. Nevertheless, the CC starts by rising further, which enables it to record a new high (a higher high). Thus, the CC is a bearish candle firmly with a newly recorded high
. This new high is now considered to be resistance. Lastly, the CC closes as bearish and at a level below half the PC’s real size:
. At this stage, bears are taking control and the market is prepared for a further decline. The stop/loss can be safely placed above the CC.
3.3.2. Trade entry and exit procedure
We enter into a long (short) position when a piercing line (dark cloud cover) pattern is detected. We buy (sell) at the opening of the next candle immediately. We buy at the ask price of the next candle with the piercing line pattern and sell at the bid price of the next candle with the dark cloud cover pattern to account for the spread. This is a direct consideration of the spread cost since we buy at the expensive ask and sell at the cheap bid (Cialenco & Protopapadakis, Citation2011).
We set the stop/loss 10 pips below the low of the CC in the case of a long position or 10 pips above the high of the CC in the case of a short position. The CC low (high) represents the bottom (top) of the price movement. In addition, it represents support (resistance) for a turning price (for the use of support and resistance, see Osler, Citation2000, Citation2003).
The target is always harder than the stop/loss. Some authors assume hypothetically that traders stay in the market for a certain number of days and calculate the return accordingly. For example, Lucke (Citation2003) adopts a strategy of one day or more following the break of the neckline to exit the market. We adopt three methods to exit the market:
We set the target equal to the size of the difference between the entry level and stop/loss. Thus, this is a 1:1 reward/risk ratio. In other words, if we are risking 50 pips, we aim to obtain 50 pips as well. This is a 50/50 win/lose scenario.
We set the target equal to twice the number of pips we are risking. Therefore, this is a 2:1 reward/risk ratio. There is a common saying in the forex market: “cut your losses early and let your profit run.” We test this notion here by aiming to obtain double what we risk.
We set the target three times the stop/loss. Thus, this is a 3:1 reward/risk ratio.
We assume a US dollar-denominated account and starting capital (investment) of 1,000. USD We trade mini-contracts of 10,000. We only use 10% of the offered margin to control for margin risk. This allows us to trade mini-contracts of 10,000 comfortably. All our calculations can be changed by adjusting the corresponding multiplication factor (MF). For instance, if we use a 20% margin, we simply multiply our results by 2. Figure shows some possible profitable trades: a) a profitable piercing line bullish pattern with the 1:1 reward/risk ratio strategy, b) a profitable dark cloud cover bearish pattern with the 1:1 reward/risk ratio strategy, c) a profitable piercing line with the 2:1 reward/risk ratio strategy, and d) a profitable dark cloud cover with the 2:1 reward/risk ratio strategy.
Figure 2. Illustration of the piercing line and dark cloud cover pattern trades.
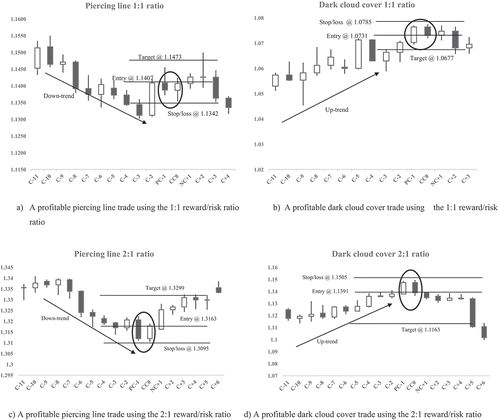
This figure explains the entry and exit procedures. For each trade, we show the entry level, buying price for the piercing line (bullish pattern), and selling price for the dark cloud cover (bearish pattern). For the piercing line, a) shows the 1:1 reward/risk ratio, where the target equals the stop/loss, while c) shows the 2:1 reward/risk ratio, where the target is double the stop/loss. For the dark cloud cover, b) shows the 1:1 reward/risk ratio, where the target equals the stop/loss, while d) shows the 2:1 reward/risk ratio, where the target equals double that of the stop/loss. In all cases, the stop/loss is set to 10 pips below (above) the low (high) of the CC. Candles before the pattern occurrence from C-11 to C-2 are used to identify the conditional trend situation before entry. The PC and CC are used to identify the patterns once all our conditions are met. NC+1 represents the next candle that we enter at its opening price.
3.3.3. Profit and loss calculations
We calculate the US dollar returns for the long and short positions as follows:
where DR is the US dollar return, is the number of pips gained/lost by the long position from the exchange rate movement, and
is that in the short position (i.e., the opposite). This needs to be multiplied by the MF to convert it from a fraction into a real number. The MF is fixed for all pairs at 10,000, except for the Japanese yen pairs, where the MF is 100 because they are quoted in different ways. The result is then multiplied by the pip value of the contract size.
Next, we calculate the rollover (the second transaction cost component) to adjust our return by the interest rate differentials between the two currencies. This is important for positions kept open overnight for more than one day:
where represents the interest rate differential between the two currencies; ND is the number of days between entering the position and closing it out. ND is divided by the number of days in a year to give the overnight rate differential. For both the long and the short positions, the interest rate differentials are earned/paid in the base currency. For the USD pairs (i.e., USD as the base currency), the interest rate differentials are directly collected in US dollars, as in the case of the USD/CAD pair. However, when US dollars is the counter currency, interest is paid/earned in the other currency and needs to be converted into US dollars; for example, for the AUD/USD pair, interest is collected in Australian dollars and then converted into US dollars. For the other pairs such as GBP/NZD, the interest rate differential is earned/paid in pounds, which represents the base currency here. This then needs to be converted into US dollars when the position is closed out.
The adjusted percentage return is calculated based on our initial deposit of 1,000 USD as
Thus, the adjusted percentage return represents the excess return. For all the transactions for each pair over time, we then calculate total returns as follows:
Hence, the total return for each pair is the cumulative returns of all the adjusted returns from all transactions (from first transaction t = 1 to last transaction t).
The mean return becomes
where n represents the number of transactions.
4. Empirical results
4.1. 1:1 reward/risk ratio results
Table reports the results for the piercing line and dark cloud cover patterns using the 1:1 reward/risk ratio strategy. We have 1,652 trades among the 24 pairs over the 19 years. The number of unprofitable trades is greater than the number of profitable trades (840 vs. 812). Eleven of the 24 pairs show positive results (46% of the sample). Our results differ from those of Hsu et al. (Citation2016), who find 50% profitability among 30 currencies.
Table 2. Piercing line and dark cloud cover pattern results (1:1 reward/risk ratio)
The net pip obtained for all trades is negative at 5,459 with a total adjusted return of US$ −4,457 and a total return of −446%. This means that a trader starting with an investment of 1,000 USD and using only a 10% margin would have lost all his/her capital and more than 3,000 USD besides. In other words, the trader must fund his/her accounts three times more and would have received many margin calls. The spread cost is substantial at 12,709 pips, which is more than double our trades’ loss. The spread costs 7.7 pips per transaction on average. This is a huge gain for forex brokers. If we are to recover half the spread, this would make our outcome positive. The total rollover is positive at 545, USD which contributes positively to our trades.
The seven major pairs in Panel A of Table show the same outcome of losses among the majors. The number of profitable and unprofitable trades is almost equal (−2,241 net pips). Only three pairs show positive results, with GBP/USD and USD/CAD performing the best with total returns of 80% and 70%, respectively.
Moving to Panel B for the crosses, we find more extreme negative results. The number of unprofitable trades is larger than that of profitable ones (583 vs. 557). The net pips among the crosses are −3,218, with a total loss of US$ −2,308 (−231%). The spread cost among the crosses is 9.4 pips per transaction on average compared with only 4 pips for the majors. Additionally, the risk for the crosses is larger than that for the majors (13.43% vs. 10.54%) as measured by standard deviations. The worst performer is the NZD/JPY pair, which has a mean return of −4.5%, significant at the 1% level, followed by GBP/CAD, with a mean return of −3.5%, significant at the 5% level. Nevertheless, some of the crosses are profitable. The best performer among them is GBP/AUD, which achieves 3,553 net pips and a total return of 253%. This pair has the highest mean return per transaction of 4%. The EUR/JPY pair comes next, performing the best with a mean return of 2.44%. Overall, using the 1:1 reward/risk ratio strategy does not produce positive results.
4.2. 2:1 reward/risk ratio results
Table shows the results for the piercing line and dark cloud cover patterns using the 2:1 reward/risk ratio strategy. We find 1,676 trades among the 24 pairs over the 19 years. The number of unprofitable trades here far exceeds the number of profitable trades (1,119 vs. 557). This is not surprising given that our target is now set at double the distance from our stop/loss. Overall, the results show the profitability of TA and thus an improvement over the 1:1 strategy. First, the number of profitable pairs has increased to 12, reaching 50% of the sample size, compared with only 11 pairs using the 1:1 strategy. This is consistent with the finding of Hsu et al. (Citation2016), who report 50% profitability among 30 currencies. Second, the net pips for all the trades become positive at 1,883 compared with the previous loss. Third, we observe a positive total adjusted return of 2 USD,677 (276.6%) and a positive mean return of 0.08% per transaction.
Table 3. Piercing line and dark cloud cover pattern results (2:1 reward/risk ratio)
For the transaction costs, we pay the substantial amount of 14,000 pips on the spread (8.4 pips per transaction on average). The spread cost is almost seven times larger than our gain in net pips. On the contrary, the rollover shows a positive contribution to our trades by adding 1,790 USD to our income. Almost two-thirds of our profit comes from the rollover. Hence, most of our trades earn the interest differential rather than paying it. This is the carry trade strategy under which investors buy the currency that offers high interest by funding it using the low-interest currency. This finding is in line with that of SWEENEY (Citation1986).
Panel A of Table shows that majors tend to be losers. AUD/USD performs the worst with a mean transaction return of about 4.5%, significant at the 1% level. On the contrary, GBP/USD performs the best with a total adjusted return of 3 USD,700 and a mean return of 5.14%, significant at the 5% level. In addition, USD/CAD shows a positive result with an adjusted return of more than 2 USD,000 (200%-plus return). This might be linked to the efficiency of the majors, as proposed by Lee, Gleason et al. (Citation2001) and Lee and Mathur (Citation1996a, Citation1996b)).
Panel B of Table shows that the crosses achieved a total return of 348% and a mean return of 0.35%, a much better result than the majors. The best performer is GBP/AUD with a mean return of almost 7%, significant at the 5% level. The most striking observation is how some pairs have changed their outcome completely after switching from using 1:1 strategies to 2:1 strategies. For instance, GBP/CAD has recovered most of its losses (from -$2,518 to -$875). In addition, EUR/AUD recovers almost 2,000 USD of its losses.
Furthermore, we analyze the 3:1 reward/risk ratio (results are not reported for the sake of brevity). Using the 3:1 ratio, there are 1,677 trades among the 24 pairs over the 19-year period. The number of profitable trades is only one-third of total trades. Although the number of unprofitable trades is larger, the overall outcome for all trades is positive, with almost 5,000 net pips. The number of net pips increases from −5,459 with the 1:1 reward/risk ratio strategy to 1,883 with the 2:1 strategy and 4,973 with the 3:1 strategy. It is clear that the saying “let your profit run”’ is true. Additionally, the number of profitable pairs increases from 12 to 14 (58% of the sample), which is much better than the results obtained by Hsu et al. (Citation2016). Relying on the piercing line and dark cloud cover patterns generates an adjusted total return of 6 USD,422 (a total return of 642% or 11.12% annualized) with a mean return of 0.24% per transaction.
4.3. Pattern performance over time and across currencies
The profitability of TA has declined over time as markets have become more efficient (Oslon, Citation2004). For example, Levich and Thomas (Citation1993) find a decline in TA profitability in their final subsample. In addition, Hsu et al. (Citation2016), LeBaron (Citation1999), Menkhoff and Taylor (Citation2007), Neely et al. (Citation2009), and Qi and Wu (Citation2006) find declining TA profitability over time. Table reports the results of the piercing line and dark cloud cover patterns over time. First, we observe that 10 of the 19 years show positive results. The beginning of the sample in 2000 is profitable with a mean adjusted return of 3%. This is somewhat in line with the findings of Neely and Weller (Citation1999), who report profitability recovery in the forex market after 1998. The following year (i.e., 2001) is significantly negative. After that, we observe six successive years of positive results, one of which is significant at the 5% level. Then, from 2008, the outcome is negative until a recovery in 2015. Generally, there is no clear evidence of declining profitability over time; rather, we observe instability year to year consistent with Menkhoff and Taylor (Citation2007) stylized fact number 6. Although previous authors have examined different periods in the 1970s, 1980s, and 1990s, our findings suggest the continuing profitability of TA and the inefficiency of the forex market.
Table 4. Piercing line and dark cloud cover pattern performance over time and across currencies
Table further points to cross-sectional variations between currencies. We find that US dollar pairs are unprofitable. They achieve a total return of −60% and a zero mean transaction return. Furthermore, all the other currencies of the euro pairs, Swiss franc pairs, and New Zealand dollar pairs show negative results. These results are consistent with those of Lee and Mathur (Citation1996a) on the euro, but inconsistent with those of Hsu et al. (Citation2016) on the profitability of the New Zealand dollar.
On the contrary, the British pound pairs show the best outcome of 1,016% in total returns and a 2.4% mean return. Recall that the pound is the most volatile currency; we link the profitability of the pound to its volatility. This finding is in line with Menkhoff and Taylor (Citation2007) stylized fact number 5. In addition, the Canadian dollar is profitable with a 186% total return and 0.7% mean return. Other profitable currencies include the Japanese yen pairs and Australian dollar pairs, which both show positive total returns of 285% and 56%, respectively. Overall, our evidence from the cross-sectional analysis is consistent with the view that TA and patterns might work for some assets, but not for others.
5. Robustness check
The sample period from 2000 to 2018 includes the global financial crisis in 2007–2008 and the Eurozone sovereign debt crisis of 2009–2012. During these events, volatility strengthened for the US dollar and euro, leading to higher transaction costs in the form of wider bid/ask spreads and mid-quote prices. Moreover, owing to speculative attacks and the role played by hedge funds, the value of the euro declined dramatically against the US dollar and other major currencies during the crisis.
Table splits the US dollar and euro samples into pre- and post-crisis periods. Focusing first on the US dollar, we observe that the spread increases from 4.1 to 4.58 pips. Five of the seven show an increase in the spread in the post-crisis period compared with the pre-crisis period. In addition, the mean return per transaction for the US dollar portfolio declines from 0.003% in the pre-crisis period to −0.003% in the post-crisis period. On the contrary, volatility does not show any change at 105%, but does increase for four pairs including GBP/USD, which is the most volatile among the majors. We attribute this to Brexit, which adds to its volatility.
Table 5. Pre- and post-crisis analyses
Moving to the euro portfolio, we find that the spread increases by 1.5 pips, jumping from 7.78 to 9.28 from the pre-crisis to the post-crisis periods. This is a substantial increase per transaction. For some pairs, the spread doubles (e.g., EUR/NZD and EUR/JPY). The mean return per transaction shows a decline (from 0.01% to −0.02%) similar to that of the US dollar portfolio. Moreover, volatility decreases from 115% to 94% per transaction, which could reflect a fall in liquidity.
Overall, transaction costs have increased in the post-crisis period compared with the pre-crisis period. Nevertheless, there is a positive mean return per transaction for four pairs, suggesting that selection is an important determinant in the forex market. This finding is consistent with the findings of Lee and Mathur (Citation1996a), who show that the moving average rule is profitable for only two pairs (the Japanese yen with the Danish mark and Swiss franc), but not for the other European crosses.
6. Conclusion
We examine the piercing line and dark cloud cover patterns in a forex spot market. We scan 112,792 daily candles using more than one million spot quote observations to search for these patterns. We detect 1,677 trade occurrences among the 24 currency pairs over the 19-year study period. We find the profitability of TA using chart patterns. Relying on these visually based patterns generates almost 5,000 net pips after transaction costs. A trader who started with a 1,000 USD investment and used only a 10% margin could have grown this capital to 7,400 USD (642% in total, 11.12% annualized) over the 19 years. Nevertheless, the profitability of these patterns is obtained only when equipped with the right trading strategies. Having a target that equals the risk (1:1 reward/risk ratio) is unprofitable even though the number of profitable trades is similar to that of unprofitable trades. Having double and triple targets (2:1, 3:1 reward/risk ratio strategies) on the same trades leads to different positive adjusted excess total returns of 268% and 642%, respectively. The results suggest that the predictability and profitability of TA could differ. In other words, the pattern could provide a good prediction, whereas the outcome could be negative because of other conditions such as a poorly employed exit strategy and/or high transaction costs.
In addition, we find the significant impact of transaction costs on the profitability of TA. Transaction costs can explain the unprofitability of TA. The evidence presented in this paper suggests that both components of transaction costs (spread and rollover) can have a huge impact on the profitability of TA. The spread costs almost 13,000 pips, more than double that of our net pips (7.7 pips per transaction). Since we do not pay the spread directly to the broker, this is an indirect cost and a large burden on profitability. If we can recover half the spread, this would double our profit. The rollover, on the contrary, contributes positively to our trades and adds 2,780 USD to our profit (approximately 2,500 pips). This is good news for carry traders speculating on interest rate differentials.
Moreover, examining the 24 pairs, we find that 14 show profitability and 10 do not. The British pound, in particular, is the best performing currency with a 2.4% mean return per transaction, followed by the Canadian dollar (0.7%) and Japanese yen (0.4%). We associate the profitability of the pound to its high volatility. All the other currencies show disappointing results. The Swiss franc and euro are the worst performers with mean returns of −0.9% and −0.3%, respectively.
Overall, the profitability of TA cannot be linked to the inefficiency of the forex market as claimed in the literature. Rather, it is linked to the trading factors of volatility and transaction costs. In other words, TA does not necessarily contradict efficient market theory.
Additional information
Funding
Notes on contributors
Ahmed S. Alanazi
Dr. Ahmed S. Alanazi is an assistant professor of finance at the College of Business, Alfaisal University, Riyadh. He emphasized greatly on research based work and has published many articles in prominent international journals such as the Applied Economics, the Multinational Financial Management and the Risk Governance and Control: Financial Markets and Institutions. His research interests extend to cover the financial markets in the Gulf Cooperation Council, Initial Public Offerings, and Corporate Governance. Dr. Ahmed has a great knowledge and experience on the Saudi stock market, Tadawul. Currently, he is doing research with the Capital Market Authority of Saudi Arabia on the ownership structure of listed firms. Additionally he is researching the profitability of technical analysis and the Forex market. He has developed a new course, which is offered now at the CoB, Alfaisal University under the title “Financial Trading Strategies”.
Ammar S. Alanazi
Dr. Ahmed S. Alanazi is an assistant professor of finance at the College of Business, Alfaisal University, Riyadh. He emphasized greatly on research based work and has published many articles in prominent international journals such as the Applied Economics, the Multinational Financial Management and the Risk Governance and Control: Financial Markets and Institutions. His research interests extend to cover the financial markets in the Gulf Cooperation Council, Initial Public Offerings, and Corporate Governance. Dr. Ahmed has a great knowledge and experience on the Saudi stock market, Tadawul. Currently, he is doing research with the Capital Market Authority of Saudi Arabia on the ownership structure of listed firms. Additionally he is researching the profitability of technical analysis and the Forex market. He has developed a new course, which is offered now at the CoB, Alfaisal University under the title “Financial Trading Strategies”.
Notes
1. A massive body of the literature on the profitability of TA has evolved (e.g., Aroskar et al., Citation2004; Bessembinder & Chan, Citation1998; Broke et al., Citation1992; Frennberg & Hansson, Citation1993; Gencay, Citation1998; Kwon & Kish, Citation2002; Lee, Gleason et al., Citation2001; Mengoli, Citation2004; Zielonka, Citation2004).
2. Traders can participate in the forex market with as little as $100 given the advantage of the high leverage provided by most forex dealers. For a list of the 10 largest forex brokers by volume, see http://fairreporters.net/economy/largest-forex-brokers-by-volume-in-2018.
3. The spread is the difference between the bid/ask quotes paid by investors (received by brokers) to open a trade in the market and the rollover is the interest rate differentials between the two currencies paid/earned to keep the position open overnight for more than one day.
4. The quote on EUR/USD might look like (1.1210 bid) (1.1213 ask). The base currency here is the euro and the counter currency is the US dollar. The quote means you could purchase 1 euro for $1.1213 or sell 1 euro for $1.1210. The difference between the bid/ask is the spread, which is 3 pips in this case (1.1213–1.1210 = 0.0003).
5. On the day of Brexit (26 June 2016), when the British people voted to exit the European Union, the pound declined against all other currencies. It lost about 10% against the US dollar within a few seconds of the news (from 1.5018 to 1.3659). GBP/CHF shows the largest drop in one day, 2,878 pips.
6. For the yen pairs, we need to multiply the price change by 100 to convert the pips into a real number; for the other pairs, we usually multiply by 10,000.
References
- Achelis, S. B. (2001). Technical analysis from A to Z. McGraw Hill.
- Aroskar, R., Sarka, S., & Swanson, P. (2004). European foreign exchange market efficiency: Evidence based on crisis and noncrisis periods. International Review of Financial Analysis, 13(3), 333–21. https://doi.org/10.1016/j.irfa.2004.02.011
- Bessembinder, H., & Chan, K. (1998). Market efficiency and the returns to technical analysis. Financial Management, 27(2), 5–17. https://doi.org/10.2307/3666289
- Broke, W., Lakonishok, J., & LeBaron, B. (1992). Simple trading rules and the stochastic properties of stock returns. Journal of Finance, 47(5), 1731–1764. https://doi.org/10.1111/j.1540-6261.1992.tb04681.x
- Chang, P. H. K., & Osler, C. L. (1999). Methodical madness: Technical analysis and the irrationality of exchange-rate forecasts. The Economic Journal, 109(458), 636–661. https://doi.org/10.1111/1468-0297.00466
- Cheung, Y. W., & Chinn, M. D. (2001). Currency traders and exchange rate dynamics: A survey of the US market. Journal of International Money and Finance, 20(4), 439–471. https://doi.org/10.1016/S0261-5606(01)00002-X
- Cialenco, I., & Protopapadakis, A. (2011). Do technical trading profits remain in the foreign exchange market? Evidence from 14 currencies. Journal of International Financial Markets, Institutions & Money, 21(2), 176–206. https://doi.org/10.1016/j.intfin.2010.10.001
- De Long, J. B., Shleifer, A., Summers, L. H., & Waldmann, R. J. (1991). The survival of noise traders in financial markets. Journal of Business, 64(1), 1–19. https://doi.org/10.1086/296523
- Dooley, M. P., & Shafer, J. R. 1975. Analysis of short-run exchange rate behaviour: March 1973-September 1975. International Finance Discussion Papers, No. 76. Washington DC, Federal Reserve System.
- Dooley, M. P., & Shafer, J. R. (1983). Analysis of short-run exchange rate behaviour: March 1973 to November 1981. Exchange rate and trade instability. Ballinger.
- Fama, E. F. (1970). Efficient capital markets: A review of theory and empirical work. Journal of Finance, 25(2), 383–417. https://doi.org/10.2307/2325486
- Fama, E. F. (1991). Efficient capital markets: 2. Journal of Finance, 46(5), 1575–1617. https://doi.org/10.1111/j.1540-6261.1991.tb04636.x
- Fama, E. F., & Blume, M. (1966). Filter rules and stock market trading. Journal of Business, 39(S1), 226–241. https://doi.org/10.1086/294849
- Frennberg, P., & Hansson, B. (1993). Testing the random walk hypothesis on Swedish stock prices: 1919-1990. Journal of Banking and Finance, 17(1), 175–192. https://doi.org/10.1016/0378-4266(93)90087-T
- Froot, K. A., Scharfstein, D. S., & Stein, J. C. (1992). Herd on the street: Informational inefficiencies in a market with short-term speculation. Journal of Finance, 47(4), 1461–1484. https://doi.org/10.1111/j.1540-6261.1992.tb04665.x
- Gehrig, T., & Menkhoff, L. (2004). The use of flow analysis in foreign exchange: Exploratory evidence. Journal of International Money and Finance, 23(4), 573–594. https://doi.org/10.1016/j.jimonfin.2003.12.006
- Gencay, R. (1998). The predictability of security returns with simple technical trading rules. Journal of Empirical Finance, 5(4), 347–359. https://doi.org/10.1016/S0927-5398(97)00022-4
- Hsu, P., Taylor, M. P., & Wang, Z. (2016). Technical trading: Is it still beating the foreign exchange market? Journal of International Economics, 102(C), 188–208. https://doi.org/10.1016/j.jinteco.2016.03.012
- Hudson, R. S., Dempsey, M., & Keasey, K. (1996). A note on the weak form efficiency of capital markets: The application of simple technical trading rules to UK stock prices-1935 to 1994. Journal of Banking and Finance, 20(6), 1121–1132. https://doi.org/10.1016/0378-4266(95)00043-7
- Jensen, M. C. (1978). Some anomalous evidence regarding market efficiency. Journal of Financial Economics, 6(2–3), 95–101. https://doi.org/10.1016/0304-405X(78)90025-9
- Kwon, K., & Kish, R. (2002). Technical trading strategies and return predictability: NYSE. Applied Financial Economics, 12(9), 639–653. https://doi.org/10.1080/09603100010016139
- LeBaron, B. (1999). Technical trading rule profitability and foreign exchange intervention. Journal of International Economics, 49(1), 125–143. https://doi.org/10.1016/S0022-1996(98)00061-0
- Lee, C. I., Gleason, K. C., & Mathur, I. (2001). Trading rule profits in Latin American currency spot rates. International Review of Financial Analysis, 10(2), 135–156. https://doi.org/10.1016/S1057-5219(01)00042-4
- Lee, C. I., & Mathur, I. (1996a). Trading rule profits in European currency spot cross-rates. Journal of Banking and Finance, 20(5), 949–962. https://doi.org/10.1016/0378-4266(95)00037-2
- Lee, C. I., & Mathur, I. (1996b). A comprehensive look at the efficacy of technical trading rules applied to cross-rates. European Journal of Finance, 2(4), 389–411. https://doi.org/10.1080/13518479600000016
- Lee, C. I., Pan, M. S., & Liu, Y. A. (2001). On market efficiency of Asian foreign exchange rates: Evidence from a joint variance ratio test and technical trading rules. Journal of International Financial Markets, Institutions & Money, 11(2), 199–214. https://doi.org/10.1016/S1042-4431(00)00050-0
- Leigh, W., Paz, N., & Purvis, R. (2002). Market timing: A test of a charting heuristic. Economics Letters, 77(1), 55–63.
- Levich, R. M. (1989). Is the foreign exchange market efficient? Oxford Review of Economic Policy, 5(3), 40–60. https://doi.org/10.1093/oxrep/5.3.40
- Levich, R. M., & Thomas, L. R. (1993). The significance of technical trading-rule profits in the foreign exchange market: A bootstrap approach. Journal of International Money and Finance, 12(5), 451–474. https://doi.org/10.1016/0261-5606(93)90034-9
- Levy, R. A. (1971). The predictive significance of five-point chart patterns. Journal of Business, 44(3), 316–323. https://doi.org/10.1086/295382
- Lo, A., Mamaysky, H., & Wang, J. (2000). Foundations of technical analysis: Computational algorithms, statistical inference, and empirical implementation. Journal of Finance, 55(4), 1705–1765. https://doi.org/10.1111/0022-1082.00265
- Lucke, B. (2003). Are technical trading rules profitable? Evidence for head-and-shoulder rules. Applied Economics, 35(1), 33–40. https://doi.org/10.1080/00036840210150884
- Mengoli, S. (2004). On the source of contrarian and momentum strategies in the Italian equity market. International Review of Financial Analysis, 13(3), 301–331. https://doi.org/10.1016/j.irfa.2004.02.012
- Menkhoff, L. (1997). Examining the use of technical currency analysis. International Journal of Finance and Economics, 2(4), 307–318. https://doi.org/10.1002/(SICI)1099-1158(199710)2:4<307::AID-JFE54>3.0.CO;2-8
- Menkhoff, L., Sarno, L., Schmeling, M., & Schrimpf, A. (2016). Information flows in foreign exchange markets: Dissecting customer currency trades. Journal of Finance, 71(2), 601–634. https://doi.org/10.1111/jofi.12378
- Menkhoff, L., & Taylor, M. P. (2007). The obstinate passion of foreign exchange professionals: Technical analysis. Journal of Economic Literature, 45(4), 936–972. https://doi.org/10.1257/jel.45.4.936
- Neely, C., & Weller, P. (1999). Technical trading rules in the European monetary system. Journal of International Money and Finance, 22(3), 429–458. https://doi.org/10.1016/S0261-5606(99)85005-0
- Neely, C. J., Weller, P. A., & Ulrich, M. (2009). The adaptive markets hypothesis: Evidence from the foreign exchange market. Journal of Financial and Quantitative Analysis, 44(2), 467–488. https://doi.org/10.1017/S0022109009090103
- Niftci, S. N. (1991). Naïve trading rules in financial markets and Wiener-Kolmogorove prediction theory: A study of technical analysis. Journal of Business, 64(4), 549–571. https://doi.org/10.1086/296551
- Osler, C. L. (2000). Support for resistance: Technical analysis and intraday exchange rates. Economic Policy Review, 6(2), 53–68.
- Osler, C. L. (2003). Currency orders and exchange rate dynamics: An explanation for the predictive success of technical analysis. Journal of Finance, 58(5), 1791–1819. https://doi.org/10.1111/1540-6261.00588
- Osler, C. L., & Chang, P. H. K. (1995). Head and shoulders: Not just a flaky pattern. Federal Reserve Bank of New York, Staff reports 4.
- Oslon, D. (2004). Have trading rule profits in the currency markets declined over time? Journal of Banking and Finance, 28(1), 85–105. https://doi.org/10.1016/S0378-4266(02)00399-0
- Park, C., & Irwin, S. H. (2007). What do we know about the profitability of technical analysis. Journal of Economic Surveys, 21(4), 786–826. https://doi.org/10.1111/j.1467-6419.2007.00519.x
- Piccotti, L. R. (2018). Jumps, cojumps, and efficiency in the spot foreign exchange market. Journal of Banking and Finance, 87(C), 49–67. https://doi.org/10.1016/j.jbankfin.2017.09.007
- Qi, M., & Wu, Y. (2006). Technical trading-rule profitability, data snooping, and reality check: Evidence from the foreign exchange market. Journal of Money, Credit, and Banking, 38(8), 2135–2158. https://doi.org/10.1353/mcb.2007.0006
- Smidt, S. (1965b). Amateur Speculators. Graduate School of Business and Public Administration, Cornell University.
- SWEENEY, R. J. (1986). Beating the foreign exchange market. The Journal of Finance, 41(1), 163–182. https://doi.org/10.1111/j.1540-6261.1986.tb04497.x
- Sweeny, R. J. (1988). Some new filter rule tests: Methods and results. Journal of Financial and Quantitative Analysis, 23(3), 285–300. https://doi.org/10.2307/2331068
- Tversky, A., & Kahneman, D. (1974). Judgment under uncertainty: Heuristics and biases. Science, 185(4157), 1124–1131. https://doi.org/10.1126/science.185.4157.1124
- Zhu, Y., & Zhou, G. (2009). Technical analysis: An asset allocation perspective on the use of moving averages. Journal of Financial Economics, 92(3), 519–544. https://doi.org/10.1016/j.jfineco.2008.07.002
- Zielonka, P. (2004). Technical analysis as the representation of typical cognitive biases. International Review of Financial Analysis, 13(2), 217–225. https://doi.org/10.1016/j.irfa.2004.02.007