
 ?Mathematical formulae have been encoded as MathML and are displayed in this HTML version using MathJax in order to improve their display. Uncheck the box to turn MathJax off. This feature requires Javascript. Click on a formula to zoom.
Abstract
The purpose of this study is to examine the weak-form market efficiency hypothesis (EMH) for 8 African Frontier markets between 2001 and 2017. To achieve this purpose, we employ unit root testing procedures which are robust to both nonlinearities and smooth structural breaks, making this study the first of its kind for African markets. Our empirical findings suggest that, regardless of whether daily or weekly series are employed, most African frontier markets are not market efficient, in the weak sense form, with the exception of the Kenyan stock market and to a very much lesser extent the Botswana and South African stock series. Important policy and investor implications are drawn in our study.
PUBLIC INTEREST STATEMENT
The paper examines whether participants of the stock markets in Africa’s top 8 stock exchange markets (South Africa, Botswana, Mauritius, Kenya, Nigeria, Tunisia, Egypt and Morocco) are information efficient. In other, we investigate whether it possible for stock market participants to use previous information on share returns to predict future stream of returns as a means of gaining abnormal profits. We use the Random Walk model to as our methodology to conduct our empirical analysis and in differing from previous studies, our specification of the random walks is robust to asymmetries and structural breaks, which could otherwise influence the empirical results. We find that, with the exception of Kenyan stock market, the rest of African markets can beat by market participants by using historic information. We discuss the policy implications of our findings.
1. Introduction
Following the seminal influences of Harrod (Citation1939) and Domar (Citation1946) and the subsequent contributions of Solow (Citation1965), Swan (Citation1965), and Lucas (Citation1988), the evolution of an economy’s capital stock has been unanimously considered as the engine of dynamic economic growth and development. In more modern times, capital markets can be viewed as markets in which the ownership of an economy’s capital stock is distributed amongst a variety of competitive yet rationale market participants. Economic Nobel laureates Samuelson (Citation1965) and Fama (Citation1965) were amongst the first to recognize that the trajectory of returns on security prices can provide simple yet powerful inferences on the efficiency of capital markets considering the rationale behaviour of market participants. The Fama-Samuelson synthesis particularly argues that the independence of a sequence of changes in security prices implies that equilibrium conditions of production-investment decisions within capital markets satisfy a ‘fair game” model in which speculative behaviour does not yield any predictable gains. In academic jargon, this phenomenon is more popularly branded as the efficient market hypothesis and has since its inception undergone severe criticism concerning its validity.
Even though the EMH has secured a considerable amount of empirical support within the academic literature, more particularly for advanced Western economies (see Titan (Citation2015)) for an exhaustive review of the international literature), practitioners and other observers have nevertheless questioned the validity of the theory considering the number of re-occurring stock market crashes which have translated into larger, and in more severe cases, global financial crisis that have threatened the very essence of global economic stability. Ball (Citation2009) notes that investors and financial regulators worldwide have been unable to predict several historic financial crises which have commonly emulated from the bursting of asset bubbles because they religiously believed in the EMH and its implication of self-correcting behaviour of capital markets. Initially, Keynes (Citation1936) contended that investors in equity markets had “animal spirits” and the stock market participants had characteristics of a “beauty contest”, in that the actions of many rational but short-horizon investors are similarly governed by their expectations about what other investors believe, rather than their genuine expectations about the true value of a firm (Gao, Citation2008). Later on, Grossman and Stiglitz (Citation1980) cast some doubt on the EMH due to information asymmetry in which equilibrium in markets can only occur if there is no information existing within the markets. In particularly, the authors argue that in the existence of information and the costs of obtaining it “ … prices cannot perfectly reflect the information which is available, since if it did then, those who spend resources to get it would receive no compensation … ” (Grossman & Stiglitz, Citation1980). And even more recently there has emerged a new breed of economists who have emphasized on the psychological and behavioural elements of stock-price determination and strongly believed that stock prices must be at least partially predictable on the basis of past price behaviour as well as other certain valuation metrics (Malkiel, Citation2003 and Shiller, Citation2014).
From an empirical standpoint, the disputes over the validity of the market efficiency hypothesis, which in their weak-form are primarily based on unit root testing procedures are no less conclusive. Torous et al. (Citation2004) argue that by their very construction, conventional unit root tests such as the Dickey-Fuller (ADF) and PP tests have low power to reject the null hypothesis of a unit root when the underlying data generated according to the local-to-unity specification. Pierre (Citation1989) as well as Zivot and Andrews (Citation1992) demonstrate that these tests further exhibit low testing power in the presence of structural breaks in the data caused by severe structural changes such as the 1970 oil crisis. Moreover, Kapetanois et al. (Citation2003) further show that conventional unit root tests have low testing power in distinguishing between unit root and nonlinear, stationary processes. More recently, Becker et al. (Citation2006) as well as Enders and Lee (Citation2012) demonstrate that both nonlinearities and smooth structural breaks can be efficiently captured within unit root testing frameworks by augmenting these test with a flexible Fourier approximation. The authors demonstrate that FFF-based unit root test outperform “conventional” and other “nonlinear” unit root testing procedures in distinguishing between stationary and non-stationary time series processes.
In our study we focus the EMH on the Africa continent which has recorded impressive economic growth in the twenty-first century and is yet characterized by weak financial links with the rest of the world and low degrees of financialization (Rodrik, Citation2016). Although there has been some notable progress in terms of the number of securities exchange platforms, Africa’s equity markets are plagued by low investor confidence, low liquidity, thin trading, high trading costs and price limits, all which compromise the efficiency of these stock exchanges. Less than 40 percent of the countries in Africa have stock exchanges which are functioning across the continent and there exists 8 major stock exchanges which account for over 95 percent of all trading activity on the continent (i.e. the Nairobi Securities Exchange, the Nigerian Stock Exchange, the Botswana Stock Exchange, the Zimbabwe Stock Exchange, the Johannesburg Stock Exchange, the Egyptian Exchange, the Casablanca Stock Exchange and the Tunis Stock Exchange) (Yartey & Adjasi, Citation2007). Incidentally, most existing empirical studies on the EMH in African countries focus on or include these 8 frontier markets and the low variety of countries in the African literature reflects the lack of accessibility to data as opposed to lack of academic effort. A summary of the country-specific and panel based-studies for the previous literature for African markets are presented in Tables and , respectively, and these studies are inconsistent with each other due to “weak” testing procedures, the use of different time samples and data frequencies.
Table 1. Summary of literature review for the individual-based studies
Table 2. Summary of literature review for the panel-based studies
In our study, we re-examine the weak-form EMH for 8 African countries using the nonlinear testing procedure of Kapetanois et al. (Citation2003) augmented with a Flexible Fourier Form (FFF) function described in Enders and Lee (Citation2012) and in doing so we make three contributions to the literature. Firstly, previous studies have failed to take into consideration the possibility of existing asymmetries in the empirical data for African stock exchanges. As argued by Lee (2011), this is important for developing countries which characterized by market imperfections such as high-levels of information asymmetries and market frictions, all which are reflected in asymmetric data generating processes of stock returns. Secondly, previous African studies employ data which covers important structural breaks such as the Asian financial crisis of (1998–2000) as well as the more recent global financial crisis (2007–2009) and yet these structural breaks have not been accounted for these empirical studies. Besides, these major structural breaks in the data, other forms of structural breaks such as adoption of new trading platforms and other technological structures could lead to other “smooth” structural breaks. Our employed FFF-based unit root testing procedures can capture these and other unobserved structural breaks existing in the data. Lastly, rather than concentrating on one frequency of series, our empirical analysis is performed on two frequencies of data i.e. daily and weekly series. As argued by Huang and Jo (Citation1995) and Caporale et al. (Citation2019), the efficiency of stock markets is contingent on the frequency of the trading systems employ by various market participants such that abnormal returns can be gained using certain return intervals for asset prices.
Against this background, we structure the remainder of the paper as follows. Section 2 of the paper presents our empirical framework. Section 3 presents the empirical data and the results. The paper is concluded in section 4.
2. Empirical framework
2.1. Theoretical foundations
At the theoretical nucleus of the EMH lies the expected return or “fair game” model as expounded in Eugene (Citation1970) who mathematically constructed his theory based on the following model function:
From EquationEquation (1)(1)
(1) E is an expectations operator, pj,t is the share price at t whereas pj,t+1 is the next period share at t + 1, srj,t+1 is the one-period percentage return computed as (pj,t+1—pj,t)/pj,t. and Ωt is the general information set which is assumed to be fully reflected in the share price at time t. Under the “fair game” model, any possibility of investors expecting profits or returns in excess of equilibrium are ruled out such that the following condition is satisfied:
Where xj,t+1 denotes the excess market value of the share at t + 1 such that E(xj,t+1|Ωt) = pj,t+1—E(pj,t+1|Ωt). Equivalently EquationEquation (2)(2)
(2) can be re-formulated in terms of returns such that:
Where rj,t+1 denotes the excess market returns at t + 1 such that E(rj,t+1|Ωt) = rj,t+1—E(rj,t+1|Ωt). Conditions (2) and (3) imply that share prices and their returns present a “fair game” to investors. Nevertheless, the “fair game” model states that the conditions of market equilibrium can be stated in terms of expected returns and yet says nothing concerning the details of the stochastic process of the time series. Eugene (Citation1970, Citation1971)) propose that the following random walk model to capture the stochastic properties of stock returns:
In which the density function, f, is identical for all t. In further assuming that the expected return on the stock price is constant over time, then:
And from EquationEquation (5)(5)
(5) , the mean of the distribution of rj,t+1 is now independent of information set Ωt, available at time t, hence reflecting the weak-form of market efficiency in which market participants cannot use past price or return patterns to make abnormal profits.
2.2. Econometric modelling
Another way of expressing the random walk model of stock returns as in EquationEquation (5)(5)
(5) , would be to specify it as the following autoregressive (AR) specification as suggested by Dickey and Fuller (Citation1979):
From EquationEquation (6)(6)
(6) , the stock returns series, srt, is consider mean-reverting such that it confirms to the weak-form EMH holds only if ρ < 1 whereas if ρ = 1, then the series evolves as a random walk with a variance which grows exponentially as t →∞. A more generalized form of regression (6) is the following Augmented Dickey Fuller (ADF) regression:
Where Δ denotes a first difference operator and is a truncated lag which absorbs up any
excess serial correlation in the test regression. The DF test statistic used to test the unit root null hypothesis (i.e. H0: βi = 0) against the stationarity alternative (i.e. H1: βi < 0) is the t-ratio of the βi coefficient i.e.
Where M = IT—τT(τ’T, τT)−1τ’T and σ2 = ΔyiMxiΔyi/(T-1). As previously mentioned, conventional unit root tests like the ADF test fail to distinguish between nonlinearity and unit root processes within time series. As an alternative, Kapetanois et al. (Citation2003) extend upon the convention Dickey Fuller testing regression found in regressions (8)—(9), into an exponential smooth transition autoregressive (ESTAR) model. In following their practice, the ESTAR model of stock returns can be specified as:
Under the null hypothesis, the stock returns series follows a unit root process (i.e. H0: Φ = 0) whilst the alternative hypothesis is that the time series evolves as a stationary ESTAR model. Since the direct testing of the null hypothesis is not feasible due to the presence of nuisance parameters under the null hypothesis, then Kapetanois et al. (Citation2003) re-parameterize EquationEquation (11)(11)
(11) using a first order Taylor series approximation. From the resulting auxiliary nonlinear unit root testing regression:
The null hypothesis of a linear unit root process can be now tested as H0: δi = 0 against the alternative of stationary ESTAR process (i.e. H1: δi = 0). In similarity to the conventional ADF test, the asymptotic critical value of the Kapetanois et al. (Citation2003)Critical values are derived unit root test is computed as:
Since the tKSS statistic does not follow an asymptotic standard normal distribution, Kapetanois et al. (Citation2003) derive critical values for the test statistics for the test performed on raw time series, de-meaned data (i.e. zt = xt—) and de-trended data (i.e. zt = xt—
—
) where
is the sample mean and
and
are the OLS estimates of μ and δ, respectively. One major shortcoming with the KSS unit root test is its inability to directly account for structural breaks in the regression. Of recent, there has been a growing consensus that a flexible Fourier form (FFF) approximation of unit root tests has good size and power properties in detecting a series of unknown smooth structural breaks (see Enders and Lee (Citation2012) and Rodrigues and Taylor (Citation2012)). Therefore, in augmenting the KSS unit root test using a single frequency Fourier function, the testing regression can be specified as:
Where K is the singular approximated frequency selected for the approximation, whilst coefficients a and b measure the amplitude and displacement of the sinusoidal. Enders and Lee (Citation2012) place emphasis on estimating a Fourier function with a singular frequency to avoid problems of over-fitting and loss of regression power. Moreover, Enders and Lee (Citation2012) propose that regression (12) be estimated for all integer values of K which lie between the interval [1, 5] and selecting the estimation which produces the lowest sum of squared residuals (SSR).
3. Data and empirical findings
3.1. Empirical data
Our time series variables have been sourced from Thomson Reuters Datastrem and consists of closing prices of stock returns for Nairobi Securities Exchange of Kenya, the Nigerian Stock Exchange of Nigeria, Botswana Stock Exchange of Botswana, Zimbabwe Stock Exchange of Zimbabwe, Johannesburg Stock Exchange of South Africa, Egyptian Exchange of Egypt, Casablanca Stock Exchange of Morocco, the Tunis Stock Exchange of Tunisia. Note that all series cover a period of 2001 to 2017 except for the Kenyan series begins in 2006 and ends in 2017. To ensure rigour in our empirical analysis, we employ two set of empirical time series (daily and weekly series). Since our empirical analysis requires the use of stock market returns, the transformation of the share prices (pt) into returns (srt) can be achieved:
And in further transforming the equation (#) in logarithmic form, and noting that log (1) = 0, results in the following compounded series of stock returns:
After transforming the time series using EquationEquation (14)(14)
(14) , which becomes our officially empirical data, we provide the summary statistics for the series in Table , with Panel A showing the statistics for daily series and Panel B for the weekly series. For both daily and weekly series, Tunisia, South Africa, Kenya, Botswana and Egypt have positive return averages whereas those for Mauritius, Morocco and Nigeria are negative. Apart from Mauritius, Morocco and Nigeria, the average returns in weekly series are higher than those for daily series whereas for all exchanges the standard deviation (risk) for weekly series are higher than those for daily series. The time series for the daily and weekly series as found in Figures and , respectively.
Figure 1. Stock returns for Frontier markets in Africa (Daily series).
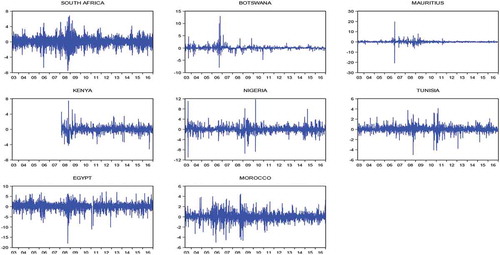
Figure 2. Stock returns for Frontier markets in Africa (Weekly series).
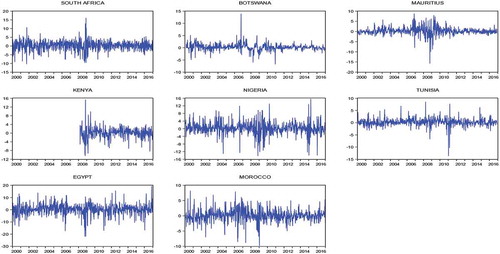
Table 3. Descriptive statistics of time series
3.2. Conventional unit root test results
Table presents the results from the three most commonly used conventional unit root tests (ADF, PP and KPSS). All tests are performed with a drift as well as with a drift and trend with the optimal lag length of the tests being determined by a minimization of the Schwartz criterion. Panel A presents the results for the daily series whilst Panel B reports the results for the weekly series. In both panels both ADF and PP tests manage to reject the unit root null hypothesis for all African countries at all levels of significance regardless of whether the tests are performed with a drift or with both a drift and trend hence providing evidence against the weak-form EMH. These results are similar to those previous obtained in Fowdar et al. (Citation2007), Sunde and Zivanomoyo (Citation2008), Lee et al. (Citation2010), Nwosa and Oseni (Citation2011), Chiwira and Muyambiri (Citation2012), Ogege and Mojekwu (Citation2013), Nwosu et al. (Citation2013), Nwidobie (Citation2014), Yadirichukwu and Ogochukwu (Citation2014), Balparda et al. (Citation2015), Njuguna (Citation2016), and Adigwe et al. (Citation2017). We also note that these results are contrary to those found in Kawakatsu and Morey (Citation1999), Enowbi et al. (Citation2010), Kamau (Citation2013), Grater and Struweg (Citation2015), Kitso and Ummersingh (Citation2015), and Sule et al. (Citation2015) as well as Fusthane and Kapingura (Citation2017). However, when the KPSS test is applied, we observe discrepancies in the results. For instance, when the KPSS test is performed on the daily series, only South Africa and Botswana, unanimously fail to reject the stationarity null hypothesis regardless of whether the test is performed with a drift or with a drift and trend. These latter results are comparable to those found in Lagoarde-Segot and Lucey (Citation2008), Balparda et al. (Citation2015), and Enowbi et al. (Citation2010).
Table 4. Conventional unit root test results
In recognition of these conventional tests being often criticized for having weak power in distinguishing between unit roots and stationarity properties in time series, we further apply the DF-GLS test of Elliott et al. (Citation1996) as well as the MZA, MZB, MSB and MPT tests of Ng and Perron (1996, Citation2001) (N-G hereafter) to our empirical series. Table reports the results of these tests performed with a drift as well as with and drift and trend. Following intuition provided by Ng and Perron (Citation2001), we apply the modified AIC to more efficiently select the optimal lag length of the tests. As can be observed from the test results from the daily series reported in Panel A of Table , all test statistics reject the unit root null hypothesis at all critical levels for both DF-GLS and N-P tests, with the exception of the South African series in which the unit root null cannot be rejected for all N-P statistics regardless of whether the test is performed with a drift or a drift and trend. Conversely, the results of the N-G tests for weekly series reported in Panel B fail to reject the random walk hypothesis in all cases for the South African, Kenyan and Tunisian stock markets whilst failing to provide support for the weak-form EMH in the remaining stock exchanges. However, we notice discrepancies between the findings for DF-GLS and N-G test, hence leaving our investigation still open for further deliberation.
Table 5. Modified unit root test results
3.3. KSS-FFF test results
Before presenting the results for the KSS tests performed with a FFF, Table firstly reports the findings of the KSS test performed without a FFF for “control” purposes with Panel A reporting the results for the daily series and Panel B for the weekly series. The results from both the daily series and weekly series produce test statistics which reject the random walk hypothesis with the exception of the daily series for the Nairobi Stock Exchange (Kenya) and weekly series for the Botswana Stock Exchange using the de-trended series. In turning to our main empirical results reported in Table , we find that the statistics for the KSS augmented with a Fourier approximation are not different from that of the KSS performed without the Fourier term, in which random walks are found in the daily series for the Kenyan market and weekly, de-trended series for Botswana’s stock exchange. Altogether our results consistently find that both daily and weekly frequency series can be used to predict equity returns in most African markets except for daily trading frequencies in Kenyan markets and weekly frequencies in Botswana markets.
Table 6. KSS unit root tests without FFF
Table 7. KSS test with FFF
There are a couple of possible reasons for our observed evidence of information efficiency for stock exchanges in Kenya and Botswana. Firstly, both equity markets are shallower and less sophisticated stock exchanges in comparison to the other frontier exchanges. Secondly, both exchanges are illiquid in which stock trade volumes and information sharing activities are kept at a minimal. Thirdly, and particularly for the Kenyan market, the NSE is infamously known for running the most expensive stock markets on the continent in terms transaction costs and other charges, which further contributes to low trade activity, few numbers of stock traders Altogether, market efficiency uncovered for stock exchanges in Kenya and Botswana is ultimately attributed to low information seeking activities by investor participation in these markets as opposed to strong institutional qualities of these exchanges.
4. Conclusions
Concerned with whether African capital markets are efficient, in the weak-form sense, our study applied a nonlinear unit root test augmented with a FFF to 8 African frontier markets (South Africa, Botswana, Mauritius, Kenya, Nigeria, Tunisia, Egypt and Morocco) which collectively account for over 95 percent of total market activity in the content. To ensure robustness of our empirical analysis we employ two set of time series data, one daily and the other weekly which covers a period of 2003 to 2017, with the exception of the data for the Nairobi Stock Exchange in which the data only begins in 2006. Prior to our main empirical estimation, we conduct conventional unit root testing procedures (i.e. ADF, PP and KPSS tests) on each of the series, of which the ADF and PP tests provide support against the weak-form EMH whilst the findings from the KPSS tests are inconclusive. In then applying the second-generation unit root tests of Elliott et al. (Citation1996) and Ng and Perron (Citation1995, Citation2001)), we find that most series do not conform to the weak-form EMH with the sole exception of South Africa. In finally applying the more definitive KSS tests augmented with a FFF, we find that of all observed countries, it is stock exchanges in Kenya and Botswana which provide evidence of weak-form EMH, a finding which we attribute to lack of participation in market activity in these exchanges.
Given the overriding the evidence against the weak-form market efficiency existing in African frontier markets, our results support the notion that market participants can devise strategies using different frequencies of data to “beat the market” and to obtain abnormal returns on investments. These are important findings since international investors have been diversifying their funding away from developed markets into emerging markets whilst African exchanges remain vulnerable towards speculation activity due to their thin trading margins. Also considering the rapid rise in sophistication of trading platforms adopted by many African stock over the last decades, weak regulatory frameworks will fail to protect shareholders investments hence making these exchanges less attractive to low-risk investors who will rather channel their funds to other emerging market exchanges. As a way forward, we put forward two suggestions for policymakers in African countries. Firstly, individual countries can focus on building stronger regulatory and institutional frameworks aimed at reducing informational asymmetries, promoting transparency and reducing inefficiency within stock exchanges. Secondly, African markets need to collectively consider integrating their stock exchanges to increase the depth and liquidity of their exchanges. This is important for attracting portfolio investment into the continent and ultimately promoting economic development in Africa.
Additional information
Funding
Notes on contributors
Andrew Phiri
David de Vilers is a post-graduate student at the Department of Economics at the Nelson Mandela University, South Africa. He is the main author of this manuscript which is part of his graduate research. His academic interests are monetary economics, financial econometrics and applied econometrics.
Natalya Apopo is a post-graduate student at the Department of Economics at the Nelson Mandela University, South Africa. She is the co-author of this manuscript which forms part of her graduate research. Her academic interests are financial economics and applied econometrics.
Andrew Phiri, who is the corresponding author to this manuscript, is an associate professor with the Department of Economics at the Nelson Mandela University, South Africa who enjoys a wide range of publications in international journals with a research interests mainly in macroeconomics, applied econometrics and financial economics.
References
- Adigwe, P. K., Ugbomhe, U., & Alajekwu, U. (2017). Test of weak form stock market efficiency in selected African stock markets (2013–2015). Saudi Journal of Business and Management Sciences, 2(2), 60–16. Doi: 10.21276/sjbms.2017.2.2.1
- Alam, M., & Uddin, G. (2009). Relationship between interest rate and stock price: Empirical Evidence from developed and developing countries. International Journal of Business and Management, 4(3), 43–51. URL: http://www.ccsenet.org/journal/index.php/ijbm/article/download/217/177
- Ball, R. (2009). The global financial crisis and the efficient market hypothesis: What have we learned. Journal of Applied Corporate Finance, 21(4), 8–16. https://doi.org/10.1111/j.1745-6622.2009.00246.x
- Balparda, B., Caporale, G. M., & Gil-Alana, L. A. (2015). The kenyan stock market: Inefficiency, long memory, persistence and anomalies in the NSE-20. African Journal of Economic and Sustainable Development, 4(3), 254–277. https://doi.org/10.1504/AJESD.2015.071911
- Becker, R., Enders, W., & Lee, J. (2006). A stationarity test in the presence of an unknown number of smooth breaks. Journal of Time Series Analysis, 27(3), 381–409. https://doi.org/10.1111/j.1467-9892.2006.00478.x
- Caporale, G. M., Gil-Alana, L., & Plastun, A. (2019). Long memory and data frequency in financial markets. Journal of Statistical Computation and Simulation, 89(10), 1763–1779. https://doi.org/10.1080/00949655.2019.1599377
- Chiwira, O., & Muyambiri, B. (2012). A test of weak form efficiency for the botswana stock exchange (2004–2008). British Journal of Economics, Management and Trade, 2(2), 83–91. https://doi.org/10.9734/BJEMT/2012/1071
- Dickey, D. A., & Fuller, W. A. (1979). Distribution of the estimators for autoregressive time series with a unit root. Econometrica, 74(366a), 427–431. DOI: 10.2307/2286348
- Domar, E. D. (1946). Capital expansion, rate of growth and employment. Econometrica, 14(2), 137–147. https://doi.org/10.2307/1905364
- Elliott, G., & Stock, J. H. (2001). Confidence intervals for autoregressive coefficients near one. Journal of Econometrics, 103(1–2), 155–181. https://doi.org/10.1016/S0304-4076(01)00042-2
- Elliott, G., Rothenberg, T., & Stock, J. (1996). Efficient tests for autoregressive unit root. Econometrica, 64(4), 813–836. https://doi.org/10.2307/2171846
- Enders, W., & Lee, J. (2012). A unit root test using a Fourier series to approximate smooth breaks. Oxford Bulletin of Economics and Statistics, 74(4), 574–599. https://doi.org/10.1111/j.1468-0084.2011.00662.x
- Enowbi, M., Guidi, F., & Mlambo, K. (2010). Testing the weak-form efficiency and the day of the week effect of some African countries. African Finance Journal, 1( special issue), 1–26. https://hdl.handle.net/10520/EJC33729
- Eugene, F. (1970). Efficient capital markets: A review of theory and empirical work. The Journal of Finance, 25(2), 383–417. DOI: 10.2307/2325486
- Eugene, F. (1971). Efficient capital markets II. The Journal of Finance, 46(5), 1575–1617. DOI: 10.2307/2328565
- Fama, E. (1965). The behaviour of stock-market prices. The Journal of Business, 38(1), 34–105. https://doi.org/10.1086/294743
- Fowdar, S., Subadar, U. A., Lamport, M. J., Sannassee, R. V., & Fawzee, M. (2007). Assessing the level of efficiency of the stock exchange of mauritius. University of Mauritius Research Journal – Special Issue, 13(A), 90–102. https://www.ajol.info/index.php/umrj/article/view/130903
- Frédéric, B., Salem, M. B. S., & Carrasco, M. (2004). Tests for unit roots versus threshold specification with an application to the purchasing power parity relationship. Journal of Business and Economic Studies, 22(4), 382–395. https://doi.org/10.1198/073500104000000389
- Fusthane, O., & Kapingura, F. M. (2017). Weak form market efficiency of the johannesburg stock exchange: pre, during and post the 2008 global financial crisis. Journal of Economics and Behavoiral Studies, 9(5), 29–42. https://doi.org/10.22610/jebs.v9i5(J).1907
- Gao, P. (2008). Keynesian beauty contest, accounting disclosure, and market efficiency. Journal of Accounting Research, 46(4), 785–807. https://doi.org/10.1111/j.1475-679X.2008.00295.x
- Grater, E., & Struweg, J. (2015). Testing the weak form efficiency in the South African market. Journal of Economic and Financial Sciences, 8(2), 621–632. https://doi.org/10.4102/jef.v8i2.112
- Grossman, S., & Stiglitz, J. (1980). On the impossibility of informationally efficient markets. American Economic Review, 70(3), 393–408. https://www.jstor.org/stable/1805228
- Harrod, R. F. (1939). An essay in dynamic theory. The Economic Journal, 49(193), 14–33. https://doi.org/10.2307/2225181
- Huang, R., & Jo, H. (1995). Data frequency and the number of factors in stock returns. Journal of Banking and Finance, 19(6), 987–1003. https://doi.org/10.1016/0378-4266(94)00066-C
- Kamau, A. M. (2013). An empirical analysis of the weak form efficient market hypothesis of the nairobi securities exchange. Kenya College of Accountancy. Master of Commerce.
- Kapetanois, G., Shin, Y., & Snell, A. (2003). Testing for unit root in the nonlinear STAR framework. Journal of Econometrics, 112(2), 359–379. https://doi.org/10.1016/S0304-4076(02)00202-6
- Kawakatsu, H., & Morey, M. (1999). An empirical examination of financial liberalization and the efficiency of emerging market stock prices. The Journal of Financial Research, 22(4), 385–411. https://doi.org/10.1111/j.1475-6803.1999.tb00702.x
- Keynes, J. M. 1936. The general theory of money, interest and employment. Reprinted in The Collected Writings of John Maynard Keynes 7. MacMillan Ltd.
- Kitso, M., & Ummersingh, S. (2015). Efficiency of the Foreign Exchange Market in Mauritius. Research Journal of Science and IT Management, 4(7), 47–53. https://pdfs.semanticscholar.org/52ae/2e0163884d35142626ef0cc92d7c280c3e13.pdf?_ga=2.35443945.951347746.1589804247-1763149620.1587217624
- Lagoarde-Segot, T., & Lucey, B. M. (2008). Efficiency in emerging markets – Evidence from the MENA region. International Financial Markets, Institutions and Money, 18(1), 94–105. https://doi.org/10.1016/j.intfin.2006.06.003
- Lee, C. C.., Lee, J.-D., & Lee, C.-C. (2010). Stock prices and the efficient market hypothesis: Evidence from a panel stationary test with structural breaks. Japan and the World Economy, 22(1), 49–58. https://doi.org/10.1016/j.japwor.2009.04.002
- Lucas, R. E. (1988). On the mechanics of economic development. Journal of Monetary Economics, 22(1), 3–42. https://doi.org/10.1016/0304-3932(88)90168-7
- Malkiel, B. G. (2003). The efficient market hypothesis and its critics. Journal of Economic Perspectives, 17(1), 59–82. https://doi.org/10.1257/089533003321164958
- Ng, S., & Perron, P. (1995). Unit root tests in ARMA models with data-dependent methods for the selection of the truncation lag. Journal of the American Statistical Association, 90(429), 268–281. https://doi.org/10.1080/01621459.1995.10476510
- Ng, S., & Perron, P. (2001). Lag length selection and the construction of unit root tests and good size and power. Econometrica, 69(6), 1519–1554. https://doi.org/10.1111/1468-0262.00256
- Njuguna, J. (2016). Testing the efficient market hypothesis on the nairobi securities exchange. Investment Management and Financial Innovations, 13(3), 75–83. https://doi.org/10.21511/imfi.13(3).2016.06
- Nwidobie, B. M. (2014). The random walk theory: An empirical test in the Nigerian capital market. Asian Economic and Financial Review, 4(12), 1840–1848. http://www.aessweb.com/pdf-files/aefr-2014-4(12)-1840-1848.pdf
- Nwosa, P., & Oseni, I. (2011). Efficient market hypothesis and Nigerian stock market. Research Journal of Finance and Accounting, 2(12), 38–46. https://www.jstor.org/stable/23026297
- Nwosu, E. O., Orji, A., & Anagwu, O. (2013). African emerging equity markets re‐examined: Testing the weak form efficiency theory. African Development Review, 25(4), 485–498. https://doi.org/10.1111/1467-8268.12044
- Obayagbona, J., & Igbinosa, S. O. (2014). Test of random walk hypothesis in the Nigerian stock market. Current Research Journal of Social Sciences, 7(2), 27–36. DOI: 10.21013/jmss.v6.n3.p15
- Ogege, S., & Mojekwu, J. N. (2013). Econometric Investigation of the random walk hypothesis in the Nigerian stock market. Journal of Emerging Issues in Economics, Finance, and Banking, 1(5), 381–400. http://globalbizresearch.org/economics/images/files/65396_JEIEFB_Samson%20Ogege%20&%20Dr.%20J.%20N.%20Mojekwu.pdf
- Phiri, A. (2015). Efficient market hypothesis in south africa: evidence from linear and nonlinear unit root tests. Managing Global Transitions, 13(4), 369–387. http://www.fm-kp.si/zalozba/ISSN/1581-6311/13_369-387.pdf
- Pierre, P. (1989). The great crash, the oil price shock, and the unit root hypothesis. Econometrica, 57(6), 1361–1401. https://doi.org/10.2307/1913712
- Rodrik, D. (2016). An African growth miracle? Journal of African Economies, 27(1), 10–27. DOI: 10.1093/jae/ejw027
- Rodrigues, P. M., & Taylor, R. A. (2012). The flexible fourier form and local generalised least squares de‐trended unit root tests. Oxford Bulletin of Economics and Statistics, 74(5), 736–759. https://doi.org/10.1111/j.1468-0084.2011.00665.x
- Samuelson, P. A. (1965). Proof that properly anticipated prices fluctuate randomly. Industrial Management Review, 6, 41–49. DOI: 10.1142/9789814566926_0002
- Shiller, R. J. (2014, February). Speculative asset prices (Nobel prize lecture). Cowles Foundation Discussion Paper No. 1936.
- Solow, R. M. (1965). A contribution to the theory of economic growth. The Quarterly Journal of Economics, 70(1), 65–94. https://doi.org/10.2307/1884513
- Sule, M., Abubakar, I. D., & Tahir, M. (2015). The efficacy of random walk hypothesis in the Nigerian stock exchange market. European Journal of Business and Management, 7(25), 68–78.DOI: 10.21013/jmss.v6.n3.p15
- Sunde, T., & Zivanomoyo, J. (2008). The random walk hypothesis for the Zimbabwe stock exchange: January 1998-November 2006. Journal of Social Sciences, 4(3), 216–221. https://doi.org/10.3844/jssp.2008.216.221
- Swan, T. W. (1965). Economic growth and capital accumulation. The Economic Record, 32(2), 334–361. https://doi.org/10.1111/j.1475-4932.1956.tb00434.x
- Titan, A. G. (2015). The efficient market hypothesis: Review of specialized literature and empirical research. Procedia Economics and Finance, 32, 442–449. https://doi.org/10.1016/S2212-5671(15)01416-1
- Torous, W., Valkanov, R., & Yan, S. (2004). On predicting stock returns with newly integrated explanatory variables. Journal of Business, 77(4), 937–966. https://doi.org/10.1086/422634
- Walter, E., & Granger, C. (1998). Unit root tests and asymmetric adjustment using the term structure of interest rates. Journal of Business and Economic Statistics, 16(3), 304–311. DOI: 10.2307/1392506
- Yadirichukwu, E., & Ogochukwu, O. J. (2014). Evaluation of the weak-form of efficient market hypothesis: Empirical evidence from Nigeria. International Journal of Development and Sustainability, 3(5), 1199–1244. https://isdsnet.com/ijds-v3n5-20.pdf
- Yartey, C. A., & Adjasi, C. K. (2007, August). Stock market development in sub-Saharan Africa: Critical issues and challenges. IMF Working Paper No. 07-209.
- Zivot, E., & Andrews, D. W. (1992). Further evidence on the Great Crash, the oil-price shock, and the unit-root hypothesis. Journal of Business and Economic Statistics, 10(3), 251–270.DOI: 10.2307/1391541