
 ?Mathematical formulae have been encoded as MathML and are displayed in this HTML version using MathJax in order to improve their display. Uncheck the box to turn MathJax off. This feature requires Javascript. Click on a formula to zoom.
Abstract
In this paper, we explore the dynamic relationship between aggregate foreign equity inflows and aggregate liquidity of the Kenyan stock market using transactional foreign trading data and several liquidity measures. We employ vector autoregression with monthly gross foreign inflows, local stock market liquidity and returns over the period 2011–2018. We discover a one-way causality link from inflows to liquidity and that foreign investors promote rather than impede local liquidity. Our analysis therefore renders support to the recent policy by Capital Market Authority of Kenya that now allows foreign investors to acquire up to 100% of any stock listed at the Kenyan stock exchange market.
PUBLIC INTEREST STATEMENT
Stock market liquidity (which is the ease with which an individual can sell/buy a stock as and when needed) is vital if the market is to effectively perform its intermediary role. In Kenya, this liquidity is low and discontinuous thus reducing its efficacy. In view of this, there is often considerable interest as to what drives liquidity? In this paper, we examine whether foreign equity flows promote or impede stock liquidity in Kenya. Our research findings indicate that increased flows promote rather than constrain local stock liquidity. Particularly, we find that changes in foreign equity inflows explain up to 30% variations in local stock liquidity. This finding renders support to a recent policy by the Capital Markets Authority of Kenya that lifted a ceiling of foreign shareholding from 75% to 100%. In a nutshell, foreign inflows appear quite beneficial from a liquidity perspective and should therefore be encouraged.
1. Introduction
Market liquidityFootnote1 is a fundamental ingredient of a well-functioning capital market (Verrier, Citation2010). Particularly, market liquidity has important implications for corporate governance, asset pricing and efficiency, firm capital structure, and ultimately for economic growth. On corporate governance, liquidity is often viewed as a device to solve the agency problem (see, for example, Admati & Pfleiderer, Citation2009; Edmans, Citation2009, Citation2014; Edmans & Manso, Citation2011). The intuition here is that, if managers (who are the agents of shareholders) fail to make value-maximizing decisions, large (and informed) investors can sell their shares, depress share prices, and hurt the managers whose compensation is pegged on share price performance. Importantly, the exit threat by the large shareholders should act as an incentive to align the interests of managers to those of shareholders. However, the large shareholders’ exit threat is credible only if there exists ample market liquidity to allow them sell-off large quantities of shares with minimal price impact. Accordingly, liquidity provides a monitoring mechanism that ensures firm managers make value-maximizing decisions ex-ante.
On Asset pricing, an expansive literature reveals that liquidity risk is priced in the market place (see, for example, Amihud & Mendelson, Citation1986; Datar et al., Citation1998; Amihud, Citation2002; Pastor & Stambaugh, Citation2003; Acharya & Pedersen, Citation2005; Minovic & Zivkovic, Citation2012 among others). That is, rational investors demand to be compensated for holding securities that are costly to sell. This robust finding implies that; liquidity is a crucial determinant of stock returns and thus firms whose stocks are illiquid incur a high cost of raising equity. Further, this finding has an implication on capital structure decisions of firms. Particularly, if equity is expensive; then, in a general equilibrium, firms will substitute equity for more debt. Indeed, a number of studies observe that firms with liquid stocks tend to maintain low debt-to-equity ratios (see, for example, Lipson & Mortal, Citation2009; Udomsirikul et al., Citation2011). Thus, low market liquidity has the potential of inducing high firm leverage (a situation that can ultimately lead to firm distress).
Market liquidity is also often linked to stock pricing efficiency. More specifically, low market liquidity impedes stock price discovery. For instance, if stocks fail to trade frequently; then, the speed of information flow regarding the stock’s fundamentals is substantially low. Ultimately, stock prices may be out of sync with fundamentals, increasing the risk of large price corrections (bursting of bubbles).
Ultimately, stock market liquidity is closely linked to the economic growth of a country. For example, Levine (Citation1997) argues that whereas most profitable investment projects tend to require long-term capital financing, savers (investors) tend to have short investment horizons. A liquid stock market acts to solve this mismatch by providing savers with an asset that can be quickly converted into cash at whatever time investors prefer, but, on the other hand, allowing firms to enjoy the use of long-term equity capital. It is also worth noting that market liquidity can also impact economic growth through its effect on the cost of equity. For instance, high liquidity results in lower required returns on equity. This will result in reduced discount rates which are likely to expand the set of positive net present value projects implemented by firms. Accordingly, liquidity has a direct impact on the country’s investment level and hence growth.
For all these reasons, policymakers as well as academicians have a considerable interest in understanding what drives stock market liquidity. For example, since the era of capital liberalization, the question of whether foreign equity flows to developing markets promotes or impedes local stock market liquidity has generated a longstanding debate. Particularly, while some post-liberalization empirical studies show that foreign investors’ participation promotes liquidity of emerging markets (see, for example, Levine & Zervos, Citation1998; Vagias & Van Dijk, Citation2011), several other studies indicate that foreign investors’ flows undermine liquidity of emerging stock markets (Agudelo, Citation2010; Prasanna & Bansal, Citation2014; Rhee & Wang, Citation2009; Vo, Citation2016). Crucially, the latter evidence associating foreign investors to reduced market liquidity should concern policymakers in developing markets. Boyer et al. (Citation2006) demonstrate that increased foreign equity flows not only dampen stock liquidity but also appear to precipitate financial crises in emerging markets. Accordingly, understanding how foreign portfolio flows influence local liquidity is fundamental especially for developing markets. Interestingly, to date, research on this issue remains inconclusive and controversial.
In this paper, we revisit the debate on whether foreign flows promote or undermine stock market liquidity by providing fresh evidence from a frontier market whose daily trading activity appears to be largely dominated by foreign investors. For example, on average, over the period 2011–2018, monthly equity trading by foreign investors in Kenya ranged between 50% and 70%. Surprisingly, little effort has been directed towards uncovering the influence of this high foreign investor involvement on the stock market performance in Kenya. Thus, to the global literature, this paper makes an important contribution to the flows-liquidity debate by examining a market in which stock illiquidity is high. Moreover, Bekaert et al. (Citation2007) contend that liquidity effects are best tested in a context where illiquidity is a pervasive feature.
Overview of Trading activity, Regulatory Reforms, and Foreign Investor Participation at the Kenyan Stock Market
This section provides some stylized facts on trading activity, institutional features, reforms (geared towards promoting liquidity), and foreign investor activity at the Kenyan stock market, the Nairobi Securities Exchange (NSE), over the period 2011 to 2018.
Firstly, liquidity tends to be very volatile at the NSE as indicated by the wide fluctuation of annual average trading volume over the 2011–2018 period (see Table ). Additionally, there appears some evidence (though not conclusive) of the considerable price impact of trades judging by the variations in traded values. For example, between 2012 and 2013, traded shares increased by about 38%, while traded value rose by about 79% reflecting significant price volatility, plausibly, driven by changes in trading flows.
Table 1. NSE overall market activity, 2011–2018
Secondly, the Kenyan stock market has remarkably grown in size over the last eight years. Table shows that the market capitalization has increased from about 10 USD billion in 2011 to about 22 USD billion as at the end of 2018. This growth reflects the potential this market holds if its efficiency is enhanced. Disappointingly, however, it is observed that the development of the market in terms of new listings at the bourse has not been quite impressive. Table shows that the firms’ listings expanded from 58 in 2011 to 67 in 2018. Indeed, there seems to be a wide scope for developing the Kenyan stock market by encouraging more listings.
Thirdly, the trading at the NSE is dominated by foreign investors. Particularly, although the foreign long-term shareholding seems to have stagnated at about 20% for the most part of the sample period, annual foreign trading as a percentage of total equity trading at the Kenyan bourse has more than doubled over the period 2011–2018. This observation simply reflects the short-term speculative nature of foreign portfolio inflows into the Kenyan market.
Given the recent substantial interest of foreign investors at the NSE, the Capital Market authority of Kenya (CMA) has recently abolished a previous regulation that capped foreign shareholding of any listed stock at 75%. Particularly, among several reforms that CMA has instituted in a bid to boost liquidity (see Table ), lifting of the foreign shareholding ceiling is a notable one. Thus, starting from June 2015, a foreign investor is allowed to own up to 100% of any listed stock.
Table 2. Important institutional reforms from January 2011 to December 2018
Does the increased foreign investors’ participation promote or constrain stock liquidity at the Kenyan bourse? This is an important question given that liquidity at the Kenyan stock market is low compared to other emerging markets. For example, Table (which provides the stock turnover rates for several emerging stock markets) indicates that stock turnover rate at the NSE remains far below the Sub-Saharan Africa (SSA) average. Indeed, it even compares worse with Latin American stock markets, which posits stock turnover rates that are up to 5 times larger than Kenya’s. Probably, in recognition of this fact, the Kenyan policymakers have instituted several other reforms aimed at boosting trading at the NSE (see Table ). For example, in a bid to boost the confidence of both foreign and local investors in the NSE, the exchange has recently converted from a club-like entity into a publicly owned exchange market (a process known as demutualization). The policymakers have also provided tax incentives as well as attempting to broaden the range of products such as introduction of short-selling and now working on introducing a derivative market.
Table 3. Selected country comparative annual stock turnover ratios
2. Literature review
2.1. Theoretical literature review
Several hypotheses have been advanced to explain the channels through which foreign equity flows can alter the local stock market liquidity. However, a closer examination reveals that all the proposed channels are rooted in the assumption of existence of differentially informed traders in the security markets. Informed traders are those that possess private information on the fundamental value of a security and so trade on this information while uninformed traders (also called noise traders) do not know the true value of a security and so trade for reasons not related to information. Generally, asymmetric information-based models posit that the presence of heterogeneously informed traders in the security market creates adverse selection problems that can hamper trading and hence lower market liquidity (see for example: Glosten & Milgrom, Citation1985; Easley & O’hara, Citation1987; Admati & Pfleiderer, Citation1988 among others).
The impact of information asymmetry on market liquidity takes an interesting angle in the context of capital liberalization. There is mounting evidence that foreign investors tend to be better informed than local investors (see for example, Choe et al., Citation2001; Dvořák, Citation2005; Froot & Ramadorai, Citation2001; Grinblatt & Keloharju, Citation2000; Huang & Shiu, Citation2005; Kang, Citation1997; Richards, Citation2005; Seasholes, Citation2004). For example, Dvořák (Citation2005) posits that foreign investors are better informed because they tend to possess the expertise, technology, and resources necessary in making better inferences on the fundamental values of securities. Thus, in the spirit of the asymmetric information-based models, entry of informed foreign investors would exacerbate adverse selection problems.
Interestingly, there is an alternative view which holds that the entry of relatively more informed foreign investors has a beneficial effect on local market liquidity. Specifically, in the strategic trade model of Kyle (Citation1985), an optimizing local informed trader can strategically withhold private information to maximize his profits. This, however, can undermine market liquidity. However, the arrival of informed foreign investors spurs an information competition with the local informed investor, thereby increasing the rate at which information is incorporated into prices (Speigel & Subrahmanyam, Citation1992; Subrahmanyam, Citation1991). The resulting information efficiency reduces price uncertainty, attracts more traders to the exchange thereby boosting liquidity.
There is yet another information-based view which considers the entry of informed foreign investors into the local market beneficial to liquidity. In this regard, Huang and Shiu (Citation2005) and Richards (Citation2005) posit that aggressive purchase of stocks by the informed foreign investors may act as a positive signal of a market upturn which may attract the local uninformed investors into the stock market thereby improving trading activity and liquidity. Lastly, it is important to note that if foreign investors are less informed relative to the locals, and then they simply act as noise traders, trading for non-information-related reasons (such as portfolio diversification). This can promote liquidity by lowering transaction costs (Demsetz, Citation1968; Ho & Stoll, Citation1981). Demsetz (Citation1968), for example, opines that transaction costs tend to be fixed in nature and hence are subject to economies of scale. Accordingly, increased trading by foreign investors allows the transaction costs to be spread across many traders resulting in lower average transaction costs, attracting more trades thereby increasing liquidity.
2.2. Empirical literature review
Earlier empirical work on the interaction between foreign portfolio flows and stock liquidity focused on the impact of openness on stock liquidity. For example, Levine and Zervos (Citation1998) examined the response of local stock market liquidity to capital openness across 16 emerging countries for the period 1986 to 1993. In an event-study framework, these authors first identify dates when the considered countries significantly switched to more open international capital control policies. Subsequently, they test whether stock market liquidity improved in the period following the liberalization. These authors find that post-liberalization stock market liquidity significantly improved for the sampled countries.
Bekaert et al. (Citation2007) also find that stock liquidity for about 19 emerging countries showed significant improvement once foreign investors were given access to these equity markets. Unlike Levine and Zervos (Citation1998) who applied a simple ordinary least squares (OLS) with dummies to represent liberalization policy dates, Bekaert et al. (Citation2007) examine the returns-liquidity dynamics using a bivariate panel vector autoregression (VAR) model. However, the findings of Bekaert et al. (Citation2007) closely mirror those of Levine and Zervos (Citation1998) in the sense that liquidity improves once foreign investors start participating in the equity markets of the considered countries. Although the earlier studies by Levine and Zervos (Citation1998) and Bekaert et al. (Citation2007) provided initial understanding on the role of foreign capital flows on stock market liquidity, it is important to note that these studies were static in nature, in the sense that they failed to provide insights on the impact of continued involvement of foreign investors beyond their initial entry period. Besides, these earlier studies employed very broad measures to capture the role of foreign investment on stock market liquidity.
For instance, Levine and Zervos (Citation1998) simply use a dummy indicator to separate the pre-liberalization from post-liberalization; they then compare liquidity state before and after the liberalization. On the other hand, Bekaert et al. (Citation2007) employ an openness measure defined as the ratio of the market capitalization available for investing by foreign investors to total market capitalization. Ideally, these measures provide only very general insights on the effects of capital market liberalization without providing the response of market attributes to the actual participation of foreign investors.
In contrast, Rhee and Wang (Citation2009) examine the dynamic interaction between foreign equity flows and local stock market liquidity using foreign trade level data. Particularly, these authors investigate the impact of foreign investors’ ownership on stock liquidity using data from Indonesia over the period 2002 to 2007. Employing the Fama and MacBeth (Citation1973)-type regressions, these authors find that foreign ownership reduces liquidity in Indonesia. Further, based on their empirical investigation, these authors offer several reflections that could explain this negative relationship between foreign ownership and liquidity.
Firstly, they argue that possibly, increased foreign ownership exacerbates information asymmetric problems. Secondly, foreign ownership could hurt liquidity if foreign investors trade in large quantities thereby increasing the price impact of trades and volatility. Finally, foreign ownership can diminish liquidity if foreign investors employ a buy and hold strategy thereby reducing the free float (that is the shares available for trading). Using data on foreign equity flows across 40 countries over the period 2000 to 2007, Wei (Citation2010) investigates the impact of US equity flows on destination country stock market liquidity. The author experiments with several regressions in his analysis; first, he estimates a simple panel model:
where represents the liquidity of stock
during year
while
represents one-year-lagged foreign stock ownership. Although the lagging of the
variable is meant to control for endogeneity between liquidity and foreign ownership, Wei (Citation2010) admits that this strategy is not sufficient to alleviate the problem given the high persistence of the
variable. The best-known approach of dealing with endogeneity problem is the instrumental variable regression. In this regard, Wei (Citation2010) innovatively identifies an appropriate instrument for the
variable. Specifically, the instrument comes from a 2003 US dividend tax treaty with several other countries. The provision simply offered US institutional investors preferential tax treatment for dividends earned in specific treaty countries. Clearly, this was an incentive to push US institutional investors to stock-paying dividends in treaty countries. In a nutshell, Wei finds an instrument that is highly correlated to US institutional stock ownership in treaty countries (relevant) while poorly linked to the treaty country’s stock liquidity (exogenous). After controlling for the endogeneity, Wei’s empirical results show that foreign ownership has a significant positive impact on local stock liquidity in the sampled countries.
It is important to note that the variable employed by Wei (Citation2010) captures the long-term impact of foreign flows on domestic stock liquidity. By considering only the end of the year foreign stock holding level, the analysis fails to shed light on the short-term trading impact of foreign investors on domestic liquidity. The short-term dynamics of foreign flows could be relevant especially in crisis periods. Another shortcoming of the studies by Rhee and Wang (Citation2009) as well as Wei (Citation2010) is that they fail to examine the feedback dynamic relations between flows, liquidity, and other important stock characteristics such as return and volatility (which have a close link with liquidity).
Similarly, employing data from 40 countries over the period June 2002 to December 2007 Ng et al. (Citation2015) estimate a panel regression model similar to that of Wei (Citation2010) but find that foreign ownership negatively impacts stock liquidity. The only notable difference in the Ng et al. (Citation2016)’s study is that; first, Ng et al. emphasize on the size of foreign investors’ shareholding. That is, unlike Wei (Citation2010), Ng et al. only consider foreign shareholding of 5% and above in constructing the variable. Second, since Ng et al. do not have a quasi-experiment that was available to Wei (Citation2010), they employ firm financial performance and leverage indicators as instruments to control for endogeneity. The argument these authors supply is that foreign investors prefer to invest in firms with good financial performance metrics and low leverage. However, Ng et al. do not test the suitability of the used instruments and therefore one wonders whether these instruments are able to properly control for endogeneity. Besides, the latter’s study shares in the weakness of Wei’s study in the sense that these studies do not exploit the dynamic interaction between flows, liquidity, and some other firm characteristics that are clearly endogenous.
Ding et al. (Citation2013) also examined the impact of foreign investor participation on stock liquidity in China for the period 2004Q2 to 2012Q1. These authors capture foreign participation simply as the number of foreign institutional investors involved in trading of a stock in a given quarter. They employ the same methodology as well as liquidity measures as in Rhee and Wang (Citation2009), Wei (Citation2010), and Ng et al. (Citation2016. Their findings reveal that foreign investors’ involvement promotes local liquidity in China.
In view of the challenges associated with controlling for endogeneity in examining the association between foreign equity flows and domestic stock liquidity, a recent strand of the literature prefers to use vector autoregression framework which is more flexible, simultaneously handles a set of endogenous variables, and more importantly captures the dynamic interrelation among several variables.
Agudelo (Citation2010), for example, examines the role of daily foreign equity flows on local liquidity for seven emerging markets (India, Indonesia, Korea, Philippines, South Africa, Taiwan, and Thailand) over the period April 2004 to March 2006. Estimating a 5-VAR model (consisting of; liquidity, returns, volatility, turnover, and foreign portfolio flows) the author finds that short-term speculative portfolio flows to these markets reduce liquidity through information effects while long-term foreign ownership boosts liquidity. The author therefore suggests that policymakers should weigh between the disruptive short-term effects vis-à-vis the long-term beneficial effects of foreign equity flows in deciding whether or not to restrict these flows. Vagias and Van Dijk (Citation2011) also employ the vector autoregression approach to examine the interaction of foreign equity portfolio flows and local stock liquidity for 46 countries (drawn from both developed and emerging countries) for the period 1995–2008. Specifically, these authors construct foreign flows as net equity purchases by non-resident investors (that is, gross equity purchases less gross equity sales) normalized by local market capitalization. Several interesting results emerge from this empirical exercise. First and foremost, the authors show that foreign equity flows promote rather than impede local stock liquidity for all the countries sampled.
Secondly, Vagias and Van Dijk (Citation2011) document that the positive liquidity impact of flows is more prominent in emerging markets than in advanced markets. Thirdly, they point out that the effect of flows on liquidity is sensitive to informational disclosure environment. For example, they find a stronger positive liquidity effect on emerging markets with more open informational disclosures. In this regard, they explain that with transparent informational disclosures, foreign investors simply act as noise traders boosting liquidity as opposed to informed investors who drive an information gap thus dampening local liquidity through adverse selection.
The empirical literature seems to agree that foreign trading is not neutral as far as local liquidity is concerned. The controversy however regards as to whether foreign equity flows are a bane or boon for local liquidity. Some authors find a positive effect while others show a negative effect. However, the review of the literature shows that there are only a handful studies focusing on the impact of foreign trades on liquidity. Particularly, no study pays attention to the frontier market where liquidity is more critical. Additionally, most empirical studies tend to restrict the interaction of foreign trades and liquidity by estimating panel regressions. However, as Hoti (Citation2002) contends, theory does not seem to provide enough information to warrant such restrictions. Thus, the panel regressions may be plagued by endogeneity problems. Besides, the exercise of searching for instruments for foreign flows can be daunting. Due to these challenges, recent research opts to model the dynamics of flows and liquidity using the VAR framework.
3. Methodology
3.1. Empirical model
To empirically test the effects of foreign flows on local stock market liquidity, the study employs a vector autoregression (VAR) framework. The VAR framework is preferred since the variables of interest, that is, foreign equity flows, stock returns, and stock market liquidity, are potentially endogenous. Stock and Watson (Citation2001) define a vector autoregression (VAR) as “an n-equation, n-variable linear model in which each variable is in turn explained by its own lagged values, plus current and past values of the remaining n-1 variables.” Thus, assuming that is a
vector of endogenous variables; then, a simple VAR model for
can be set-up as follows:
where is a polynomial lag operator appropriately restricted to ensure that
exists. The
term compacts together all the deterministic components of the data such as constants, time dummies, etc. Finally,
represents the vector of exogenous variables and
represents a vector of white noise disturbances. In the context of this study, the main endogenous variables are the foreign equity flows, market returns, and market liquidity while market return volatility, global risk aversion (as measured by the VIX index), and distress market conditions (measured by 3-months consecutive negative market returns, NMRET) are the exogenous variables. That is;
The VAR approach has been employed before to explore market-wide liquidity dynamics (see Fernández-Amador et al., Citation2013; Fujimoto, Citation2003; Goyenko & Ukhov, Citation2009) and the interaction between aggregate market liquidity and foreign equity flows (see Froot et al., Citation2001; Richards, Citation2005; Agudelo, Citation2010; Vagias & Van Dijk, Citation2011 among others).
3.2. Estimation and testing
The VAR model (2) is estimated using OLS. To ensure that the model is adequate for interpretation, a number of diagnostic tests are conducted. For example, a particularly important step in estimating VAR models involves the selection of optimal lag order (). In this regard, several information criteria are employed to establish the optimal lag. Another important step in VAR modeling involves testing the stability of the model. A VAR model is considered stable if all the roots of the polynomial lag
lie inside the unit circle. Finally, the model is subjected to an LM test of autocorrelation to ensure that the resulting residuals are white noise.
3.3. Variables definition
The monthly market return, liquidity and volatility are obtained by computing an equally weighted average from the daily values. For example, the daily stock market returns are computed as the continuously compounded daily changes in closing stock prices as follows:
The monthly market returns () are then obtained as the equally weighted monthly average of all daily sample stock returns. The monthly returns volatility (MVOL) is also obtained as the monthly average of daily stock returns across all the sample stocks. To construct the foreign equity flows variable, we follow several earlier studies (such as Froot et al., Citation2001; Richards, Citation2005; Agudelo, Citation2010 among others) to define FLOWS as;
where and
respectively refer to foreign gross purchases and sales of Kenyan equities over a period of one trading month while
represents the aggregate market capitalization. Particularly, the FLOWS variables capture the net foreign purchase as a proportion of total market capitalization. Sanvicente (Citation2014) argues that since a foreign investor may purchase and sell the same stock within a given period the net purchases variable (GP-GS) seems a more realistic variable to capture foreign investors’ participation.
Additionally, Kamesaka et al. (Citation2003) argue that the direction of the trade imbalance (either positive or negative) provides useful insights regarding how foreign investors currently view the stock prices. For instance, positive net purchases imply that foreign investors consider the stock market undervalued, while negative net purchases signal an overvalued stock market. Prasanna and Bansal (Citation2014) also suggest that positive net purchases by foreign investors reflect a positive sentiment about future returns and therefore is associated with higher stock liquidity while negative net purchases reflect depressed sentiments and so will be associated with liquidity declines.
In regard to liquidity, we employ four measures of stock liquidity. The Amihud (Citation2002) price measure (ILLIQ), the Hui and Heubel (Citation1984) price impact measure (HH), Liu’s (Citation2006) measure, and the liquidity index (LI) proposed by Butler et al. (Citation2005). The construction of these measures is presented in appendix A.
Two other variables included in the set of exogenous variables are the global risk aversion and market distress conditions. Particularly, we capture the global investors’ appetite for risk using the Chicago Board Exchange S&P option volatility index (VIX). The VIX extracts investor’s future economic expectations from the equity option prices. Elevated values of VIX signals risky conditions going forward and vice versa. The motivation for introducing this variable lies in the observation that international investors dominate equity trading at the NSE. Accordingly, deterioration of global economic conditions can result in reduced foreign investors’ participation in risky emerging equity markets. Additionally, to control for local market conditions, we construct a dummy variable (NMRET) which takes a value of 1 of market returns have been negative for the past three consecutive months and zero otherwise. Acharya et al. (Citation2013) also use this approach to identify an economic and financial stress regime and show that financial market liquidity significantly declines in economic downturns.
3.4. Data
The analysis in this study utilizes monthly data covering the period from January 2011 to December 2018. The sample period is chosen based on the availability of monthly foreign equity flows data. To construct the foreign equity flow variable (FLOWS), monthly aggregate purchases, and sales of equity by foreign investors are obtained from the Nairobi Securities Exchange (NSE). Additionally, for the construction of stock liquidity, returns and volatility, daily volume-weighted average prices, daily traded volumes, and daily outstanding shares data are obtained from Datastream and verified based on data from the NSE. Finally, the data on VIX are obtained from the Federal Reserve Economic Database (FRED).
4. Empirical results and discussions
4.1. Descriptive statistics
Table gives the monthly mean, maximum, minimum, standard deviation, and correlations of the main variables employed in this study. The table reveals that the period January 2011 to December 2018 was characterized by an overall positive net purchase of local equities by foreign investors. The average monthly stock returns stood at about −0.40% although, on average the returns vary between a maximum of 11.9% and a minimum of −10.5%. Thus, it appears that positive net foreign equity flows are associated with negative market returns over this sample period. However, exploring the time-series behavior of the inflows and returns will provide further insights beyond this static summary information. Further, Table reveals a fairly substantial positive serial correlation in net foreign purchases. This finding is consistent with Froot et al. (Citation2001) and Richards (Citation2005) who argue that the positive correlation in inflows could either; reflect investors who establish their positions gradually so as not to trigger a large price impact or entry of similar investor types who respond to same information signals albeit with differing speeds. Liquidity measures also show considerable positive autocorrelation which is again consistent with the findings of Amihud (Citation2002) and Soderberg (Citation2008). Market return volatility also shows substantial first-order autocorrelation (0.48) while returns indicate far less first-order autocorrelation (0.19).
Table 4. Summary statistics and correlation matrix
Focusing on the correlation analysis provided also in Table , it is observed that stock return is positively correlated with foreign equity inflows (albeit not statistically significant at 5% significance level), while market return volatility bears a significantly negative correlation with foreign net purchases. Further, the correlation matrix shows a significant negative association between inflows and liquidity measures ILLIQ and HH. Importantly, this observation provides some preliminary evidence that foreign equity inflows are associated with increased liquidity in the Kenyan stock market. Liquidity also appears to have substantial positive correlation with volatility.
4.2. Time-series behavior of net purchases of Foreign investors
Figure plots the cumulated monthly net foreign purchases and the main equity market index (NSE 20 share index) over the period January 2011–December 2018. The striking stylized fact drawn from the figure is that returns and inflows seems to closely track each other. Particularly, both inflows and returns increased steadily from late 2011 to mid-2015 and then declined till the end of the sample period. It is, however, not possible to infer the causal structure from this preliminary observation. Accordingly, to understand whether returns drive inflows or vice versa, the next section provides results of a simple causal model (VAR).
Figure 1. Cumulative net purchases and market index.
Figure presents the time-series path of cumulative net purchases of Kenyan equities (gross purchases less gross sales in billion Kenya shillings) and the NSE 20 share index over the period 2011M1–2018M12.
Figure explores the dynamic interaction between foreign equity inflows and local stock market liquidity. The figure reveals that generally, periods of high (low) foreign investor inflows are associated with low (high) illiquidity. For example, the liquidity index (LI) appears to increase when inflows increase (such as during the period mid-2011 to end of 2014) and decrease when inflows are declining (such as over the period 2015–2018). This univariate analysis provides initial evidence of a negative link between illiquidity and inflows. An interesting issue in this regard is the direction of causation; do inflows trigger liquidity changes or vice versa? The VAR model of the next section will attempt to provide answers to this important question.
Figure 2. Net foreign purchases and stock market liquidity.
Figure plots the relationship between liquidity measures (ILLIQ, HH, LM, and LI) and net foreign equity purchases. Net purchases are obtained as the difference between gross purchases and gross sales.
4.3. VAR results
Several tests precede the estimation and interpretation of the VAR model. Firstly, all the variables of interest were subjected to unit root tests (ADF and PP) to establish their stationarity properties. The ADF and PP test results of this exercise are reported in Table . The unit root test results show that except for three liquidity measures (ILLIQ, HH, and LI) which yield mixed results across the two tests, all other variables are stationary at levels. Despite the mixed results, we rely on the PP test results which indicates that all variables are stationary at levels and so proceed to estimate VAR in levels. It is worth noting that the PP test better handles issues of heteroskedasticity and serial correlation (in the test regression) compared to ADF. This feature is especially useful in understanding the stationarity of liquidity measures employed in this study. More specifically, our liquidity measures exhibit considerable serial correlation (see Table ) and are widely dispersed across time (see Figure ). Moreover, Sims (Citation1980) argue against estimating VAR in differences citing loss of key long-run information when one works with changes rather than levels.
Table 5. Unit root test results
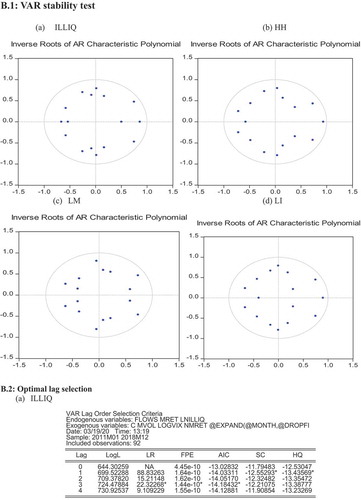
Secondly, the VAR model is tested for stability. The VAR system is said to be stable if all the unit roots of the polynomial lag (B(L) in model 2) lies inside the unit circle. Appendix B.1 presents the autoregressive root stability test results which indicate that the VAR models are stable since all the roots lie inside the unit circle.
Thirdly, establishing the lag length of the VAR system is key in ensuring the reliability of the results. Accordingly, two information criteria (Akaike and Schwarz-Bayes) were employed to select the optimal lag. In the end, the majority of the criteria revealed that a three-lag VAR is optimal in characterizing the dynamic behavior of the selected variables (see Appendix B.2). Finally, a routine residual diagnostic test, that is, the LM autocorrelation test results (Appendix B.3) fail to reject the null hypothesis of no serial correlation at all lags signaling further the adequacy of the VAR (3) model.
Generally, a VAR (3) model appears adequate for capturing the dynamics of foreign flows, market returns and market liquidity for the Kenyan stock market. The coefficients of the VAR model (provided in Appendix C) indicate that increased foreign inflows predict increased local liquidity. On the other hand, local liquidity does not seem to have any significant influence in predicting flows. Further, market volatility shows positive (negative) coefficients on illiquidity (liquidity) measures indicating that volatility reduces liquidity. This is consistent with the inventory-based trade model of Ho and Stoll (Citation1981) who argue that increased market volatility decreases the utility of risk-averse liquidity providers hence reducing market liquidity. Fujimoto (Citation2003) and Agudelo (Citation2010) also document the negative influence of volatility on liquidity for the US and the Indonesian market, respectively. Further, unreported results indicate that elevated levels of global risk aversion as well as distress market conditions consume local market liquidity.
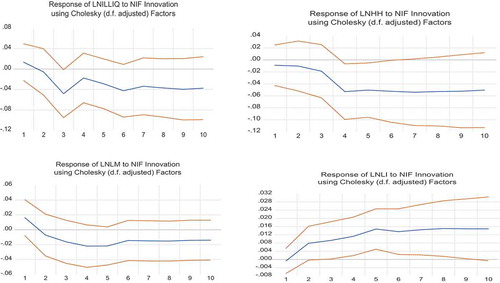
Beyond the VAR regression coefficients, important insights are also gained by focusing on the impulse response functionsFootnote2 (provided within the VAR framework). Accordingly, Figure provides the impulse response functions (IRFs) for four liquidity measures (ILLIQ, HH, LM, and LI). The main findings from the impulse response analysis are as follows: The first finding is that foreign inflows and market liquidity exhibit strong persistence. On foreign inflows persistence, Froot et al. (Citation2001) argue that net inflows could persist if foreign investors with information trade gradually to mitigate the price impact that could occur if they moved to their desired positions at once. On liquidity persistence, Amihud (Citation2002) explains that in practice, investors predict future liquidity based on the past realization of liquidity. The second finding regards the dynamic interaction between foreign equity inflows and local stock market returns. Although foreign net flows appear to respond positively to orthogonal innovations in local market returns, the relationship is not statistically significant for all models. Overall, there appears to be no strong evidence of trend-chasing/feedback trading by foreign investors at the NSE.
Figure 3. Impulse response functions of foreign flows, liquidity, and market returns.
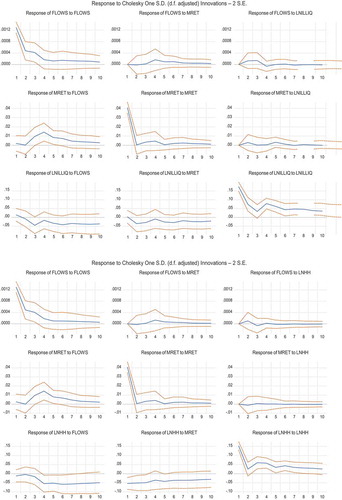
Figure 3. Continued.
On the other hand, positive net foreign inflows seem to cause a significant increase in market returns. Agudelo (Citation2010) argues that positive net foreign inflows causing an increase in market returns is evidence in favor of either the price pressure hypothesis documented by Warther (Citation1995) and Richards (Citation2005) or information content hypothesis fronted by among others. Froot and Ramadorai (Citation2001), Griffin et al. (Citation2004), and Griffin et al. (Citation2004), for example, argues that, if foreign investors have superior information relative to local investors, then lagged flows will consistently forecast local returns. Importantly, the evidence adduced from the IRFs shows that increased foreign inflows predict increased returns with a lag of about 3 months. Thus, this finding seems to suggest that foreign investors have an information advantage over the Kenyan local investors.
The third main finding is that local liquidity does not seem to have a significant influence on foreign inflows. Thus, this study does not find supporting evidence of the foreign preference for liquid stocks documented earlier (for instance, by Rhee & Wang, Citation2009). On this observation, Vagias and Van Dijk (Citation2011) opine that international investors contemplating entry into emerging markets may consider illiquidity risk as of secondary concern relative to other risks such as political risks.
The fourth main finding is that increased foreign inflows improve liquidity at the NSE. Particularly, a positive shock to foreign inflows in the current month elicits a significant negative response of the HH illiquidity measure and a significant positive response in liquidity (LI) after about 4 months. This finding differs from some studies which show that foreign ownership impedes local liquidity (see, for example, Prasanna & Bansal, Citation2014; Rhee & Wang, Citation2009) but is consistent with other studies which indicate that foreign ownership promotes liquidity (see Agudelo, Citation2010; Vagias & Van Dijk, Citation2011). For example, Agudelo (Citation2010) finds that foreign inflows boost local liquidity in the Indonesian stock market. The authors further offer some reflections on the possible channel through which inflows boost liquidity in this market. Particularly, they argue that the increased presence of foreign investors attracts uninformed/noise traders into the market thereby increasing trading activity and liquidity. However, in the context of Kenya, the information channel seems to be a more compelling explanation for the positive link between foreign inflows and stock market liquidity. This conclusion draws inspiration from the observation that lagged flows predict returns implying that foreign investors are more informed than the locals. Plausibly, intensive foreign buying of Kenyan stocks acts as a leading signal of good future market prospects, luring locally uninformed investors into the stock market and thereby increasing trading activity and liquidity (Agudelo, Citation2010). Alternatively, locally uninformed investors can be attracted to the stock market if they view increased foreign presence as a signal of increased information transparency and corporate discipline (Bae et al., Citation2006).
The last main finding from the impulse response analysis is that market liquidity seems to respond positively to increasing market returns. The beneficial effect of increased returns on liquidity is a widely documented phenomenon (see Agudelo, Citation2010; Chordia et al., Citation2001, Citation2005; Fujimoto, Citation2003; Vagias & Van Dijk, Citation2011). Chordia et al. (Citation2001) argue that rising markets are beneficial to liquidity since they lower the inventory costs of liquidity providers which then motivates increased trading.
An alternative way to examine the impact of foreign flows on liquidity is through the forecast error variance decomposition (FEVD) also provided within the VAR framework. Since the main research question of this study is whether liquidity is altered by foreign flows, Table presents the proportion of the variance in liquidity that is explained after 12 months by foreign flows and market returns. Overall, the FEVD results indicate that after 12 months foreign flows account for between 10% and 31% of variations in liquidity while market returns contribute between 18% and 51% of the variations in liquidity in the Kenyan stock market. Based on these results, one can conclude that although market returns account for a greater proportion of liquidity fluctuations, net foreign inflows do have a substantial influence in driving liquidity in the Kenyan stock market.
Table 6. Forecast error variance decomposition
4.4. Robustness check: alternative measure of foreign equity flows
To test the robustness of our results we construct an alternative measure of foreign equity inflows suggested by Kamesaka et al. (Citation2003). This alternative measure is constructed as follows:
where and
represent monthly foreign gross purchases and gross sales, respectively. Viral Acharya et al. (Citation2014) cites that this measure is often also widely used in stock order flows’ studies.
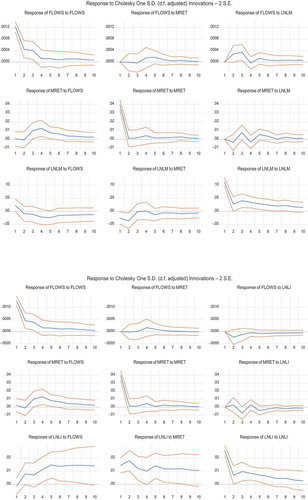
Employing this alternative measure of foreign equity flows in the VAR model (2) generates the impulse response functions reported in Figure (only the response of liquidity measures to flow shocks is reported). Importantly, the results obtained from using the NIF measure are qualitatively similar to those obtained by using the FLOWS measure. More specifically, positive shocks to foreign equity flows lower the local stock illiquidity albeit with a lag.
Figure 4. IRFs-alternative measure of foreign equity flow.
5. Conclusion and policy recommendations
This study examined the interaction between foreign equity portfolio flows and local stock market liquidity in Kenya over the period January 2011–December 2018. The analysis was based on vector autoregression (VAR) model with monthly foreign equity flows, returns, and liquidity measures as the endogenous variables and volatility, global risk aversion, and distress market conditions as the exogenous variables. Several conclusions are drawn from the empirical analysis. Firstly, flows to Kenya tend to be persistent, in the sense that foreign investors enter the market or exit in a gradual manner.
Secondly, this study documents that foreign equity portfolio flows contain predictive information on future expected stock returns. This can be weakly interpreted to mean that foreign investors seem to have an information advantage over local Kenyan investors. However, more research is required to validate this hotly debated idea of who is more informed between the foreign investor and the local investor. This is a fruitful avenue for future research.
Thirdly, the study also finds that increased foreign inflows promote local stock market liquidity in Kenya. This is consistent with the expectations that many emerging and frontier markets hold when they open their markets to international investors. That is, the view that stock market liberalization boosts local stock liquidity.
The empirical results of this study provide key insights to policy authorities charged with the surveillance of the equity market in Kenya. First, the finding that foreign equity net inflows to Kenya tend to be gradual implies that market authorities can actually monitor developments in foreign flows and watch out for any short-term adverse effects of these flows. Secondly, the robust evidence that foreign investors’ participation benefits local liquidity renders empirical support to the recent policy (by CMA) that now allows foreign investors to acquire up to 100% of any stock listed at the NSE. In a nutshell, our results indicate that foreign inflows are beneficial from a liquidity perspective and therefore should be encouraged. A caveat though is that the flows appear to be of very short term in nature. That is, we observe that whereas foreign trading accounts for up to 70% of market turnover, long-term foreign shareholding has stagnated at about 20% for the last 8 years. This short-term nature of the flows greatly exposes the NSE to a sudden stop in the event that the foreign investors decide to leave the market suddenly. Thus, to increase the liquidity resilience of this market it would be imperative to encourage local investors’ trading.
Although this study achieves its set objective, a notable limitation is the lack of high-frequency data on foreign flows. Agudelo (Citation2010) finds that whereas foreign flows tend to have a permanent beneficial effect on liquidity, in the short-term (daily) foreign flows consume liquidity as foreign traders seem to aggressively demand liquidity. Consequently, understanding the short-term dynamics of flows is important to policymakers who are charged with surveillance duties. This avenue can be fruitfully pursued as high-frequency data become available. Additionally, although this study establishes that foreign flows impact liquidity positively at the NSE and conjectures that information channel may be a plausible mechanism through which flows alter liquidity, further evidence is required to firmly validate this channel.
Additional information
Funding
Notes on contributors
Rogers Ondiba Ochenge
Rogers Ondiba Ochenge is a PhD Economics candidate at the University of Nairobi. He also works as a teaching Fellow in the School of Business and Economics of the University of Embu and an adjunct teaching fellow at Strathmore University. (corresponding author: [email protected])
Rose Ngugi
Rose Ngugi is a senior Lecturer in the school of Economics of the University of Nairobi, Kenya. Her research work is mostly in financial economics, monetary policy, and development finance. She has published in top journals such as the Journal of International Development and European Journal of finance.
Peter Muriu
Peter Muriu is a senior lecturer in the school of Economics of the University of Nairobi, Kenya. His research interests include development finance, monetary policy, and financial economics. He has published his work in top journals including; African Journal of Social Sciences and Journal of Financial regulation & Compliance.
Notes
1. Market liquidity is the ability of a trader to quickly exchange a large quantity of a security at a minimal impact to price. Thus, liquidity spans three key dimensions; time, quantity, and cost. It also important to note that market liquidity is different from funding liquidity (the ability of liquidity providers/market-makers to fund their positions) and cashflow liquidity as applied in the banking literature.
2. The impulse response functions are calculated using the Cholesky decomposition identification scheme. Following earlier studies (such as Froot et al., Citation2001; Richards, Citation2005; Vagias & Van Dijk, Citation2011) the flows variable is ordered first, then market returns and finally market liquidity. However, for robustness check, different orderings were experimented and the results appeared to be largely similar.
References
- Acharya, V., Amihud, Y., & Bharath. (2013). Liquidity risk of corporate bond returns: Conditional approach. Journal of Financial Economics, 110(2), 358–29. https://doi.org/10.1016/j.jfineco.2013.08.002
- Acharya, V., Anshuman, R., & Kumar, K. (2014). Foreign fund flows and stock returns: Evidence from India [Unpublished]. New York University.
- Acharya, V., & Pedersen, L. (2005). Asset pricing with liquidity risk. Journal of Financial Economics, 77(2), 375–410. https://doi.org/10.1016/j.jfineco.2004.06.007
- Admati, A. R., & Pfleiderer, P. (1988). Selling and trading on information in financial markets. The American Economic Review, 78(2), 96–103. www.jstor.org/stable/1818105
- Admati, A. R., & Pfleiderer, P. (2009). The “Wall street walk” and shareholder activism: Exit as a form of voice. The Review of Financial Studies, 22(7), 2645–2685. https://doi.org/10.1093/rfs/hhp037
- Agudelo, D. (2010). Friend of foe? Foreign investors and the liquidity of six Asian markets. Asia-Pacific Journal of Financial Studies, 39(3), 261–300. https://doi.org/10.1111/j.2041-6156.2010.01012.x
- Amihud, Y. (2002). Illiquidity and stock returns: Cross-section and time-series effects. Journal of Financial Markets, 5(1), 31–56. https://doi.org/10.1016/S1386-4181(01)00024-6
- Amihud, Y., & Mendelson, H. (1986). Asset pricing and the bid-ask spread. Journal of Financial Economics, 17(2), 223–249. https://doi.org/10.1016/0304-405X(86)90065-6
- Bae, K.-H., Bailey, W., & Mao, C. X. (2006). Stock market liberalization and the information environment. Journal of International Money and Finance, 25(3), 404–428. https://doi.org/10.1016/j.jimonfin.2006.01.004
- Bekaert, G., Harvey, C. R., & Lundblad, C. (2007). Liquidity and expected returns: lessons from emerging markets. Review of Financial Studies, 20(6), 1783–1831. https://doi.org/10.1093/rfs/hhm030
- Boyer, B. H., Kumagai, T., & Yuan, K. (2006). How do crises spread? Evidence from accessible and inaccessible stock indices. The Journal of Finance, 61(2), 957–1003. https://doi.org/10.1111/j.1540-6261.2006.00860.x
- Butler, A. W., Grullon, G., & Weston, J. P. (2005). Stock market liquidity and the cost of issuing equity. Journal of Financial and Quantitative Analysis, 40(2), 331–348. https://doi.org/10.1017/S0022109000002337
- Choe, H., Kho, B.-C., & Stulz, R. M. (2001). Do domestic investors have more valuable information about individual stocks than foreign investors? National bureau of economic research.
- Chordia, T., Roll, R., & Subrahmanyam, A. (2001). Market liquidity and trading activity. The Journal of Finance, 56(2), 501–530. https://doi.org/10.1111/0022-1082.00335
- Chordia, T., Sarkar, A., & Subrahmanyam, A. (2005). An empirical analysis of stock and bond market liquidity. Review of Financial Studies, 18(1), 85–129. https://doi.org/10.1093/rfs/hhi010
- Datar, V. T., Naik, N. Y., & Radcliffe, R. (1998). Liquidity and stock returns: An alternative test. Journal of Financial Markets, 1(2), 203–219. https://doi.org/10.1016/S1386-4181(97)00004-9
- Demsetz, H. (1968). The cost of transacting. The Quarterly Journal of Economics, 82(1), 33–53. https://doi.org/10.2307/1882244
- Ding, M., Nilsson, B., & Suardi, S., & others. (2013). Foreign institutional investors and stock market liquidity in China: State ownership, trading activity and information asymmetry. The Knut Wicksell Centre for Financial Studies, Lund University Working Paper, 14.
- Dvořák, T. (2005). Do domestic investors have an information advantage? Evidence from Indonesia. The Journal of Finance, 60(2), 817–839. https://doi.org/10.1111/j.1540-6261.2005.00747.x
- Easley, D., & O’hara, M. (1987). Price, trade size, and information in securities markets. Journal of Financial Economics, 19(1), 69–90. https://doi.org/10.1016/0304-405X(87)90029-8
- Edmans, A. (2009). Blockholder trading, market efficiency, and managerial myopia. The Journal of Finance, 64(6), 2481–2513. https://doi.org/10.1111/j.1540-6261.2009.01508.x
- Edmans, A. (2014). Blockholders and corporate governance. Annual Review of Financial Economics, 6(1), 23–50. https://doi.org/10.1146/annurev-financial-110613-034455
- Edmans, A., & Manso, G. (2011). Governance through trading and intervention: A theory of multiple blockholders. The Review of Financial Studies, 24(7), 2395–2428. https://doi.org/10.1093/rfs/hhq145
- Fama, E. F., & MacBeth, J. D. (1973). Risk, return, and equilibrium: Empirical tests. The Journal of Political Economy, 81(3), 607–636. https://doi.org/10.1086/260061
- Fernández-Amador, O., Gächter, M., Larch, M., & Peter, G. (2013). Does monetary policy determine stock market liquidity? New evidence from the euro zone. Journal of Empirical Finance, 21(C), 54–68. https://doi.org/10.1016/j.jempfin.2012.12.008
- Froot, K. A., O’connell, P. G., & Seasholes, M. S. (2001). The portfolio flows of international investors. Journal of Financial Economics, 59(2), 151–193. https://doi.org/10.1016/S0304-405X(00)00084-2
- Froot, K. A., & Ramadorai, T. (2001). The information content of international portfolio flows. National Bureau of Economic Research.
- Fujimoto, A. (2003). Macroeconomic sources of systematic liquidity [Unpublished Working Paper]. Yale University.
- Glosten, L. R., & Milgrom, P. R. (1985). Bid, ask and transaction prices in a specialist market with heterogeneously informed traders. Journal of Financial Economics, 14(1), 71–100. https://doi.org/10.1016/0304-405X(85)90044-3
- Goyenko, R. Y., & Ukhov, A. D. (2009). Stock and Bond Market Liquidity: A Long-Run Empirical Analysis. Journal of Financial and Quantitative Analysis, 44(1), 189. https://doi.org/10.1017/S0022109009090097
- Griffin, J. M., Nardari, F., & Stulz, R. M. (2004). Are daily cross-border equity flows pushed or pulled? Review of Economics and Statistics, 86(3), 641–657. https://doi.org/10.1162/0034653041811725
- Grinblatt, M., & Keloharju, M. (2000). The investment behavior and performance of various investor types: A study of Finland’s unique data set. Journal of Financial Economics, 55(1), 43–67. https://doi.org/10.1016/S0304-405X(99)00044-6
- Ho, T., & Stoll, H. R. (1981). Optimal dealer pricing under transactions and return uncertainty. Journal of Financial Economics, 9(1), 47–73. https://doi.org/10.1016/0304-405X(81)90020-9
- Hoti, S. (2002). Trends and volatilities in international capital flows for developing countries [International Environmental Modelling and Software Society]. University of Western Australia.
- Huang, R. D., & Shiu, C.-Y. (2005). Overseas monitors in emerging financial markets: Evidence from foreign ownership in Taiwan. Available at SSRN 875365. University of Notre Dame.
- Hui, B., & Heubel, B. (1984). Comparative liquidity advantages among major US stock markets (Vol. 84081). Data Resources inc.
- Kamesaka, A., Nofsinger, J. R., & Kawakita, H. (2003). Investment patterns and performance of investor groups in Japan. Pacific-Basin Finance Journal, 11(1), 1–22. https://doi.org/10.1016/S0927-538X(02)00095-1
- Kang, J.-K. (1997). Why is there a home bias? An analysis of foreign portfolio equity ownership in Japan. Journal of Financial Economics, 46(1), 3–28. https://doi.org/10.1016/S0304-405X(97)00023-8
- Kyle, A. S. (1985). Continuous auctions and insider trading. Econometrica, 53(6), 1315. https://doi.org/10.2307/1913210
- Levine, R. (1997). Financial Development and Economic Growth: Views and Agenda. Journal of Economic Literature,35(2), 688-726. Retrieved from www.jstor.org/stable/2729790
- Levine, R., & Zervos, S. (1998). Capital control liberalization and stock market development. World Development, 26(7), 1169–1183. https://doi.org/10.1016/S0305-750X(98)00046-1
- Lilian, Ng., Fei, W., Jing, Y., & Bohui, Z. (2016). Foreign Investor Heterogeneity and Stock Liquidity around the World. Review of Finance, European Finance Association, 20(5), 1867-1910. https://ideas.repec.org/a/oup/revfin/v20y2016i5p1867-1910.html
- Lipson, M. L., & Mortal, S. (2009). Liquidity and capital structure. Journal of Financial Markets, 12(4), 611–644. https://doi.org/10.1016/j.finmar.2009.04.002
- Liu, W. (2006). A liquidity-augmented capital asset pricing model. Journal of Financial Economics, 82(3), 631–671. https://doi.org/10.1016/j.jfineco.2005.10.001
- Minovic, J., & Zivkovic, B. (2012). The impact of liquidity and size premium on equity price formation in Serbia. Economic Annals, 57(195), 43–78. https://doi.org/10.2298/EKA1295043M
- Ng, L., Wu, F., Yu, J., & Zhang, B. (2015). Foreign investor heterogeneity and stock liquidity around the world. Review of Finance, 20(5), 1867–1910. https://doi.org/10.1093/rof/rfv048
- Pastor, L., & Stambaugh, R. F. (2003). Liquidity risk and expected stock returns. Journal of Political Economy, 111(3), 642–685. https://doi.org/10.1086/374184
- Prasanna, K., & Bansal, B. (2014). Foreign institutional investments and liquidity of stock markets: Evidence from India. International Journal of Economics and Finance, 6(6), 6. https://doi.org/10.5539/ijef.v6n6p103
- Rhee, S. G., & Wang, J. (2009). Foreign institutional ownership and stock market liquidity: Evidence from Indonesia. Journal of Banking & Finance, 33(7), 1312–1324. https://doi.org/10.1016/j.jbankfin.2009.01.008
- Richards, A. (2005). Big fish in small ponds: The trading behavior and price impact of foreign investors in Asian emerging equity markets. Journal of Financial and Quantitative Analysis, 40(1), 1–27. https://doi.org/10.1017/S0022109000001721
- Sanvicente, A. Z. (2014). The foreign capital flows and the behavior of stock prices at BM&FBovespa. BAR-Brazilian Administration Review, 11(1), 86–106. https://doi.org/10.1590/S1807-76922014000100006
- Seasholes, M. S. (2004). Re-examining information asymmetries in emerging stock markets. University of California at Berkeley Working Paper.
- Sims, C. A. (1980). Macroeconomics and reality. Econometrica, 48(1), 1–48. https://doi.org/10.2307/1912017
- Soderberg, J. (2008). Do macroeconomic variables forecast changes in liquidity? An out-of-sample study on the order driven stock markets in Scandinavia (Working Paper No. 10). Vaxjo University.
- Speigel, M., & Subrahmanyam, A. (1992). Informed speculation and hedging in a noncompetitive securities market. Review of Financial Studies, 5(2), 307–329. https://doi.org/10.1093/rfs/5.2.307
- Stock, J. H., & Watson, M. W. (2001). Vector autoregressions. The Journal of Economic Perspectives, 15(4), 101–115. https://doi.org/10.1257/jep.15.4.101
- Subrahmanyam, A. (1991). Risk aversion, market liquidity, and price efficiency. Review of Financial Studies, 4(3), 417–441. https://doi.org/10.1093/rfs/4.3.417
- Udomsirikul, P., Jumreornvong, S., & Jiraporn, P. (2011). Liquidity and capital structure: The case of Thailand. Journal of Multinational Financial Management, 21(2), 106–117. https://doi.org/10.1016/j.mulfin.2010.12.008
- Vagias, D., & Van Dijk, M. A. (2011). International capital flows and liquidity. Available at SSRN 1744161.
- Verrier, T. (2010). Selected essays in stock market liquidity. Innovative XLM measure at the Frankfurt stock exchange: Cloudy skies, time of the day and the role of designated sponsors for stock market liquidity. https://ideas.repec.org/b/zbw/esthes/41600.html
- Vo, X. V. (2016). Foreign ownership and stock market liquidity-evidence from Vietnam. Afro-Asian Journal of Finance and Accounting, 6(1), 1–11. https://doi.org/10.1504/AAJFA.2016.074540
- Warther, V. A. (1995). Aggregate mutual fund flows and security returns. Journal of Financial Economics, 39(2–3), 209–235. https://doi.org/10.1016/0304-405X(95)00827-2
- Wei, C. (2010). Do foreign institutions improve stock liquidity? University of Texas at Austin Working paper.
Appendies
Appendix A: Construction of Liquidity Measures
The monthly market liquidity measures are constructed by aggregating individual firm liquidity measures. The ILLIQ ratio is constructed using the following formula;
where represents the daily stock Amihud (Citation2002) measure,
is the daily stock return, and
is the daily stock trading volume,
is the daily price for stock
. This measure prominently captures the price impact measure of trades. On the other hand, Liu’s (Citation2006) measure emphasizes on the transaction cost dimension of liquidity (as manifested by stock non-trading). In particular, Liu’s measure (subsequently referred as LM) is generated using the following formula:
where denotes Liu’s (Citation2006) measure for stock
in time
.
represents the number of zero daily trading volumes of stock
in time
,
is the turnover ratio of stock
in time
,
is the total number of trading days for stock
in time
, and
is the deflator designed such that the following condition holds;
Further, equation (A.2) has the property that if two stocks happen to have the same number of zero volume days in a period; then, the turnover adjustment acts as a tie-breaker. Additionally, due to variations in the total number of trading days in different months, the last term in equation (A.2) standardizes the trading days to 21 in each month, making comparison over time meaningful.
Hui and Heubel (Citation1984)’s measure relates stock price changes to turnover. The formula for constructing this measure is as follows;
where and
are the high and low prices for stock
on day
,
is the shillings traded volume for stock
on day
,
is the outstanding shares of stock
on day
, and
is the average closing price for stock
on day
. The interpretation of HH is that a liquid stock should not exhibit a high price variation due to a high turnover. Thus, besides reflecting the price impact of trades, the HH measure also captures the resilience dimension of a stock’s liquidity.
Further, to simultaneously capture several dimensions of illiquidity, Butler et al. (Citation2005) construct a liquidity index consisting of multiple liquidity proxies. The procedure of constructing the index is as follows: for each stock and liquidity measure, each observation is ranked from the least liquid to most liquid observation, next, the average of the ranks across the K (in our case four) liquidity measures is obtained, finally, the average rank for each observation is scaled by the number of observations, N, to bind the liquidity index between zero (least liquid) and one (most liquid). Mathematically, the liquidity index is cast as follows:
where is the kth liquidity proxy (such as TURN) for stock
.
Appendix B: VAR Diagnostic Tests
Appendix C: VAR regression results