
 ?Mathematical formulae have been encoded as MathML and are displayed in this HTML version using MathJax in order to improve their display. Uncheck the box to turn MathJax off. This feature requires Javascript. Click on a formula to zoom.
Abstract
The purpose of this paper is to estimate the dynamic impact of trade openness on economic growth in Botswana using the ARDL bounds testing approach. The study employs four different proxies for trade openness, which include trade-based measures and a composite index. The trade-based measures capture the effects of total trade, exports, and imports while the composite index takes country size and geography into account. The use of four different indicators in this study enables a broader analysis of how different forms of trade openness affect economic growth. Evidence from the results points to the significance of total trade and exports in promoting economic growth in Botswana, but also the lack of growth impetus from imports. Specifically, the results reveal that when the ratio of total trade to GDP, the ratio of exports to GDP, and the trade openness index are used as proxies of trade openness, then trade openness has a significant, positive impact on economic growth in both the short run and the long run. However, when the ratio of imports to GDP is used as a proxy for openness, the study fails to find any significant impact of trade openness on economic growth in both the short run and the long run. Based on these findings, this study recommends that Botswana should pursue policies that boost the exports and total trade. However, there is a need for the country to revisit its combination of imports to enable significant growth-enhancing effects from the imports sector.
PUBLIC INTEREST STATEMENT
This study explores the impact of trade openness on economic growth in Botswana, one of the fastest growing economies in sub-Saharan Africa. The study employs four indicators of trade openness, namely, the ratio of total trade to gross domestic product (GDP), the ratio of exports to GDP, the ratio of imports to GDP, and an index that accounts for growth effects of trade openness when country size and geography are taken into consideration. The study further includes a dummy variable to account for changes in trade policy from import substitution to export promotion. The study findings reveal that trade openness is significant in improving economic growth in Botswana, as confirmed by three of the four indicators of trade openness employed in analysis. These findings suggest that Botswana may use trade openness as one of its strategic measures for addressing the objective of sustainable economic growth.
1. Introduction
Since the arrival of modern transport, international trade has been an integral part of Botswana’s economy, and trade-related activities count significantly in the country’s gross domestic product (GDP). After attaining independence in 1966, Botswana has not ceased to pursue trade-related interventions and growth-enabling strategies that assist the country’s broader economic objectives. Looking at the country’s past strategic plans, including the latest National Development Plan (NDP) 11, sustainable economic growth has stood out as a key target area (see Republic of Botswana, Citation2016).
In terms of macroeconomic performance, Botswana is one of the fastest growing economies in Sub-Saharan Africa, currently operating under export promoting trade regime. The country has historically enjoyed one of the highest growth rates in the world (US Department of Commerce, Citation2019). Nevertheless, trends in data show that the country’s level of trade openness has been declining recently, although the country’s annual growth rates have been far above the sub-Saharan African average (see World Bank, Citation2018). Yet in the existing literature on trade openness and economic growth, the magnitude of the impact of trade openness on economic growth in Botswana remains unclear, which has motivated the current study.
Looking at previous empirical studies conducted on trade openness and economic growth, few studies, if any, have analysed the impact of trade openness on economic growth in Botswana at a country-based level. Conclusions from most of the previous studies were drawn for a group of countries and not for Botswana as such. For example, Kandiero and Chitiga (Citation2006) analysed the impact of trade openness on economic growth in 50 African countries using the ratio of trade to GDP as a measure of trade openness. Chang and Mendy (Citation2012) also examined the effects of trade openness on economic growth in Africa focusing on 36 countries using the total amount of exports and total amount of imports and the ratio of exports plus imports to GDP as proxies for trade openness. Likewise, Sakyi et al. (Citation2014) investigated the relationship between trade openness and economic growth in 115 developing countries, which were grouped into low-income countries, upper-middle-income countries and lower-middle-income countries. Their study employed composite trade shares as a measure of the degree of trade openness. Another cross-sectional study conducted in sub-Saharan Africa was by Zahonogo (Citation2017), who estimated the impact of trade openness on economic growth for a group of 42 African countries over the period 1980 to 2012.
Against this background, the main purpose of this paper is to analyse the dynamic relationship between trade openness and economic growth in Botswana. In its empirical investigation, the current study employs the autoregressive distributed lag (ARDL) framework on data covering the period 1975 to 2014. The use of the ARDL approach allows for short- and long-run estimations of the effect of trade openness on economic growth. In line with previous studies with a similar approach to other sub-Saharan African countries, the current study employs three trade-based measures and a composite index of trade openness (see, for example, Malefane & Odhiambo, Citation2018). The trade-based indicators of trade openness used in this study are computed from the ratio of trade to gross domestic product (GDP), the ratio of exports to GDP, and the ratio of imports to GDP.
Through employing various proxies of trade openness, this study can examine how each of the selected four aspects of openness affects economic growth in Botswana, which serves as one of the envisaged contributions of the study. Influenced by existing literature on endogenous growth, this study hypothesises that trade openness has a positive effect on economic growth in Botswana, in both the short and the long run. Endogenous growth literature demonstrates how policies that promote international trade could accelerate economic growth and improve national welfare (Grossman & Helpman, Citation1991).
The other envisaged contribution of this study is that, by taking into consideration the changes to Botswana’s trade policy from import substitution to export promotion, the findings from the current study could inform future trade policy reforms in Botswana. Following the introduction, the rest of this paper is organised as follows: Section 2 provides an overview of trade openness and economic growth in Botswana, while Section 3 reviews literature on trade openness and economic growth. Thereafter, Section 4 discusses the estimation techniques and the empirical results. Section 5 concludes the paper.
2. Trade openness and economic growth in Botswana
2.1. Overview of trade-related interventions in Botswana
Botswana’s earliest trade policy reform following the country’s independence in 1966 was the adoption of import substitution industrialisation. While the industrial development policy reflected Botswana’s industrial path at that time, its major limitation was that it focused chiefly on industry production for the domestic market. Since 1998, Botswana’s trade policy has moved towards an export-led growth strategy, in which the Government of Botswana committed itself to promoting diversification in its economy through export-led industrialisation (WTO, Citation1998). In line with this commitment the government has, since 1997, developed new policy frameworks to assist in achieving the country’s trade and investment goals.
Among the key trade-supporting policies and legislation that Botswana adopted as part of its economic reforms are the National Development Plan 10 (NDP 10), the Industrial Development Policy, the Competition Policy, Botswana’s National Export Strategy, the Investment Strategy for Botswana, and the Private Sector Development Strategy (Republic of Botswana, Citation2009). The adoption of National Development Plan 10, together with the implementation of Botswana’s Vision 2016, has assisted the country in addressing key issues relating to trade openness. In a way, the implementation of National Development Plan 10 and Botswana’s Vision 2016 addresses the diversification of Botswana’s economy, a vital element in its growth (OECD, Citation2008).
Over and above economic diversification and private sector development, Botswana’s trade openness has also been influenced by increased internal policy effectiveness. During 2013, for instance, the Mid-Term Review of National Development Plan 10 (NDP 10) was carried out with the aim of identifying issues needing critical attention during the second phase of NDP 10. In that review, emphasis was placed on efficient resource allocation and on increased policy effectiveness. In addition to these, macroeconomic stability, increased global competitiveness, better governance and factor productivity were emphasised (Republic of Botswana, Citation2013).
While Botswana has made efforts to reform its trade and development strategies, the country’s trade continues to be characterised largely by a dominance of primary sector exports, particularly diamonds and copper/nickel products. For instance, in 2008, the share of mining in the total exports was 85% (Republic of Botswana, Citation2009, p. 2). Similarly, in April 2019, diamonds still dominated Botswana’s principal exports with a 93.4% share of the country’s principal exports (Statistics Botswana, Citation2019, p. 7).
2.2. Trends in trade openness and economic growth in Botswana
Figure shows trends in trade openness and economic growth in Botswana from 1960 to 2014. It shows that Botswana’s trade openness—as measured by the ratio of total trade to GDP—was on an upward trend until 1965. From then until 1969 it fluctuated. After that it continued a steady upward path until 1978, where some fluctuations occurred, followed by a significant decline between 1987 and 1993. The past two decades have been characterised by fluctuations in Botswana’s trade openness, although an evident upward trend was observed between 2010 and 2014.
Overall, the observed pattern in Botswana’s trade openness during the period reviewed reflects major historic developments in the country, including the discoveries of diamond and cupronickel deposits in the late 1960s, but also the country’s economic recession of the early 1980s (see Dahl, Citation1981; Gaolathe, Citation1997). Moreover, the changes in country’s trade policy that helped export diversification and private sector development in recent decades could also have contributed to the opening of Botswana’s economy, and so to increased trade openness.
In addition to trends in trade openness, Figure depicts the movements in Botswana’s economic growth, measured by changes in real GDP per capita. The figure exhibits moderate growth rates in the early 1960 s, followed by a significant upsurge from 1967 to 1972. Apart from 1998, 2001 and 2009, during which negative growth rates were recorded, Botswana’s economic growth has remained positive during the period reviewed.
Figure 1. Trends in trade openness and economic growth in Botswana (1960–2014).
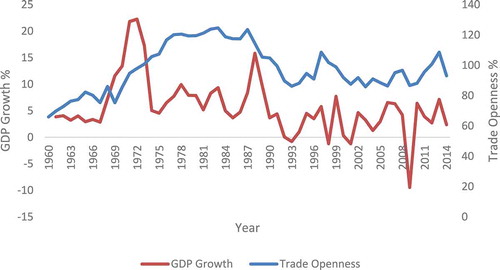
Constructed by author using data from World Bank (Citation2016), World Development Indicators.
3. Literature review
3.1. Theoretical linkages between trade openness and economic growth
Trade openness may affect economic growth through various channels including government policy, reallocation, and distribution of resources. Regarding government policy, the argument is that trade openness may induce domestic economies to adopt policies that improve the competitive environment for domestic firms that trade internationally (Wacziarg, Citation2001). In this view, the more open an economy is, the more likely it is to implement stable macroeconomic policies. This argument is consistent with Fischer (Citation1992), who maintained that stable macroeconomic policies are associated with sustained economic growth.
Apart from government policy, trade openness may also affect economic growth through the allocation and distribution of resources. So economies that are more open to trade are more likely to be associated with efficiency in resource allocation. The main reasons why open economies are more likely to have an efficient allocation of resources than closed economies include minimal price distortions and specialisation (Wacziarg, Citation2001). The argument is that since open economies tend to set their prices of tradable goods in line with the world market prices, this could result in a lower degree of price distortion and a more efficient allocation of resources (Wacziarg, Citation2001).
Trade openness may also affect economic growth through the sectoral allocation of resources. Essentially, if trade results in the reallocation of resources, say from the manufacturing sector to the research and development (R&D) sector, there could be an increase in the rate of knowledge accumulation emanating from the increase in the amount of resources devoted to R&D. The increase in the rate of knowledge accumulation contributes to greater innovation, which is regarded as one of the engines of growth. (Rivera-Batiz & Romer, Citation1991).
3.2. Empirical evidence on trade openness and economic growth
Several empirical studies of various regions have attempted to examine the effect of trade openness on economic growth. Most of these studies have been cross-sectional, although some are country-specific. The results of these studies are mixed, although the overall indication is that trade openness has a significant positive effect on economic growth. In one of the earlier studies, Karras (Citation2003) investigated the effect of trade openness on economic growth using two panel data sets covering the periods 1951–1998 and 1960–1997 for 56 different countries. Using the ratio of exports plus imports as a proxy for trade openness, the study found that trade openness had a significant positive effect on economic growth. In a recent study exploring the effects of trade openness in major developing and developed economies, Rahman et al. (Citation2017) found evidence of bi-directional causality between trade openness and economic growth in all the countries studied.
In a study based in Bangladesh, Hassan (Citation2005) investigated the relationship between trade openness and economic growth for the period 1994–2003. The study found a long-run equilibrium relationship between trade openness and economic growth in Bangladesh, and a unidirectional causality running from trade openness to economic growth. On the other hand, a study conducted in Bangladesh by Adhikary (Citation2011) found that trade openness had a negative but diminishing influence on economic growth during the period 1986–2008.
Apart from studies from Bangladesh, other studies conducted in Asia show mixed results regarding the effect of trade openness on economic growth. For instance, Hye and Lau (Citation2015) employed a composite trade openness index to examine the link between trade openness and economic growth in India during the period 1979–2009. The results showed that trade openness had a positive effect on economic growth in the short run, but a negative effect in the long run. In another study, Klasra (Citation2011) investigated the long-run relationship between trade openness and economic growth in Pakistan and Turkey during the period 1975–2004. The results showed a positive long-run relationship between trade openness and economic growth in Pakistan, but not in Turkey.
Using random and fixed effects models to explore the relationship between trade openness and economic growth in 25 Muslim countries, Muhammad and Jian (Citation2016) found that trade openness had a significant positive effect on economic growth in the countries studied. In an empirical study in an emerging country, Su et al. (Citation2019) showed that while trade openness had a positive effect on economic growth in Vietnam, the effect of inward foreign direct investment combined with openness had a substitution effect on economic growth.
Focusing on Latin America, Awokuse (Citation2008) examined whether trade openness contributes to economic growth in Argentina, Columbia and Peru using two proxies for trade openness—real exports and real imports. The results revealed that both exports and imports play a significant role in stimulating economic growth in the three countries investigated. In a study based in Fiji, Rao and Rao (Citation2009) estimated the effects of trade openness on economic growth in Fiji during the period 1972–2002 and confirmed the positive effect of trade openness on economic growth in the country. More recently, Roquez-Diaz and Escot (Citation2018) employed Granger causality based on heterogeneous panel data to determine the direction of causality between international trade and economic growth in Latin American countries. The results showed evidence of unidirectional causality from trade to growth (Chile, Peru, Nicaragua and Uruguay) or from growth to trade in some countries (Columbia, Costa Rica, Guatemala and the Dominican Republic); but also bidirectional causality in Honduras and Mexico.
In a recent empirical investigation on the effects of trade openness on economic growth conducted in Africa, Malefane and Odhiambo (Citation2018) used four different proxies of trade openness, namely, the ratio of exports and imports to GDP, the ratio of exports to GDP, the ratio of imports to GDP, and a composite index, to examine the impact of trade openness on economic growth in South Africa. The study found that although trade openness has a significant positive impact on economic growth in South Africa, the effect is insignificant when country size and geography are taken into consideration.
Zahonogo (Citation2017) investigated the effect of trade openness on economic growth in 42 sub-Saharan African countries during the period 1980–2012. The study employed the ratio of trade to GDP, the ratio of exports to GDP, and the ratio of imports to GDP as proxies for trade openness. The results revealed that trade openness had a positive and significant effect on economic growth only up to a threshold, above which the effect declined. In another recent study, Makun (Citation2017) examined the effects of trade openness on economic growth in Malaysia for the period 1980–2013 and found that trade openness had a significant positive effect on economic growth.
4. Empirical model specification and estimation techniques
4.1. Empirical model specification
To estimate the effect of trade openness on economic growth in Botswana, this study adopts, with modifications, an empirical model based on Jin (Citation2000) which was used to examine the effect of trade openness and economic growth in East Asian countries. In Jin’s (Citation2000) original specification, real gross domestic product is regressed on the measure of trade openness (imports/GDP); real government consumption expenditure; foreign shock proxied by the world consumer price index; and the narrowly defined money supply (M1).
In the current study, the initial empirical model is specified as:
As illustrated in EquationEquation (1)(1)
(1) ,
is the growth rate of real GDP per capita;
represents any one of the four proxies of trade openness (OPEN1, OPEN2, OPEN3 and OPEN4);
represents investment;
is the share of government consumption expenditure in GDP;
is the inflation rate; and
is the level of financial development. The term
is the error term, while
is the constant term.
…
are the regression coefficients.
The ARDL representation of the empirical model in EquationEquation (1)(1)
(1) is given by:
where is the difference operator;
is the lag length;
is a constant term while
represent the short-run coefficients. The terms
are long-run coefficients. One of the advantages of the ARDL approach is that it can be adopted irrespective of whether the underlying variables are I(0), I(1) or a combination of both. But, this model cannot be applied when the underlying variables are integrated of order I (2). None of the variables used in the current study were integrated of order I(2).
The choice of the ARDL approach over other approaches to cointegration was also driven by its desirability especially in studies with relatively smaller samples like the current study. According to Tang (Citation2004), in the presence of a smaller sample size, the bounds testing approach to cointegration is preferable since it is robust for small samples. Another advantage of the ARDL approach is that it corrects for possible endogeneity among the explanatory variables (Wolde-Rufael, Citation2010). Since the macroeconomic variables used in this study are likely to have an endogenous effect on each other, the ARDL approach is expected to correct the endogeneity problem.
Following the cointegration test based on EquationEquation (2)(2)
(2) , the error-correction model (ECM) for this study is expressed as
In EquationEquation (3)(3)
(3) ,
are the short-run coefficients, while
is the speed of adjustment towards a long-run equilibrium path.
is the error-correction term whereas
is the residual error term.
To account for changes is trade policy from import substitution industrialisation to export promotion in 1998, the study incorporates a dummy variable, DUM_TRADE into EquationEquations (1(1)
(1) ) and (Equation3
(3)
(3) ) in the second round of empirical estimation. This dummy variable takes value 0 for the period before 1998 and 1 from 1998 to 2014.
4.2. Variable description and data sources
This study uses annual time-series data for Botswana covering the period 1975 to 2014. All data were obtained from the World Bank’s World Development Indicators (World Bank, Citation2016). Economic growth, measured by the growth rate in real GDP per capita, is the dependent variable (GROWTH) in the growth equation. To measure trade openness, this study uses four different proxies of trade: OPEN1, OPEN 2, OPEN 3, and OPEN 4. OPEN 1 is expressed by the ratio of exports plus imports to GDP; while OPEN 2 is the ratio of exports to GDP. The third proxy, OPEN 3, is the ratio of imports to GDP whereas OPEN 4 is an index of trade openness.
The trade openness index was derived from a regression equation constructed from country size and geographic characteristics, following a modified version of Frankel and Romer (Citation1999) and UNCTAD (Citation2012). According to Frankel and Romer (Citation1999), a country’s geographic characteristics have a significant influence on trade, hence the inclusion of this index of trade openness in this current study.
Apart from the proxies of trade openness, other explanatory variables are measured as follows: the ratio of gross fixed capital formation to GDP is used as a proxy for investment (INV/GDP), whereas government consumption expenditure is measured by the ratio of final consumption expenditure to GDP (GOV/GDP). Inflation rate (INFL) is given by the annual growth rate in the consumer price index. The other explanatory variable is the ratio of liquid liabilities to gross domestic product (M2/GDP), which is a proxy for financial development. Lastly, the study also includes the trade policy dummy (DUM_TRADE), which takes value 0 prior to 1998 and 1 from 1998 onwards. Based on preliminary tests, no variables used in this study were found to be integrated of order 2.
4.3. Results and discussion
To detect the presence of unit roots, all variables were examined using three different types of unit root tests. These include the Dickey–Fuller (DF) test with generalised least squares (GLS) detrending, the Phillip–Perron test, and the Perron (Citation1997) test. The reason behind running stationarity tests is that if a series is stationary, the mean, variance and autocorrelations can be well approximated using long-time averages based on a single set of realisations (Enders, Citation2004). However, if a series is non-stationary, it will tend to drift away from its long-run mean, leading to inferences based on spurious results. Table reports the results of the unit root tests for this study.
Table 1. Unit root test results
The unit root test results reported in Table indicate that except for economic growth, all variables are non-stationary in levels. The results further indicate that after first differencing, all the variables become stationary.
Having confirmed the order of integration of the variables, the next step involves the ARDL bounds test for cointegration. Table reports the results of the ARDL bounds test.
Table 2. Results for the ARDL bounds test
Based on the results of the ARDL test, it can be concluded that there is cointegration among the variables used in all four models of this study. This is because in all four models, the calculated F-statistics are higher than the critical value bounds at 5% level of statistical significance for EquationEquation (2)(2)
(2) , EquationEquations (3
(3)
(3) ) and (4) and at 10% level of statistical significance for EquationEquation (1)
(1)
(1) .
Following the cointegration test, the long- and short-run coefficients were estimated. The optimal lag length was determined using the Schwartz information criterion (SIC). The SIC selected ARDL(1, 2,1, 2, 1, 0) for EquationEquation (1)(1)
(1) ; ARDL(1, 1, 0, 1, 0, 0) for EquationEquation (2)
(2)
(2) ; ARDL(1, 0, 2, 1, 3, 1) for EquationEquation (3)
(3)
(3) ; and ARDL(1, 2, 1, 2, 1, 0) for Equation (4). Table reports the empirical results indicating the coefficients for the short- and long-run estimations.
Table 3. Results of the long- and short-run estimations of the ARDL
Overall, the results for Botswana are consistent with some recent studies that have investigated the relationship between trade openness and economic growth in sub-Saharan Africa (see Salahuddin & Gow, Citation2016; Keho, Citation2017; Zahonogo, Citation2017). Based on the long-run results displayed in Table , there is an indication that trade openness has a significant positive effect on economic growth in all the equations except EquationEquation (3)(3)
(3) . Starting with EquationEquation (1)
(1)
(1) , the results show that an increase in the ratio of total trade to GDP in Botswana has a positive effect on economic growth in the country. Likewise, there is strong evidence from EquationEquation (2)
(2)
(2) results showing that an increase in the ratio of exports to GDP has a significant positive effect on economic growth in the long run.
Compared with the results from trade-based indices, the results for Equation 4 provide a different dimension to the current argument. In Equation 4, the trade openness index represents the residual index after purging the effects of country size and geography. Thus, based on the results of Equation 4 it can be concluded that trade openness has a significant, positive effect on economic growth in Botswana irrespective of the dynamics in country size and geography. Moreover, a positive coefficient of trade openness index indicates that the country trades more than its potential, so positive measures adopted in Botswana are likely to be correlated with high rates of economic growth.
Other long-run results reveal that investment has a significant positive effect on economic growth in the case of EquationEquation 2(2)
(2) only. The long-run results further show that in two of the four models investigated, the coefficient of government consumption expenditure is negative and statistically significant. These results are partly consistent with Amusa and Oyinlola (Citation2019), who found that aggregate government expenditure has a negative short-run effect and a positive long-run effect on economic growth in Botswana.
The long-run results regarding financial development variable (M2/GDP) indicate that bank-based financial development has a significant negative effect on economic growth in Botswana, which could be regarded as a signal for an inadequate level of financial development in the country. Although these results contradict the expectations of this study, they are consistent with Akinboade (Citation1998), who found that Botswana has a small financial sector that is predominantly characterised by a limited range of financial assess and undeveloped capital markets.
The results for the short-run estimations show that the coefficient of trade openness is positive and statistically significant for EquationEquation 1(1)
(1) , EquationEquation 2
(2)
(2) and Equation 4, as was the case with the long-run results. The short-run results further show that in all the four models, the coefficients of government expenditure variable are negative and statistically significant. These negative signs indicate that in the short run, an increase in government consumption expenditure may reduce Botswana’s economic growth. These results are consisted with Amusa and Oyinlola (Citation2019), who found that aggregate government expenditure has a negative short-run effect on economic growth in Botswana.
The results further reveal that consistent with the Mundell–Tobin effect, the inflation rate has a positive effect on Botswana’s economic growth in the short run. This is confirmed by a positive and significant coefficient of inflation rate in EquationEquation 1(1)
(1) and Equation 4. The Mundell–Tobin effect demonstrates how an increase in inflation rate could result in economic growth by causing individuals to substitute money with interest-earning assets, which subsequently leads to increased capital intensity in the economy (Epaphra, Citation2016). However, the Mundell–Tobin effect is normally more practical in low-inflation countries (Bullard & Keating, Citation1995). The short-run results in Table also show that the lagged coefficient of the error-correction term is negative and is statistically significant in all equations, indicating convergence towards long-run equilibrium.
Following the empirical estimations, the study further uses the cumulative sum of recursive residuals (CUSUM) and the cumulative sum of squares of recursive residuals (CUSUMQ) to test for model stability. The plots for the CUSUM and CUSMUQ for the first four equations estimated in this study are presented in the Appendix. Based on the plots, it can be concluded that the estimated ARDL equations are stable since the CUSUM and CUSUMQ lines do not cross the boundaries at 5% level of statistical significance.
4.4. Empirical results and discussion of the model with structural changes
Given that Botswana has undergone two major trade policy changes, which involve the import substitution industrialisation and export promotion strategy, the study further tested for structural breaks in the data, the results of which are presented in Table . The Chow breakpoint tests were performed at 1984 and 1998, which are the two distinctive periods that mark the beginning of the import substitution industrialisation and the export promotion strategy, respectively.
Table 4. Summary of the chow breakpoint test results
The results reported in Table indicate that for 1984, all the three test statistics, namely, the F-statistic, the Log-likelihood ratio, and the Wald statistic fail to reject the null hypothesis of no breaks at the specified breakpoint. This leads to the conclusion that there was no significant structural break in 1984. However, in the case of 1998, all the three test statistics reject the null hypothesis of no breaks at the specified breakpoint. This leads to the conclusion that there was a significant structural break in 1998.
Having confirmed the presence of a significant structural break in 1998, the study estimated the ARDL with an additional variable, trade policy dummy, which took value prior to 1998 and
from 1998 onwards. Table reports the short-run and long-run estimation results after the inclusion of the trade policy dummy variable. As the table shows, when the ratio of imports to GDP is employed as a proxy for trade openness, the coefficient of the trade policy dummy variable is negative and statistically significant in the long run. However, when the ratio of exports to GDP is used to measure trade openness, the coefficient of the trade policy dummy variable is positive and statistically significant, which is in line with theoretical expectations that the implementation of export promotion industrialisation could have boosted economic growth in Botswana through the increase in exports.
Table 5. Results of the long- and short-run estimations of the ARDL with trade policy dummy
The results in Table also show that with the inclusion of the trade policy dummy, trade openness has a significant, positive impact on economic growth in three of the four estimated equations, except for the case of EquationEquation 3(3)
(3) in which imports were used as a proxy for trade openness. In many ways, these findings are similar to those from the previous estimation, which have been reported in Table . Based on the overall results of this study, it can be concluded that trade openness has a positive impact on economic growth in Botswana when other dimensions of openness, except imports, are considered.
The other observation from the empirical results is that when the study accounts for the structural changes in trade policy by including the trade policy dummy variable, the coefficient of government consumption expenditure becomes significant in all the four estimated equations, although it is negative. This finding could mean that increased government consumption expenditure has worked against economic growth in Botswana post the implementation of the export promotion strategy.
5. Conclusion
Botswana is one of the fastest-growing emerging economies in southern sub-Saharan Africa and is operating on a trade policy geared towards trade promotion and diversification of exports, among other key objectives. This paper provides an empirical investigation of the dynamic relationship between trade openness on economic growth in Botswana, using four different proxies of trade openness in which each proxy addresses a different aspect of trade openness. These proxies comprise three different trade-based indicators of trade openness and an index of trade openness. The analysis further incorporates the trade policy dummy variable to allow for changes in Botswana’s trade policy. In 1998, export promotion was introduced as a strategy for the country’s industrialisation following the termination of the import substitution industrialisation.
By comparing the results of the four indicators of openness, the study reached these conclusions: when the ratio of total trade to GDP, the ratio of exports to GDP, and the trade openness index are used as proxies of trade openness, trade openness has a significant positive effect on economic growth in both the short and long run. Most importantly, the results from the trade openness index, whose coefficient was found to be significant and positive, suggest that Botswana trades more than its potential; so positive measures backing up the country’s trade policy are likely to be associated with high rates of economic growth. However, the results from this study further showed that trade openness has an insignificant effect on economic growth when the ratio of imports to GDP is used as a proxy for openness.
Further analysis of the results reveals that when the study accounts for the structural changes in trade policy, the study reaches the same conclusion that trade openness has a significant, positive impact on economic growth in Botswana both in the short run and long run, except for the case where imports ratio to GDP was used as a proxy for trade openness. The long-run recommendation that emerges from this study is that policy-makers could revisit the combination of imports in both the formal and informal sectors of Botswana’s economy so that the contribution of imports to GDP in the country could also have a significant effect on economic growth.
Based on the overall findings, it is further recommended that the policy-makers in Botswana identify other emerging sectors that can be used as bases for exports, in both the short and medium term. Thus, the adoption of appropriate all-inclusive export-promoting policies is highly recommended.
Additional information
Funding
Notes on contributors
Malefa Rose Malefane
Malefa Rose Malefane is an emerging researcher at the University of South Africa, with a special interest in international trade and development.
References
- Adhikary, B. K. (2011). FDI, trade openness, capital formation, and economic growth in Bangladesh: A linkage analysis. International Journal of Business and Management, 6(1), 16–21. https://doi.org/10.5539/ijbm.v6n1p16
- Akinboade, O. A. (1998). Financial development and economic growth in Botswana: A test for causality. Savings and Development, 22(3), 331–348. https://www.jstor.org/stable/25830662
- Amusa, K., & Oyinlola, M. A. (2019). The effectiveness of government expenditure on economic growth in Botswana. African Journal of Economic and Management Studies, 10(3), 368–384. https://doi.org/10.1108/AJEMS-03-2018-0081
- Awokuse, T. O. (2008). Trade openness and economic growth: Is growth export-led or import-led? Applied Economics, 40(2), 161–173. https://doi.org/10.1080/00036840600749490
- Bullard, J., & Keating, J. W. (1995). The long-run relationship between inflation and output in post-war economies. Journal of Monetary Economics, 36(3), 477–496. https://doi.org/10.1016/0304-3932(95)01227-3
- Chang, C., & Mendy, M. (2012). Economic growth and openness in Africa: What is the empirical relationship? Applied Economics Letters, 19(18), 1903–1907. https://doi.org/10.1080/13504851.2012.676728
- Dahl, H. E. (1981). Economic and social development in Botswana. In Harvey, C. (Ed.), Papers on the economy of Botswana. Heinemann: London.
- Enders, W. (2004). Applied econometric time series (2nd ed.). John Wiley & Sons.
- Epaphra, M. (2016). Nonlinearities in inflation and growth nexus: The case of Tanzania. https://www.preprints.org/manuscript/201608.0222/v2
- Fischer, S. (1992). Overview: The conventional wisdom and the new growth theory. https://www.kansascityfed.org/publicat/sympos/1992/s92fisch.pdf
- Frankel, J. A., & Romer, D. (1999). Does trade cause growth? The American Economic Review, 89(3), 379–399. https://doi.org/10.1257/aer.89.3.379
- Gaolathe, N. (1997). Botswana's boom and recession experience: a discussion. In Salkin, J. S., Mpabanga, D., Cowan, D., Selwe, J. and Wright, M. (eds), Aspects of the Botswana economy. Oxford Publishers: United Kingdom.
- Grossman, G. M., & Helpman, E. (1991). Trade, knowledge spillovers and growth. European Economic Review, 35(2–3), 517–526. https://doi.org/10.1016/0014-2921(91)90153-A
- Hassan, A. F. M. (2005). Trade openness and economic growth: Search for causal relationship.’. South Asian Journal of Management, 12(4), 38–51.
- Hye, Q. M. A., & Lau, W.-Y. (2015). Trade openness and economic growth: Empirical evidence from India. Journal of Business Economics and Management, 6(1), 188–205. https://doi.org/10.3846/16111699.2012.7205287
- Jin, J. C. (2000). Openness and growth: An interpretation of empirical evidence from East Asian countries. The Journal of International Trade and Economic Development, 9(9), 5–17. https://doi.org/10.1080/096381900362517
- Kandiero, T., & Chitiga, M. (2006). Trade openness and foreign direct investment in Africa. South African Journal of Economic and Management Sciences, 9(3), 355–370. https://doi.org/10.4102/sajems.v9i3.1093
- Karras, G. (2003). Trade openness and economic growth: Can we estimate the precise effect? Applied Econometrics and International Development, 3(1), 7–25.
- Keho, Y. (2017). The impact of trade openness on economic growth: The case of Côte d’Ivoire. Cogent Economics & Finance, 5(1), 1–4. https://doi.org/10.1080/23322039.2017.1332820
- Klasra, M. A. (2011). Foreign direct investment, trade openness and economic growth in Pakistan and Turkey: An investigation using bounds test. Quality and Quantity, 45(1), 223–231. https://doi.org/10.1007/s11135-009-9272-5
- Makun, K. (2017). Trade openness and economic growth in Malaysia: Some time-series analysis. Foreign Trade Review, 52(3), 157–170. https://doi.org/10.1177/0015732516663317
- Malefane, M. R., & Odhiambo, N. M. (2018). Impact of trade openness on economic growth: Empirical evidence from South Africa. Economia Internazionale/International Economics, 71(4), 387–416.
- Muhammad, F., & Jian, Z. (2016). The relationship between trade openness and economic growth in Muslim countries: An empirical investigation. Economics, 5(2), 15–19. https://doi.org/10.11648/j.eco.20160502.11
- OECD. (2008). African economic outlook: Botswana.
- Perron, P. (1997). Further evidence on breaking trend functions in macroeconomic variables. Journal of Econometrics, 80(2), 355–385. https://doi.org/10.1016/S0304-4076(97)00049-3
- Pesaran, M. H., Shin, Y., & Smith, R. J. (2001). Bounds testing approaches to the analysis of level relationships. Journal of Applied Economics, 16(3), 289–326. https://doi.org/10.1002/jae.616
- Rahman, M. M., Saidi, K., & Ben Mbarek, M. (2017). The effects of population growth, environmental quality and trade openness on economic growth: A panel data application. Journal of Economic Studies, 44(3), 456–474. https://doi.org/10.1108/JES-02-2016-0031
- Rao, B. B., & Rao, M. (2009). Openness and growth in Fiji: Some time series evidence. Applied Economics, 41(13), 1653–1662. https://doi.org/10.1080/00036840601007252
- Republic of Botswana. (2009). National trade policy for Botswana. http://www.mti.gov.bw/webfm_send/182
- Republic of Botswana. (2013). Mid-term review of NDP 10. Ministry of Finance and Development Planning.
- Republic of Botswana. (2016). National development plan 11, volume 1.
- Rivera-Batiz, L. A., & Romer, P. M. (1991). International trade with endogenous technological change. European Economic Review, 35(4), 715–721. https://doi.org/10.1016/0014-2921(91)90048-N
- Roquez-Diaz, A., & Escot, L. (2018). Relationship between trade openness and economic growth in Latin America: A causality analysis with heterogeneous panel data. Review of Development Economics, 22(2), 658–684. https://doi.org/10.1111/rode.12358
- Sakyi, D., Villaverde, J., & Maza, A. (2015). Trade openness, income levels and economic growth: The case of developing countries, 1970-2009. The Journal of International Trade and Development: An International and Comparative Review, 24(6), 860-882. https://doi.org/10.1080/09638199.2014.971422
- Salahuddin, M., & Gow, J. (2016). The effects of Internet usage, financial development and trade openness on economic growth in South Africa: A time series analysis. Telematics and Informatics, 33(4), 1 141–1 154. https://doi.org/10.1016/j.tele.2015.11.006
- Statistics Botswana. (2019). International merchandise trade statistics, monthly digest: April 2019 http://www.statsbots.org.bw/sites/default/files/publications/International%20Merchandise%20Trade%20Statistics%20%20April%202019.pdf
- Su, D. T., Nguyen, P. C., & Christophe, S. (2019). Impact of foreign direct investment, trade openness and economic institutions on growth in emerging countries: The case of Vietnam. Journal of International Studies, 12(3), 243–264. https://doi.org/10.14254/2071-8330.2019/12–3/20
- Tang, T. C. (2004). A reassessment of aggregate import demand function in the Asean-5: A cointegration analysis. The International Trade Journal, 18(3), 239–268. https://doi.org/10.1080/08853900490478131
- UNCTAD. (2012). A practical guide to trade policy analysis. United Nations.
- US Department of Commerce. (2019). Botswana – Market overview. https://www.export.gov/article?series=a0pt0000000PAtNAAW&type=Country_Commercial__kav
- Wacziarg, R. (2001). Measuring the dynamic effects from trade. The World Bank Economic Review, 15(3), 393–429. https://doi.org/10.1093/wber/15.3.393
- Wolde-Rufael, Y. (2010). Bounds test approach to cointegration and causality between nuclear energy consumption and economic growth in India. Energy Policy, 38(1), 52–58. https://doi.org/10.1016/j.enpol.2009.08.053
- World Bank. (2016). World development indicators. www.worldbank.org
- World Bank. (2018). World development indicators. www.worldbank.org
- WTO. (1998). Trade policy review: Botswana – Report by the secretariat (Report No WT/TPR/S/35). World Trade Organisation.
- Zahonogo, P. (2017). Trade and economic growth in developing countries: Evidence from sub-Saharan Africa. Journal of African Trade, 3(1–2), 41–46. https://doi.org/10.1016/j.joat.2017.02.001
Appendix.
Plots of CUSUM and CUSUMQ
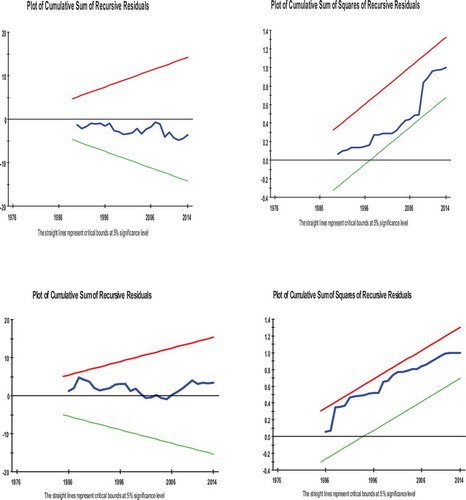
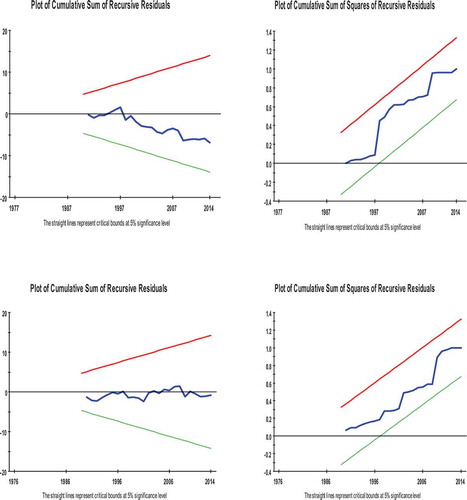
Note: The straight lines represent critical bounds at 5% significance level.