
 ?Mathematical formulae have been encoded as MathML and are displayed in this HTML version using MathJax in order to improve their display. Uncheck the box to turn MathJax off. This feature requires Javascript. Click on a formula to zoom.
Abstract
The policies in Ethiopia to advance the commercial orientation of farmers need identification of challenges at farmer level and exhaustive actions to shift the farm sector. Further activities have to be done to change the country’s present subsistence-oriented farm production system of different crops. The research has aimed at investigating factors determining the Moringa commercialization in southern Ethiopia. The cross-sectional survey method was used to identify 232 Moringa producing smallholder farmers from Wolaita and Gamo zones. Heckman’s two-step sample selection model is adopted to find factors determining the probability of Moringa market participation and the intensity of participation. The study result revealed that the likelihood of the Moringa output market participation is influenced by the variables such as location, access to irrigation, and distance to market. On the other hand family size, per capita income, frequency of extension contact, access to irrigation, access to credit, and distance to market are among significantly influencing factors of the extent of Moringa marketing. Therefore, policy agents should mainly consider these variables on any development activities to improve Moringa marketing. Furthermore, it requires improving extension services and offering immediate practical training on techniques of market-oriented and value-added Moringa production and marketing systems.
PUBLIC INTEREST STATEMENT
It is known that agriculture is the mainstay for the Ethiopian economy. However, the sector is embedded with several constraints. It is perceived that advancing the commercial orientation of smallholder farmers will have higher implications in improving the country’s agricultural sector. The process should consider untapped, highly valuable, and indigenous tree potentials including Moringa. The recent activities to better utilize Moringa from different sides should be appreciated. However, it still requires more attention for the ample of benefits could be obtained from it. The research has observed the determinants of Moringa marketing in southern Ethiopia. It informs policymakers to act on the possible means and interventions which can be employed to improve marketing of the Moringa tree.
1. Introduction
According to Ebert (Citation2014), the Moringaceae family includes 13 species that fitting into three broad life forms with different geographic origins. Four species fitting to the group of bottle trees with bloated water-storing trunks: Moringa drouhardii (Madagascar), Moringa hildebrandtii (Madagascar), Moringa ovalifolia (Namibia and southwest Angola), and Moringa stenopetala (Kenya and Ethiopia). Another three Moringa species are characterized by slender trees with a tuberous juvenile stage: Moringa concanensis (India), Moringa oleifera (India), and Moringa peregrina (Red Sea, Arabia, and the Horn of Africa). The other six tuberous Moringa species are originated in northeast Africa: Moringa arboreal (northeast Kenya), Moringa borazine (Kenya and Somalia), and Moringa longituba (Kenya, Ethiopia, and Somalia), and Moringa pygmaea (northern Somalia), and Moringa rivae (Kenya and Ethiopia), and Moringa ruspoliana (Kenya, Ethiopia, and Somalia). Most dominantly Moringa stenopetela and Moringa oleifera are becoming suppliers of multiple benefits in the South and the recently introduced other parts of the country (Ethiopia Public Health Institute (EPHI), Citation2014). Moringa tree, locally well known as Shiferaw, Halako, or Aleko in Ethiopia, is getting great popularity although little is studied to understand its various aspects.
As Gonzalez and van der Maden (Citation2015) pointed out in Bangladesh and other developing countries Moringa trees have great potential in terms of nutrition security and income generation, but often seem to be underutilized. In Ethiopia, it is indicated that there is high interest from the government side to increase the commercialization of high valued commodities (Ministery of Finance and Economic Development (MoFED), Citation2010). Following this interest and natural value of Moringa in the recent period’s various private projects involved in Moringa production (Ethiopia Public Health Institute (EPHI), Citation2014).
Furthermore, Teshome et al. (Citation2013) discussed the increasing marketing of Moringa in various parts of the country. It is also indicated that Moringa is the handled and traded commodity in the local and Addis Ababa markets. Moringa processing can be seen as one of the untapped potentials and highly valuable income-generating activities in developing countries, with its high rate of improvement and increasing local as well as international demand. Moreover, as Ethiopia Public Health Institute (EPHI) (Citation2014) also indicated Moringa has become one of the much growing and traded commodities in different parts of the country for its benefits. The consumption of its leaves both in powder or dried form has been increasing; production is growing and new businesses are flourishing. Private businesses including small and informal businesses are dominating the emerging markets. Some investors are creating value chains for their production. The institute urged the proper development, efficiency, and competitiveness of the sector, as well as the marketing of its products, should assist in the quest for accelerated industrial growth and poverty alleviation in the country. However, Moringa leaf is sold at a very cheap price of about 10–20 Ethiopian Birr (ETB) per kilogram (Kg) in the local market as a cabbage in the research area (personal observation). That is about 0.75 USD in the current country’s exchange rate.
The literature indicates that smallholder agricultural commercialization broadly related with institutional factors, infrastructural and market-related factors, household resource endowments, and household-specific characteristics (Abera, Citation2009; Bekele et al., Citation2010; Gebremedhin & Jaleta, Citation2010; Jaleta et al., Citation2009; Pender & Alemu, Citation2007). As to the knowledge of authors, there are very limited studies conducted in the analysis of Moringa commercialization in the country as well as in the world.
Solving the smallholder farmer’s Moringa commercialization challenges at the district and regional level through a well-designed policy will have a great implication in shifting the subsistent agriculture sector. Particularly the Moringa market in the country requires proper attention. If properly managed, it will have big implications for the national economy. Therefore, it is urged to identify the factors that determine the Moringa commercialization of smallholder farms at the district and regional level to use it as an input in policy designing. This study identified specific factors determining Moringa commercialization in the southern part of Ethiopia where no past empirical evidence addressed the issue in the area.
2. Methodology
2.1. Description of the study area
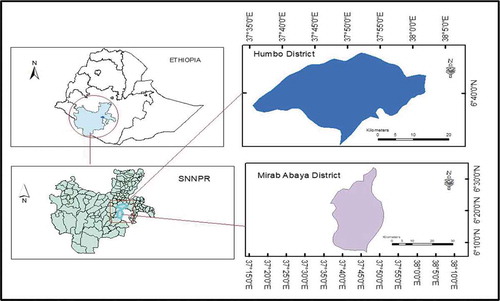
Wolaita and Gamo Gofa are among the main growing zones of Moringa. South Omo, Gamo Gofa, Kaffa, Sheka, Bench Maji, Wolaita, Dawro, Bale, Borena, Sidama, Burji, Amaro, Konso and Darashe are the main Moringa cultivating zones and special districts of Ethiopia (Edwards et al., Citation2000). Wolaita and Gofa zones are two neighboring zones among more than 13 zones in the Southern Nations Nationalities and Peoples Regional (SNNPR) State of Ethiopia where Moringa is widely produced. Wolaita and Gamo Gofa zones are located in between 350–500 km south of Addis Ababa on the Sodo Gamo Gofa main road. Wolaita zone is subdivided into 12 districts. The zone has a total area of 4512 square kilometers, administratively divided into 12 districts (locally termed woredas). As to the 2007 census conducted by the Central Statistical Agency (CSA) of Ethiopia, the total population of the zone is nearly 2,473,190. Gamo Gofa zone has a total area of 18,010.99 square kilometers, administratively divided into 18 districts (locally termed woredas). Based on the 2007 census conducted by the CSA, the zone has a total population of 1,593,104. Figure below shows the study area map.
Figure 1. Map of the study areas.
2.2. Data sources and collection methods
The study used both primary and secondary data. The primary data was collected from sample respondents and key informants using a household questionnaire and key informant discussion, respectively. Market and marketing data collected are such as market prices of Moringa output from different market agents (producer, broker, retailer, and consumer), amount of Moringa sold per household per year in market and pattern of Moringa selling, places, and challenges in selling Moringa output. Data also collected on household and community characteristics such as age, income, marital status, sex, livestock and asset holdings, family size, land size, credit access, irrigation access, education, distance from infrastructural and social services, etc. Besides secondary data on Moringa production of zonal and district level, and price of Moringa output from different market agents (producer, broker, retailer, and consumer), etc. in the zones were collected from different sources, such as government institutions, the kebele administrations, trade offices and websites. Published and unpublished documents were also extensively consulted to secure relevant secondary information.
2.3. Sampling procedures
First, the required information for the study was mainly obtained from cross-sectional primary data through a structured household questionnaire. The selection of Moringa growing smallholder farmers used a multi-stage sampling technique. That is in the first stage, two random zones selected from the many other Moringa producing zones in the southern region. Secondly, two Moringa growing districts Humbo and Mirab Abaya identified purposely based on their dominance to grow Moringa in Wolaita and Gamo zones, respectively. Thirdly, four Moringa growing kebeles from each district were selected randomly from among other Moringa growing kebeles (the smallest administrative unit in Ethiopia). Abala Faracho, Abala Kolshobo, Buke Dongola, and Abala Longena kebeles from Wolaita zone and Wanke Wajifo, Kola Barana, Yayike, and Delbo kebeles from Gamo zone were selected. In the fourth stage, based on proportional to the total sizes of Moringa growing households in each kebele, respondents were selected from respective kebeles. Finally, simple random sampling with replacement was used to obtain 232 Moring growing respondents in the sampled kebeles.
2.4. Methods of data analysis
The Stata (version 14) statistical software package was used for data recording and analysis. The quantitative data collected on producer’s socio-economic, demographic, and community characteristics; the quantity of Moringa produced and marketed were analyzed by using descriptive and inferential statistics such as means, standard deviation, and mean difference (T and chi-square tests). The Heckman two-step sample selection Econometric model was used to examine factors affecting the smallholder Moringa producing household probability to participate in the Moringa market and degree of market participation. The model helps to identify the factors that affect smallholder farmer’s decision to participate in the Moringa market and evaluate the factors that affect the intensity of market participation, level of commercialization (HCI). This model adopted on the basis that it models the market participation decision as a two-step process that involves first the household deciding on whether or not to participate in the Moringa market and then the extent of participation, level of commercialization. The household commercialization index (HCI) of Moringa is implemented to capture the household level of Moringa commercialization, the extent of Moringa market participation. It is computed as the ratio of the gross value of Moringa sold to the gross value of Moringa produced that is taken by expecting to better explain Moringa commercialization than the commonly used gross amount sold. Here, the level of Moringa commercialization of Moringa producers was analyzed from the output side. Precisely, the HCI formula implemented here by following Von Braun et al. (Citation1991) and Von Braun and Kennedy (Citation1994) as expressed in Equationequation (1)(1)
(1) below:
Where: HCIi = Commercialization index of ith household in Moringa sales expressed in percentage.
The observed outcome of Moringa market participation can be modeled under the framework of a random utility function. Consider the ith Moringa producing household facing a decision on whether or not to market Moringa output. Let C* denote the difference between the benefit the smallholder farm household derives from marketing Moringa (EiA) and the benefit from non-market participation (EiO). Considering the axiom of rationality and profit maximization, the smallholder farm household will participate in Moringa market if
The net benefit C is unobservable and can be expressed as a function of observed characteristics
(Zi) and error term (εi) as follows:
Where C is a dummy variable representing Moringa market participation decision; C = 1, if Moringa is marketed and C = 0, if otherwise. Zi is a vector denoting household characteristic, farm-specific, and other institutional or policy variables, β is a vector of parameters to be estimated, and εi is an error term. It is expected that not all Moringa producing households will participate in the Moringa market. In such a situation, the fundamental econometric problem that is most likely to arise is the sample selection bias. The selection bias has aroused due to the existence of sales from a subset of households who participated in the Moringa markets. This is very necessary for the market participation variable but it is not observed for the sample as a whole. By excluding individuals who are non-market participants means the dependent variable is censored and the residuals may not satisfy the condition that the sum of residuals must be equal to zero (Maddala, Citation1977; Maddala, Citation1986). In this study, the problem of sample selection bias was resolved by the use of the Heckman two-step sample selection estimation procedure (Heckman, Citation1976).
Thus, Moringa market participation involves a two-stage process: the first stage has to do with the probability of participating in Moringa marketing using the Probit maximum likelihood function. The second stage takes into consideration the extent (intensity) to which a Moringa farmer participates in Moringa marketing (level of Moringa commercialization) and this is done through Ordinary Least Square (OLS) estimator. Because the later decision largely depends on that taken in the former, likely, the procedure in the second stage is not random thereby creating selectivity bias. This is due to only those who are positively affected by the determinants of market participation will more participate in Moringa marketing. Thus, Heckman’s two-stage sample selection model used to correct for the sample selection bias (Heckman, Citation1976). The first step of Heckman’s model (selection equation) is given by:
Where F* is an unobserved latent variable representing household market participation decision, Xi is a vector of explanatory variables, β is a vector of parameters to be estimated, and εi is an error term distributed with mean 0 and variance 1. The observed dummy variable can be expressed as:
The substantive equation (the second step) which is usually estimated by an Ordinary Least Square (OLS) estimator is given as:
It should be noted that Equationequation (6)(6)
(6) is a sub-sample of Equationequation (2)
(2)
(2) and is only estimated for Moringa market participants. For the correction for self-selection biases in the substantive Equationequation (8)
(8)
(8) , and Inverse Mills Ratio (IMR) represented by the symbol λ as an extra explanatory variable is added. The computed IMR provides OLS selection corrected estimates (Greene, Citation2003). The IMR is estimated as the ratio of the ordinate of a standard normal to the tail area of the distribution (Greene, Citation2003).
Declining to add the IMR will reduce the results from Equationequation (6)(6)
(6) bias (Heckman, Citation1976). Adding IMR translates EquationEquation (4)
(4)
(4) into EquationEquation (5)
(5)
(5) as:
Where; δi is the coefficient of the IMR (λi). If lambda (λ) is statistically significant, sample selection bias is a problem and, therefore, Heckman’s two-stage sample selection model is appropriate for the estimation (Marchenko & Genton, Citation2012). The formulation process of IMR is given by:
Where; φ and are normal probability density function and cumulative density function, respectively of the standard normal distribution, and
≡ (ωiχ). μi is a two-sided error term with N(0,σ2 v):
EquationEquation (8)(8)
(8) is obtained by an extrapolation process of Probit Equationequation (2)
(2)
(2) with the substantive equation defined by OLS Equationequation (6)
(6)
(6) and then integrate it into the equation defined by Equationequation (7)
(7)
(7) . In general, the model computes the inverse mills ratio from the Probit regression and uses it as a regressor with other explanatory variables to explain the outcome of the dependent variable.
Table explains and hypothesizes the relations of the dependent, outcome, and explanatory variables used in the study.
Table 1. Variables and proposed hypotheses
3. Results and discussion
3.1. Statistical summary of moringa market participants and non-participants
This part briefly discusses and explains the results of the demographic and socio-economic characteristics of sampled Moringa producing households. The statistical summary provided in Table below shows the proportion of Moringa producers who participated in the Moringa market (131) and non-participated (101). From sampled respondents, 57% participated in the market. The mean level of Moringa commercialization is 19.73% which varies across sample households with the highest 80% and the lowest zero. That is market participants on average sold 19.54% of their yearly Moringa product, leaf. It is indicated that (147) 63.36% of sample households are subsistent, (67) 28.87% in transition, and (18) 7.75% are commercialized farmers. The market participants in average received 391.70 ETB yearly incomes from selling Moringa leaf. About 43% have not participated in the Moringa market. The statistical summary result also shows the difference between market participants and non-participants in selected variables of demographic and socio-economic characteristics.
Table 2. Statistical summary of sampled Moringa market participants and non-participants
The age of household head, family size, household head level of education, livestock holding, farm experience, household per capita income, and land size of the selected Moringa producers are not significantly different. Moreover, the frequency of extension contact and access to irrigation there is no significant difference among market participants and non-participants. The numbers of market participants and non-participants living in Wolaita and Gamo zones are also not significantly different.
However, in some other variables, Moringa market participants and non-participants are significantly different. The socio-economic variables such as cooperative membership, access to credit, distance to the main road, and distance to the market, the participants and non-participants are significantly different.
The percent of cooperative members participated in the Moringa leaf market (38%) is lower than that of non–participants (60%). Moreover, from non-participants (38%), market participants in mean accessed less credit (26%). In contrast, Moringa market participants live in the nearest distance (0.48) to the main road than non-participants (0.76). Similarly, non-market participants are living in a long-distance in km (0.05) to the local market than market participants (0.04).
Nevertheless, to better infer the determinants of Moringa market participation and no extent of participation, the Heckman two-stage sample selection model is used as discussed in the latter part.
3.2. Determinants of Moringa market participation and intensity of participation
The works of the literature indicated that there are macro-level and micro-level factors determining the decision or willingness of smallholder farmers to participate (or not) in the output market. In this study, the whole focus is on identifying which factors specifically determining likelihood to participate in Moringa market and extent of participation
The Heckman two-step sample selection model is adopted to find determinants of probability to participate Moringa market and the intensity of participation, level of commercialization. As explained above the model considered on the basis that it models the market participation decision as a two-step process that involves first the household decision whether or not to participate in the Moringa market and then the extent of participation. The model computes the inverse mills ratio from the Probit regression and uses it as a regressor with other explanatory variables to explain the outcome of the dependent variable. The Lamda is used as the correction factor to capture sample selectivity bias. The estimated result of the Heckman two-stage selection econometric model in Table used in the current research also shows the existence of sample selectivity bias. This is indicated in the statistically significant inverse mills ratio (IMR) in Table below. The positive sign of the correction factor also shows that the unobserved factors are positively affecting both Moringa market participation decisions and the level of Moringa market participation. Moreover, positive rho also indicates that unobservable factors are positively correlated with one another.
Table 3. Heckman two-stage sample selection model estimates result of Moringa commercialization
According to the first stage analysis, the Probit (selection) model the determinants such as family size, level of education, livestock holding, farm experience, land size, the frequency of extension contact, gender (female), access to credit and comparative membership of selected respondents are significantly not different.
However, the location of the sampled householders is negative and significantly different. When comparing the market participation of Moringa producers living in the Gamo and Wolaita zone, Moringa producers in Gamo are probably better participants in the Moringa market.
Moreover, Moringa market participants have less probability to access irrigation than non-market participants. This finding is inconsistent with Hagos et al. (Citation2008) that indicated irrigation significantly contributes to increases in market participation. This implies households with better access to irrigation are more concerned about the production and marketing of other seasonal cash crops than perennial crops, Moringa.
Moringa market participants are more likely to live in a long distance from the market than non-market participants. This finding is similar with Akinlade, Balogun & Obisesan (Citation2016), Alemu (Citation2007), Gani and Adeoti (Citation2011), Gebremedhin and Jaleta (Citation2010), and Yisehak et al. (Citation2011) and others of who indicated that households closer to market outlets were more likely to participate in marketing activities than households living remoter to market outlets. This is due to the increased transaction costs associated with the marketing of the farmers’ agricultural produce. It is also due to that the location of farmers in respect of potential markets is an important factor in encouraging farmers to increase their sales (Aman et al., Citation2014). However, these researches are concerned about the general farm commercialization than single commodities. In contrast, Sebatta et al. (Citation2014) and Dube and Guveya (Citation2016) statement although towns offer markets for agricultural products, on the other hand, the nearer the farm is to a town, the higher the chances of a farmer getting off-farm employment and taking farming as a part-time weekend affair. Thus, farmers who are far from town tend to take farming as an alternative form of employment and less market Moringa output. However, the plausible explanation for the current study is households marketed Moringa output due to better access to market information and lesser transaction cost related to the nearness of the market than non-market participants.
The second stage analysis, OLS (outcome equation) considered factors affecting the level of Moringa commercialization such as the age of household head, livestock holdings, farm experience, land size, access to irrigation, gender (being female), family size, level of education, per-capita income, zone, distance to the main road, distance to market, access to irrigation, access to credit and frequency of extension contact.
Family size in adult equivalent has a positive and statistically significant effect in the level of Moringa commercialization at 1% significance levels. This indicates households with a higher amount of adults have a higher number of labor resources available to produce and provide Moringa outputs to the market. The result of this study is inconsistent with the findings of Bekele and Alemu (Citation2015), Tufa et al. (2014) and Gebremedhin et al. (Citation2009). Furthermore, the per capita income of households has a positive and statistically significant effect on the level of Moringa commercialization at 5% significance levels. The studies by Ethiopia Public Health Institute (EPHI) (Citation2014) and Teshome et al. (Citation2013), showed Moringa as a source of income for smallholder farmers, the current study, thus also shows a positive relation of the Moringa market participation and household income. This might be due to communities’ understanding of good concern about the income benefits could be obtained from the production and marketing of Moringa.
However, the distance of households from the market has a negative and statistically significant effect on the level of Moringa commercialization at 1% significance levels. It shows that by maintaining other variables constant when the number of a kilometer to the market increases by one km the level of commercializing Moringa output decreased by 2.7 kg. This finding is consistent with Edosa (Citation2018), Tufa et al. (2014), and Gebremedhin and Jaleta (Citation2010) that indicated distance to the nearest market and all-weather road detracts from crop input market participation due to its effect on increasing the marketing costs of both inputs and outputs. On another side, this finding contradicts the finding of Fredriksson et al. (Citation2017), in which the distance to sales point affects positively the proportion of output sold. The possible reason for the current side is similar to the explanation of market participation case above, it is due to better access to market information and lesser transaction cost.
Similarly, the distance of households from the main road has a negative and statistically significant effect on the level of Moringa commercialization at 1% significance levels. Even if the commodity is different this finding is consistent with Kyaw et al.’s (Citation2018) study that indicated access to the better road has resulted in higher participation of Rice farmers in the Rice market. It shows that better access to the road from rural areas to urban areas makes it easy to transport agricultural commodities to the market. Thus, it enables the transportation of more agricultural goods from farms to markets.
Access to irrigation has also a negative and statistically significant effect on the level of Moringa commercialization at 5% significance levels. This implies that households with better access to irrigation are more concerned about the production and marketing of cash crops. This finding contradicts the finding of Tufa et al. (2014) on the commercialization of Horticultural crops.
Credit access was also a statistically significant and negative effect on the level of Moringa commercialization at 5% significance levels. This implies households with better access to credit are more interested to allocate their financial resources from the credit on other household activities example for consumption purposes or use it for the production and marketing of cash crops. The result of this study is similar to Hussain and Thapa (Citation2012).
However, the frequency of extension contact positively and significantly affects the level of Moringa commercialization at 1% significance levels. This implies households with higher contact with extension agents have got better information about to make informed decisions on the production and marketing of Moringa outputs than their counterparts. Apart from the commodity difference, this finding is similar to Kyaw et al. (Citation2018) and Edosa (Citation2018).
4. Conclusions and policy implications
The current study aimed to find factors determining the participation of smallholder farmers in the Moringa output markets and factors affecting the degree of participation in the Moringa market, level of commercialization in Wolaita, and Gamo zones of SNNPR state of Ethiopia. The study result found that the overall level of Moringa commercialization in the research area is below the subsistence level with a mean level of commercialization of 19.54 percent.
It also revealed that access to irrigation and distance to the market are the main variables that are statistically significant and are the main determinants of a household likelihood to participate in the Moringa output market.
Besides, variables such as the family size, per capita income, and average frequency of extension contact are the main variables that are positively and significantly affected the household level of Moringa commercialization. Access to irrigation, access to credit, and distance to market negatively influenced the extent of Moringa commercialization.
Hence, policy agents, the office of agriculture, rural development and different administrative should mainly work on development activities in the area such as Moringa extension service to improve techniques of producing Moringa and provide value-added mechanisms of marketing Moringa, and also create better market access and chain to Moringa in the local area to surge the contribution of Moringa for local as well as the national economy. Moreover, future activities to improve Moringa production should consider household family size, per capita income, and credit access. Particularly it needs to target households with limited access to irrigation to increase Moringa production and marketing.
Acknowledgements
The authors would like to thank staff members of Humbo and Mirab Abaya district level Agricultural office for providing the required data to the study beginning from the district experts to agricultural DAs in each of the study Kebeles. Furthermore, we would like to thank two anonymous reviewers for their constructive comments and suggestions in an earlier version of the article.
Additional information
Funding
Notes on contributors
Alula Tafesse
Alula Tafesse is a Ph.D. candidate at Haramaya University, School of Agricultural Economics and Agribusiness. He is an Assistant Professor at the Department of Agricultural Economics, College of Agriculture, Wolaita Sodo University. His research interests include themes on natural resource and environmental economics, food and nutrition security, agricultural value chain analysis, impact analysis, agricultural productivity, and marketing.
Degiye Goshu
Degiye Goshu (Ph.D.) is an Associate Professor at the Department of Economics, Kotebe Metropolitan University.
Fekadu Gelaw
Fekadu Gelaw (Ph.D.) is Assistant Professor of Agricultural Economics, Institutional and Behavioral Economics, School of Agricultural Economics and Agribusiness, College of Agriculture and Environmental Sciences, Haramaya University.
Alelign Ademe
Alelign Ademe (Ph.D.) is Assistant Professor, Department of Agricultural Economics and Management, University of Swaziland.
References
- Abera, G. (2009). Commercialization of smallholder farming: Determinants and welfare outcomes. [A Cross-sectional study in Enderta District, Tigrai, Ethiopia, M. Sc. thesis], Haramaya University.
- Akinlade, R. J., Balogun, O. L., & Obisesan, A. A. (2014). Commercialization of urban vegetable farming. International Journal of Vegetable Science, 22(1), 24–15. https://doi.org/10.1080/19315260.2014.921266
- Alemu, D. (2007). Determinants of smallholder commercialization of food crops: Theory and evidence from Ethiopia (Vol. 745). Intl Food Policy Res Inst.
- Aman, T., Adam, B., & Lemma, Z. (2014). Determinants of smallholder commercialization of horticultural crops in Gemechis District, West Hararghe Zone, Ethiopia. African Journal of Agricultural Research, 9(3), 310–319. https://doi.org/10.5897/ajar2013.6935
- Bekele, A., & Alemu, D. (2015). Farm-level determinants of output commercialization: In haricot bean-based farming systems. Ethiopian Journal of Agricultural Sciences, 25(1), 61–69. https://www.ajol.info/index.php/ejas/article/view/142999
- Bekele, A., Belay, K., Legesse, B., & Lemma, T. (2010). Effects of crop commercial orientation on the productivity of smallholder farmers in drought-prone areas of the Central Rift Valley of Ethiopia. Journal of Rural Development/Nongchon-Gyeongje, 33(1071-2016-86943), 105–128. doi:10.22004/ag.econ.174481
- Dube, L., & Guveya, E. (2016). Determinants of agriculture commercialization among smallholder farmers in Manicaland and Masvingo provinces of Zimbabwe. Agricultural Science Research Journal, 6(8), 182–190. http://www.resjournals.com/wp-content/uploads/2020/04/Dube-Guveya.pdf
- Ebert, A. (2014). Potential of underutilized traditional vegetables and legume crops to contribute to food and nutritional security, income, and more sustainable production systems. Sustainability, 6(1), 319–335. https://doi.org/10.3390/su6010319
- Edosa, T. L. (2018). Determinants of commercialization of teff crop in Abay Chomen District, Horo Guduru wallaga zone, Oromia Regional State, Ethiopia. Journal of Agricultural Extension and Rural Development, 10(12), 251–259. https://doi.org/10.5897/jaerd2018.0970
- Edwards, S., Tadesse, M., Demissew, S., & Hedberg, I. (2000). Flora of Ethiopia and Eritrea, Volume 2, part 1: Magnoliaceae to Flacourtiaceae. The National Herbarium, Addis Ababa University. https://doi.org/10.2307/4110971
- Ethiopia Public Health Institute (EPHI). (2014). May 22 – 23). Opportunities and challenges of research, production, promotion of M stenopetala. Paper presented at the consultative workshop on Moringa stenopetala to maximize its potential uses, Bishoftu, Ethiopia.
- Fredriksson, L., Bailey, A., Davidova, S., Gorton, M., & Traikova, D. (2017). The commercialization of subsistence farms: Evidence from the new member states of the EU. Land Use Policy, 60, 37–47. https://doi.org/10.1016/j.landusepol.2016.10.009
- Gani, B. S., & Adeoti, A. I. (2011). Analysis of market participation and rural poverty among farmers in northern part of Taraba State, Nigeria. Journal of Economics, 2(1), 23–36. https://doi.org/10.1080/09765239.2011.11884934
- Gebremedhin, B., & Jaleta, M. (2010). Commercialization of smallholders: Is market participation enough? (No. 308-2016-5004). doi:10.22004/ag.econ.96159
- Gebremedhin, B., Jaleta, M., & Hoekstra, D. (2009). Smallholders, institutional services, and commercial transformation in Ethiopia. Agricultural Economics, 40, 773–787. https://doi.org/10.1111/j.1574-0862.2009.00414.x
- Gonzalez, Y. S., & van der Maden, E. C. L. J. (2015). Opportunities for development of the Moringa sector in Bangladesh: Desk-based review of the Moringa value chains in developing countries and end-markets in Europe (No. 15-102). Centre for Development Innovation, Wageningen UR.
- Greene, W. H. (2003). Econometric analysis. Prentice-Hall.
- Hagos, F., Makombe, G., Namara, R., & Awulachew, S. B. (2008). Does access to small scale irrigation promote market-oriented production in Ethiopia? (No. 614-2016-40817). International Water Management Institute.
- Heckman, J. J. (1976). The common structure of statistical models of truncation, sample selection and limited dependent variables and a simple estimator for such models. In Annals of economic and social measurement, 5(4), 475–492. NBER.
- Hussain, A., & Thapa, G. B. (2012). Effect of credit on agricultural commercialization and household food security: Insights of smallholders in Pakistan. Paper presented at the Conference on sustainable business in Asia (www. cosa2012. org), Bangkok.
- Jaleta, M., Gebremedhin, B., & Hoekstra, D. (2009). Smallholder commercialization: Processes, determinants, and impact.
- Kyaw, N., Ahn, S., & Lee, S. (2018). Analysis of the factors influencing market participation among smallholder rice farmers in Magway region, central dry zone of Myanmar. Sustainability, 10(12), 4441. https://doi.org/10.3390/su10124441
- Maddala, G. (1977). Econometrics. Economics handbook series. McGraw-Hills Publication Company.
- Maddala, G. S. (1986). Limited-dependent and qualitative variables in econometrics. Cambridge university press.
- Marchenko, Y. V., & Genton, M. G. (2012). A heckman selection-t model. Journal of the American Statistical Association, 107(497), 304–317. https://doi.org/10.1080/01621459.2012.656011
- Ministery of Finance and Economic Development (MoFED). (2010). ‘Growth and transformation plan (GTP) 2010/11 2014/15ʹ, draft. In: Ministry of Finance and Economic Development, Government of Ethiopia Addis Ababa.
- Pender, J. L., & Alemu, D. (2007). Determinants of smallholder commercialization of food crops: Theory and evidence from Ethiopia (No. 589-2016-39807). International Food Policy Research Institute (IFPRI).
- Sebatta, C., Mugisha, J., Katungi, E., Kashaaru, A., & Kyomugisha, H. (2014). Smallholder farmers’ decision and level of participation in the potato market in Uganda. Modern Economy, 05(8), 895–906. https://doi.org/10.4236/me.2014.58082
- Teshome, B., Kelemu, K., & Eshete, G. (2013). Commercialization of Moringa production in Ethiopia: Establishing Moringa value chain experiences and lessons.
- Von Braun, J., De Haen, H., & Blanken, J. (1991). Commercialization of agriculture under population pressure: Effects on production, consumption, and nutrition in Rwanda (Vol. 85). Intl Food Policy Res Inst.
- Von Braun, J., & Kennedy, E. T. (1994). Agricultural commercialization, economic development, and nutrition. Published for the International Food Policy Research Institute [by] Johns Hopkins University Press.
- Yisehak, K., Solomon, M., & Tadelle, M. (2011). Contribution of Moringa (Moringa stenopetala, Bac.), a highly nutritious vegetable tree, for food security in South Ethiopia: A review. Asian Journal of Applied Sciences, 4(5), 477–488. https://doi.org/10.3923/ajaps.2011.477.488