
 ?Mathematical formulae have been encoded as MathML and are displayed in this HTML version using MathJax in order to improve their display. Uncheck the box to turn MathJax off. This feature requires Javascript. Click on a formula to zoom.
Abstract
While there is a general agreement on the effectiveness of fiscal stimulus, there is no consensus on which stimulus is better. To address this concern, this paper uses a Dynamic Stochastic General Equilibrium (DSGE) model to propose a fiscal stimulus that Botswana can adopt given the slowing mining productivity. The results suggest that short-run macroeconomic stabilisation can be achieved through a cut in labour taxes. This fiscal stimulus generates larger growth multipliers and contributes relatively more employment compared to a cut in consumption tax and increases in government spending. The findings also revealed that a cut in labour taxes improves trade balance, resulting in a greater accumulation of international reserves and has no Dutch disease effects. These results suggest the need for a labour tax policy reform. These results also offer some policy options for other developing countries, which may face similar fiscal risks in future.
Keywords:
PUBLIC INTEREST STATEMENT
Understanding an effective fiscal stimulus will assist policy makers in their quest to design credible fiscal policies. It is in this regard that we calibrate a Dynamic Stochastic General Equilibrium model to provide direction towards an effective fiscal stimulus by comparing a consumption tax cut, a labour tax cut, an increase in government consumption and an increase in government investment. We find a cut in labour taxes to be a more effective fiscal stimulus as it had large fiscal multipliers, low trade deficits and resulted in a faster accumulation of international reserves. Furthermore, it is less inflationary and absorbs more people in the labour market. The policy implication is the need for a tax policy reform that prioritises labour tax cuts.
1. Introduction
The discussion of the relative importance of tax reductions versus higher government expenditure in stimulating economic activity remains unresolved in the literature. For example, one strand of literature (Alesina & Ardagna, Citation2010; Jha et al., Citation2014; Romer & Romer, Citation2010) finds tax cuts to raise growth more than increases in government spending. The other strand of the literature comprising of Perotti (Citation2005), Eggertsson (Citation2008), Van Brusselen (Citation2010), Gnip (Citation2015), and Caldara and Kamps (Citation2017) find that increases in government spending to yield larger growth dividends. Bhattarai and Trzeciakiewicz (Citation2017) find that increases in government spending leads to a better stimulus in the short run while tax cuts seem to be effective in the long run.
Delong and Summers (Citation2012) and Ilzetzki et al. (Citation2013) suggest that discussions on fiscal stimulus should consider various circumstances such as regions, exchange rate regimes, and trade openness, among other things. In line with this view, Davig and Leeper (Citation2009) show that the effects of fiscal policy stimulus differ according to various monetary policy regimes, while Christiano et al. (Citation2011) report large multipliers when the stimulus is implemented simultaneously with a zero-bound constraint on interest rates. Iwata (Citation2011) and Coenen et al. (Citation2013) find the effectiveness of fiscal stimulus in an accommodative monetary policy environment. In addition, Cacciatore and Traum (Citation2018) find reduced effects of income tax cuts when expansionary effects of government spending are driven by strong trade linkages.
Reaching a consensus on the consistent fiscal stimulus position is of particular interest to Botswana that is on the brink of a significant government revenue loss. Botswana’s fiscal policy space is expected to soften in the medium to long term, due to slow down in mineral revenue. Furthermore, the overreliance on the mining sector render the country susceptible to exogenous shocks as witnessed in the early 1980s, late 1990s, and recently in 2009. The commonality of these shocks is their adverse impact on government revenue, significant budget deficits, and deteriorations of Government Net Financial Asset (NFA) position. However, the severity of the 2009 crisis appears to have been more pronounced. Kojo (Citation2010) points out that this crisis led to the temporary closure of all mineral related activities for three months, leading to severe macroeconomic vulnerabilities. Statistics Botswana (Citation2016a) indicate that during this time, mining output and exports contracted by 35 percent and 42.2 percent, respectively. The Ministry of Finance and Development Planning Botswana (Citation2009), indicates that the overall resultant effect of these developments was a fiscal deficit of 9 billion Botswana Pula (P9 billion) and a substantial deterioration of NFA position from 41 percent as a share of GDP in 2007 to −5.3 percent in 2012. However, a much larger fiscal risk seems to be looming. According to the Ministry of Finance and Development Planning (Citation2009), mineral revenue will be depleted by the late 2020s, raising concerns of a compromised fiscal outlook.
The decline in mining revenue presents serious fiscal risks and suggests that the economy is undergoing a significant transformation. This changing landscape exposes potential fissures in the current fiscal policy model of Botswana and suggests that it is not only unstable but also exposes the government to fiscal shocks. This therefore requires a rebalancing of fiscal policy with a view of mitigating potential effects of a looming fiscal crisis and its associated macroeconomic vulnerabilities. These developments make an even stronger case for finding a consensus on the right fiscal stimulus to adopt and thus motivate this study, whose aim and contribution is to provide direction towards an effective fiscal stimulus. Finding an effective fiscal stimulus strategy will give guidance on the future of fiscal policy for Botswana and also assist authorities to design credible fiscal policies that could minimise short-run macroeconomic vulnerabilities. This study modifies the Dynamic Stochastic General Equilibrium (DSGE) model of Basdevant et al. (Citation2011) by modelling the persistence of a mining productivity shock. The analysis is conducted by comparing four single fiscal instruments. These are consumption tax cut, labour tax cut, an increase in government consumption and an increase in government investment.
The results show that in the short run, an effective fiscal stimulus is a cut in labour taxes. This strategy yields larger fiscal multipliers, has lower trade deficits and leads to a faster accumulation of international reserves. In addition, it is less inflationary and absorbs more people in the labour market. A key implication from these results is the need for a tax policy reform that prioritises labour tax cuts. Despite being calibrated for a single country, the results may guide other resource-rich countries, which are likely to face similar shocks in future.
The rest of the paper is structured as follows. Section 2 gives an overview of the fiscal developments in Botswana. Section 3 reviews the literature, while the methodology is described in section 4. Section 5 presents the results while section 6 concludes and gives policy implications.
2. Evolution of fiscal developments in Botswana
Since independence, Botswana’s fiscal policy framework has been through various stages. The initial phase occurred before the discovery of minerals and was characterized by the fiscal deficits, excessive borrowing, and dominance of foreign aid from Britain (Harvey & Lewis, Citation1990). The second phase was short lived and occurred after the new Southern African Customs Union (SACU) revenue sharing formula in 1969. The current third phase occurred after the discovery of minerals around 1970 and has prevailed for over four decades. It is during this phase that the economic landscape of the country transformed exponentially, recording substantial budget surpluses, sizeable build-up of NFA and foreign reserves. Data from Ministry of Finance and Economic Development Botswana (Citation2017) shows that during this phase, mineral receipts started taking shape in the early 1980s, and has since dominated the government resource envelope. This is despite the fact that it has been declining in recent years as depicted in Figure . Acemoglu et al. (Citation2002) and Bank of Botswana Report (Citation2007) highlight that these developments were supported by prudent management of mineral receipts, a stable political environment, and strong and institutional frameworks.
Figure 1. Evolution of sources of revenue, 1973–2016.
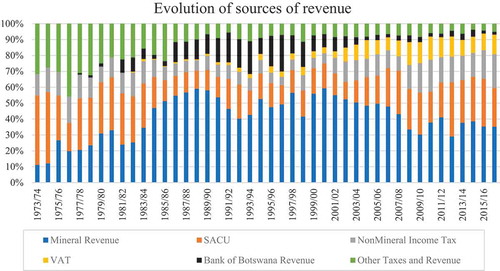
The dominance of the mining sector can be traced throughout performances of the other macro-fiscal indicators. Data from Statistics Botswana (Citation2018) shows that on average, the mining sector is still the largest single producing sector and accounts for the bigger share of GDP (25 percent) and contributes significantly to government revenue (41 percent) as well as export earnings (85 percent). Furthermore, the current account is also driven by mineral exports while the financial account shows that over half of Foreign Direct Investment is skewed towards this sector.
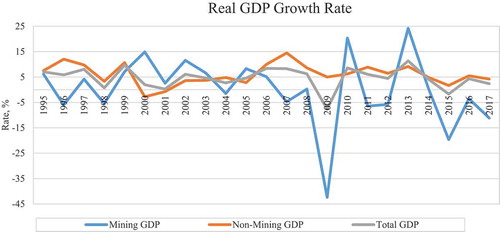
However, this dominance has weakened the country’s resistance to external shocks. For instance, around 1998 (Asian Crisis), and 2009 (global financial crisis), the economy slowed as a result of significant declines in mineral output which dragged GDP along, as shown in Figure . These developments adversely affected the fiscal position, prompting responses such as a draw down on savings, issuance of bonds and treasury bills, and budget support loans (Bank of Botswana Annual Report, Citation2014). Since then, previous high growth rates are receding due to low productivity and uncertainties in the mining sector. This heightens fears of a fiscal collapse and suggests that the third phase might be nearing completion. Dealing with this dynamism necessitates an effective fiscal policy framework that can counter the effects of such shocks. This requires strengthening fiscal policy to effectively capture economic transformations that will be visible in the fourth phase.
Figure 2. Real GDP Growth (%), 1995–2017.
3. Literature review
3.1. Theoretical literature
The framework follows the Keynesian demand theory (Keynes, Citation1936) which places greater importance on the significance of fiscal stimulus during economic slumps. The immediate impact is an increase in consumer demand, and the magnitude is measured through the multiplier effect. The entire economic short-run transmission mechanism can therefore be captured by the Mundell—Fleming model (Fleming, Citation1962; Mundell, Citation1963) and the Phillips curve (Phillips, Citation1958). In the former, consumer demand shifts the IS shifts outwards, stimulating output and generating employment. The effect is traced to the latter where inflation increases in response to rising wages and reduction in unemployment. The rise in inflation causes exchange rate movements and triggers activity in the external sector prompting the central bank to adjust short-term nominal interest rates, shifting the LM curve.
Proponents of this theory include the Post-Keynesian economists who suggest that aggregate demand shortages occur due to a firm’s inability to maximise investment. The endogenous growth theories of Romer (Citation1986) and Barro (Citation1990) as well as Easterly and Rebelo (Citation1993) also support the Keynesian theory and indicate that, by increasing public investment, fiscal policy increases the accumulation of fixed capital, which is key for economic growth.
Other schools of thought oppose Keynes’ view on the effectiveness of fiscal stimulus. These include the classical, neo-classical economists and the Austrian economists. Their central tenet is the self-regulating free markets. Their doctrine is that government intervention crowds out private sector activities and slows economic growth. Others such as Friedman (Citation1959), Krugman (Citation2010) and the New Consensus in Macroeconomics of Hemming et al. (Citation2002) downplayed the role of government in favour of monetary policy to stimulate economic activity.
3.2. Empirical literature
Divergent views on fiscal stimulus are also prevalent on the empirical side. There exists a wide coverage of literature (Riera-Crichton et al., Citation2016; Ilzetzki et al., Citation2013; Hur et al., Citation2014; Fazzari et al., Citation2015; Auerbach & Gorodnichenko, Citation2016; D’Alessandro et al., Citation2018; Ramey & Zubairy, Citation2018; Vlasov & Deryugina, Citation2018) but still has not reached a consensus on an effective fiscal stimulus. Those that are of great insight to this study are those that used the DSGE models. A summary of these studies is deduced as follows.
Drygalla et al. (Citation2017) analysed the effects of stimulus package in Germany during the great depression. The study found that much of the positive growth in Germany between 2009 and 2010 was due to the growth in government spending and adjustments in labour tax rates. The study also reports that a prolonged and sharper reduction in output was prevented by the timing of the fiscal stimulus. Li and Spencer (Citation2016) reached similar conclusions. The study investigates the effectiveness of monetary transfers to households and public investment initiatives implemented by Australia following the 2009 global financial crisis. The study estimated a 0.9 fiscal multiplier and suggested that Australia’s fiscal stimulus packages have been effective in mitigating adverse effects of the crisis.
Bhattarai and Trzeciakiewicz (Citation2017) analysed fiscal policy in the United Kingdom and found that in the short term, cuts in consumption tax were effective in stimulating economic activity, while in the medium term, a cut in capital tax was an appropriate fiscal instrument. The impact multipliers for the two instruments were recorded as −1.11 and −1.06, respectively. In the long run, an increase in government investment expenditure was found to be a relevant fiscal stimulus, generating an impact multiplier of 1.07. Labour tax cuts and transfers were found to be the least favourable stimuli in the United Kingdom due to a low share of non-Ricardian households.
Blanchard et al. (Citation2017) analysed how growth of fiscal expenditure in liquidity and non-liquidity trap environment in core economies within the Euro area affected periphery economies. The study found that, outside the liquidity trap, the effects of an expenditure stimulus on periphery GDP appeared to be low due to a tight monetary policy stance. However, in a liquidity trap, the study found larger responses of periphery GDP. Nonetheless, the length of the liquidity trap was found to influence the magnitude of these responses. In addition, the study also estimated the aggregate spending multiplier of the Eurozone to be two. This multiplier seems not to differ much from Fève and Sahuc (Citation2017) who combined the Bayesian technique with the VAR method to assess fiscal shocks in the Euro area. The assessment was conducted through two channels. The first transmission mechanism channel assumed that the Euro area was populated by non-Ricardian households, while the second channel assumed a direct impact between the marginal utility of consumption and government activities. The study found that the inclusion of government in the utility function represented the fiscal policy channel much better. The findings also revealed that the second transmission mechanism had a large fiscal multiplier of 1.75 compared to the first one.
Mucka (Citation2016) analysed fiscal policy rules in Slovakia. The study found that, in the short run, increases in social programmes and taxes can stabilise the economy and create an opportunity to improve longer-term growth prospects. The study also found that, in the long run, increases in labour taxes negatively affected the economic activity while reducing the wage bill was viewed as a better way of scaling down government spending. Erceg and Lindé (Citation2013) calibrated a two-country DSGE model and reached similar results. The study focused on a currency union and compared tax and expenditure-based fiscal consolidations. The study found that with limited monetary policy accommodation, a tax-based consolidation was more favourable in the short term than an expenditure-based one. However, the study found tax-based strategies to be more costly in the long run.
Basdevant et al. (Citation2011) calibrated a model for the Botswana, Namibia, Lesotho, and Swaziland (BNLS) to propose fiscal consolidation strategies that the countries could adopt in the wake of lower SACU transfers. The results revealed that fiscal adjustment strategies should be based on multiple fiscal instruments. Fiscal adjustment strategies that involved reductions in both public and private consumption were regarded as more effective. The study also found that all the BNLS countries, except Lesotho, favoured strategies biased towards increasing consumption tax or lowering government consumption. Furthermore, the study suggested that the fiscal consolidation strategies can be delayed through debt financing.
Overall, empirical literature on fiscal stimulus that applies DSGE models is mostly centred on developed nations and developing Asia as well as some Latin American countries, with only a handful focusing on the sub-Saharan Africa region. Therefore, to some extent, these studies have not adequately addressed specific challenges that are particular to developing economies, especially those that are on the brink of a slowing mining productivity shock as is the case in Botswana. However, even though Basdevant et al. (Citation2011) included Botswana in their calibration, they did not take into consideration the persistence of a mining shock and, similar to other literature, did not provide an answer as to which fiscal stimulus strategy should be applied when a country is faced with fiscal risk associated with the significant reduction of the mineral revenue.
4. Research methodology
The study employs the standard DSGE model and treats Botswana as a small open economy with no influence on the global mineral commodity market. The economy is assumed to have four economic agents. These are households, firms, a monetary and a fiscal authority. The next subsection describes the behaviour of these agents.
4.1. Households
Following Galí et al. (Citation2007), the study assumes that the economy has two households, namely the Ricardian (denoted by the supersubscript r) and the rule of thumb households (denoted by the supersubscript nr). The former household is assumed to have access to financial markets while the latter spend their entire current disposable income on consumption.
4.1.1. The Ricardian household
The agent derives utility from consumption () and real money balances (
whilst deriving disutility is from labour (
. EquationEquation (1)
(1)
(1) presents the agent’s discounted utility, which is expected to be maximised subject to a budget constraint shown in EquationEquation (2)
(2)
(2) .
Such that is the discount factor,
is the expectation operator at time t while
,
,
and
represents the inverse elasticities of intertemporal substitutions for (
), (
, (
and the disutility weight of (
. In EquationEquation (2)
(2)
(2) , expenditure is indicated by the left-hand side while resources are on the right. The costs includes
which is taxed at a rate
and the opportunity cost of holding real money
. It also includes purchases on government bonds (
and foreign assets (
which, in line with Schmitt-Grohe and Uribe (Citation2003) are subjected to portfolio adjustment costs
.
Resources are labour income, real interest on real money balances
,interest on both domestic
and foreign assets
. In addition, there are after tax profits from non-traded firms
as well as traded firms (
.
are the tax rebates on taxes levied on the firm’s investment capital.
,
,
, and
are remittances, transfers from government, the degree of capital mobility, user fees charged on government capital
, domestic inflation, labour taxes, and foreign inflation, respectively. A larger value of v indicates a closed capital account, and this is consistent with the economy of Botswana.
4.1.2. The rule of thumb household
The inclusion of the rule of thumb household is key for the economy of Botswana. According to Finmark Trust (Citation2014), only 50 percent of the population is banked, while around 25 percent do not have access to financial products. Arestis (Citation2011) suggests that in circumstances where such scenarios exist, changes in fiscal policy, particularly those that have direct effect on households’ disposable income will significantly affect the economy. The representative agent of this household supplies labour (, holds real money balances (
, and receives remittances (
as well as transfers from government (
. Their utility function is presented in EquationEquation (3)
(3)
(3) while their consumption is determined by the budget constraint in EquationEquation (4)
(4)
(4) .
4.2. Aggregation
Assuming that represents aggregate quantity of any variable, it can then be presented in EquationEquation (5)
(5)
(5) , as the weighted average of the Ricardian and the rule of thumb households. In this regard, the aggregate equation for consumption, labour, real money balances, domestic and foreign assets are presented as the weighted average of the two households are expressed as shown in EquationEquations (6)
(6)
(6) –(Equation10
(10)
(10) ). However, EquationEquation (10)
(10)
(10) does not apply to the rule of thumb households due to their inability to access financial products.
4.3. Firms
Similar to Melina et al. (Citation2014), this study assumes that the economy is made up of three firms. These are the non-traded goods producing sector (denoted by denoted by the supersubscript nt), the traded goods producing sector (denoted by denoted by the super subscript tr) and the natural resource sector (denoted by denoted by the super subscript m). The modelling of mineral production separately is key for Botswana and enriches the objective of the study by permitting for the analysis of various scenarios involving a shock in mining total factor productivity (TFP).
4.3.1. The non-traded goods producing sector
A monopolistically competitive firm operates in this sector and produces output ( as shown in EquationEquation (11)
(11)
(11) .
Where is TFP;
is private capital;
is labour.
and
are shares of labour and elasticity of government output, respectively. Capital in this sectors evolves as presented in Equation (12).
Where is the rate of depreciation and
is the investment expenditure.
represents the investment adjustment cost parameter. The firm’s discounted lifetime profits are maximised by EquationEquation (13)
(13)
(13) . Other terms are as previously defined.
Where indicates the before tax return to capital.
4.3.2. The traded goods producing sector
A perfectly competitive firm operates in this sector. Its output ( is produced as presented in EquationEquation (14)
(14)
(14) as function of TFP (
, labour (
and both private (
and government (
capital.
The Dutch disease effects are captured in EquationEquation (15)(15)
(15) , which assumes that the TFP is subject to externalities associated with learning by doing. The intensity of the Dutch disease is controlled by
,
.
The private capital for firm evolves as shown in EquationEquation (16)(16)
(16) . The firm maximises discounted lifetime profits as presented in Equation (17).
4.3.3. The mineral producing sector
Output ( in this sector is assumed to be exogenously produced through capital (
, productivity (
) and imported intermediate goods (
as shown in Equation (18).
evolves according to EquationEquation (19)
(18)
(18) such that total investment (
is modelled by EquationEquation (20)
(19)
(19) as foreign direct investment or FDI (
. This sector pays royalties to government with a rate (
and its net profits (
are modelled by EquationEquation (21)
(20)
(20) . The sector also pays dividends (
to the Sovereign Wealth Fund (
. EquationEquation (22)
(21)
(21) presents the total mineral revenue (
as a sum of mineral tax, dividends and interest income (
) from
.
Nominal GDP is computed in EquationEquation (23)(22)
(22) as the output from all three firms.
4.4. Monetary block
Short-term nominal interest rate ( are set according to the Taylor (Citation1993) rule process which takes into consideration the evolution of previous nominal interest rates
, the inflation gap
, the output gap
and the growth in money supply
, as shown in EquationEquation (24)
(23)
(23) .
4.5. Fiscal block
The government budget constraint is presented in EquationEquation (25)(24)
(24) with total revenue is on the left-hand side and government expenditure on the right-hand side. Total revenue is the sum of total tax revenue (
), total outstanding government debt (
,) government debt held by consumers
, and government deposits at the central ban
k and international grants (
).
is made up of personal income tax
, value-added tax
, mineral revenue (
, SACU receipts
and corporate income tax
. Total expenditure side comprise spending on investment
, consumption
, government transfers to households (
and total government debt
as well as interest paid to holders of government bonds.
is the price of
relative to CPI.
The government capital is presented in EquationEquation (26)(25)
(25) where
captures the investment efficiency.
4.6. Market clearing conditions
The model is closed by clearance that occurs in the non traded sector as shown EquationEquation (27)(26)
(26) The labour market equilibrium condition is given in EquationEquation (27)
(26)
(26) as the sum of labour provided from the two firms (nt and tr). Other market clearance occurs through the current account deficit (
in EquationEquation (29)
(28)
(28) of the balance of payments (
and EquationEquation (30)
(30)
(30) . All variables are as previously defined.
4.6.1. Balance of payments
4.7. Steady state
The steady-state values and the baseline calibration are based on observed data and economic literature. Fiscal data is collected from Ministry of Finance and Economic Development, while national accounts data and trade data are sourced from Statistics Botswana (Citation2016a), publications. Various publications from Bank of Botswana and the IMF World Economic database are also utilised in this regard. These publications suggest that average government expenditure, government investment, private investment and private consumption as shares of GDP to be 0.35, 0.15, 012 and 0.7, respectively as presented in Table . Traded and non-traded government spending to GDP shares are estimated at 0.105 and 0.245 respectively. The shares of trade balance and international reserves to GDP are set at −0.17 and 0.162, respectively, in line with balance of payments statistics. The efficiency of government investment is set below 1 as in Arestoff and Hurlin (Citation2010). Effective tax rates (labour = 0.1; consumption = 0.12 and corporates = 0.15) are in line with stylized facts.
Table 1. Steady state values
4.8. Calibration
The DSGE model is calibrated based on observed data, economic literature and where necessary coefficients from ordinary least squares estimations. The parameter values are displayed in Table . In line with standard values found in the literature, the labour income share has been set to 0.7. Similarly, the long-run Dutch disease effects on economic growth are set to 0.1 as in Berg et al. (Citation2013). The degrees of home bias in government consumption and private consumption are computed from national accounts data and are set 0.7 and 0.6 respectively. The higher degree for the former is in line with Botswana’s high wage bill and the government’s economic diversification drive of promoting locally produced goods and services. The size of the non-traded sector in Botswana and production parameters is used to compute the share of labour supplied to the non-traded sector and was found to be 0.84, which to some extent provides a more accurate picture of Botswana labour market. The preference weight on consumption for Ricardian households and the rule of thumb households are 0.992 and 0.828 respectively and accurately capture the consumption pattern in Botswana. The pattern is mostly skewed towards consumption. The elasticity of substitution of labour between this sector and traded sector of 1 is taken from Berg et al. (Citation2010) and suggests an ease of movement between the two sectors.
Table 2. Baseline calibration
The annual return on international financial assets in the resource fund is set at 2.7. This is consistent with Gros and Mayer (Citation2012). The output elasticity of public capital is set at 0.1. This suggests that there is some capacity constraints related to planning and implementing public investments in Botswana. This value is consistent with Arslanalp et al. (Citation2010) who estimated these elasticities for countries outside the Organisation for Economic Co-operation and Development (OECD). The elasticities are found to be within a range of 0.1 at the 1 year horizon up to 0.25 at the 10 year horizon. The elasticity of substitution between non-traded goods of 12 reflects mark-up power. The elasticity of substitution between traded and non-traded goods of 1.5 as well as the inverse Frisch elasticity of labour supply together with the investment adjustment cost in both the traded and non-traded sector of 2.5 are from Berg et al. (Citation2010). Furthermore, the inverse of the intertemporal elasticity of substitution for consumption is set at 2 as in M.A. Berg et al. (Citation2012). The resource production coefficient is calculated from national accounts and is within the Hamilton’s (Citation2009) estimates while sectoral depreciation rates are in line with standard literature. The preference weight on consumption for Ricardian households and their rule of thumb household counterparts, matches Botswana’s real money balances in percent of GDP.
5. Results
5.1. Consumption tax adjustment
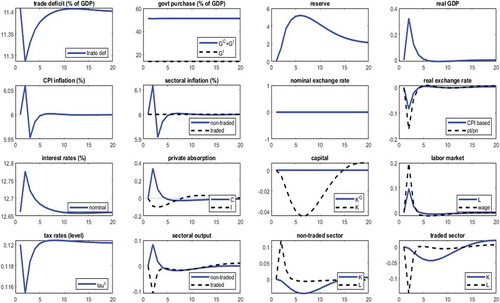
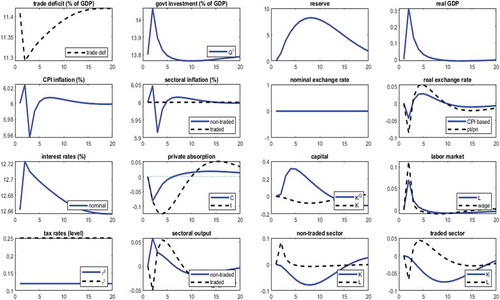
Figure shows that private consumption increases immediately when consumption taxes are adjusted downwards. This ultimately increases the demand for non-traded goods, reflecting the degree of bias towards domestically produced goods. Due to nominal price rigidities, the non—traded sector reacts to this increase in demand by supplying more goods. However, this increase in supply of goods requires more labour. This scenario amplifies the demand for labour whose effect is seen in the labour market through mobility of labour towards the non-traded sector. These developments trigger a growth in wages, which has an inflationary effect, which according to Magweva and Sibanda (Citation2020) is a negative signal for economic prospects. As a result of a fixed exchange regime, this translates to an increases in overall inflation from its steady state position to over 6 percent. This prompts the central bank to react by tightening monetary policy. These results are in line with evidence Nasir et al. (Citation2016) who also found a contractionary monetary policy response to fiscal policy expansions. Figure also shows an improvement in the trade deficit and some build-up of reserves. However, the real exchange rate appreciates simultaneously with fall in output of the traded sector, suggesting the presence of some Dutch disease effects. The overall impact of the cut in consumption tax on output is an improvement of 0.32 percent from steady state in the short run. The results are similar to Malik et al. (Citation2019) and indicate that changes in consumption predict changes in overall output.
Figure 3. Impact of consumption tax cut in response to a persistent mining productivity shock.
5.2. Labour tax adjustment
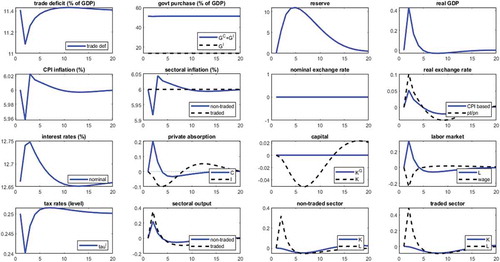
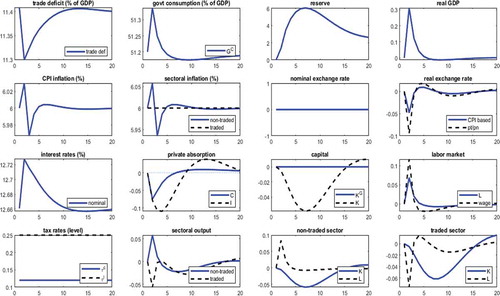
Figure shows that, cutting labour tax appears to be more advantageous than a consumption tax cut. The income effect in Figure appears to be larger this time around. This is shown by the immediate positive response of output in both sectors. This increase in output is subsequently matched by increased demand, which is more prevalent in the traded sector. However, compared to a cut in consumption tax, the increase in labour is not matched by growth in wages and appears to be less inflationary. A depreciation of the real exchange rate is then triggered by the low inflation. With a depreciated currency, there is an increase in traded output, which is accompanied by a reduction in imports, resulting in a much-improved trade deficit. The results are in line with Iyoboyi and Muftau (Citation2014) who found a link between the depreciation in exchange rate and an improvement in the trade balance. A lower trade deficit reduces pressure of foreign exchange payments and in turn translating to a faster accumulation of international reserves. This depreciation of the real exchange rate, at the same time with the growth in the traded sector, suggests no presence of Dutch disease effects. In addition, this depreciation together with the reduction in real wages may, to some extent, contribute to the country’s competitiveness and increased market sentiments in the long run. With respect to overall output, at 0.43 percent, a cut in labour tax induces larger positive GDP growth compared to a cut in consumption tax. The impact of this fiscal instrument on the economy is similar to the findings of Junior and Sampaio (Citation2014) and Jacquinot et al. (Citation2018)
Figure 4. Impact of labour tax cut in response to a persistent mining productivity shock.
5.3. Government investment
The immediate impact of this expenditure shock is a positive response in public capital as shown in Figure . However, this occurs at the expense of private capital, suggesting that some of the productive capital is channelled through the public sector, which ultimately crowds out private sector activities. An increase in investment raises the marginal productivity of capital and labour. This ultimately increases the demand for goods, particularly those from the non-traded sector due to a high degree of home bias. Labour is then reallocated to the non-tradable sector to meet this demand. This growth in labour pushes wages up and causes inflation to rise. However, the monetary policy stance seems to be less accommodative compared to a cut in labour tax and a consumption tax cut. The upward pressure in demand of non-tradable goods raises prices and the real exchange rate. This real exchange rate appreciation causes a slower improvement in trade deficit and slow accumulation of reserves compared to the fiscal stimulus that involves a cut in labour taxes. Similar to the fiscal stimulus involving a cut in consumption taxes, this real exchange rate appreciation combined with the slowing growth in traded output also suggests that the existence of the Dutch disease effects. The results are consistent with Aliyu and Tijjani (Citation2015) and Omolade et al. (Citation2019), who found the prevalence of Dutch disease effects in African countries.
Figure 5. Impact of an increase in government investment in response to a persistent mining productivity shock.
5.4. Government consumption
With respect to adjusting government consumption upwards, Figure shows that the transmission mechanism of this stimulus seems not to differ markedly from the one that involves a rise in government investment. In the current setup, the impact occurs through the goods market as opposed to the factor market in the former. The magnitude of the impact on output of the non-traded sector in the current scenario is a growth of 0.06 percent from steady state compared to 0.04 percent in the former scenario. The fall in output of the traded sectors is also more severe in this scenario than the other spending stimuli. This reflects government commitment to support domestic production. This growth of sectoral output causes a 0.07 percent increase in labour demand, which occurs more in the non-traded sector. Figure also shows that the growth of wages seems to be lower here, while inflation is more severe in the current fiscal scenario. This is in tandem with similar results of Jibir and Aluthge (Citation2019) who reports a positive nexus between inflation and government expenditure. The increase in spending government consumption also crowds out the private sector activities in the short run. These results are consistent with classical economic theories and findings from Mountford and Uhlig (Citation2009) as well as Lorusso and Pieroni (Citation2019). The real exchange rate depreciates after a one period lag and causes the prices of traded goods to be expensive, therefore reducing the traded output after a year and, in turn, dragging up real GDP. A rise in GDP and an increase in inflation prompt the central bank to increase nominal interest rates. This puts an upward pressure on rate of capital and reduces private investment. The high interest lowers current consumption due to the intertemporal effect. The presence of Dutch disease effects is also witnessed in this current fiscal strategy. The results support Primus’s (Citation2016) assertion that Dutch disease effects are significant under the government expenditure fiscal instrument.
Figure 6. Impact of an increase in government consumption in response to a persistent mining productivity shock.
5.5. Fiscal multipliers
These multipliers are computed in line with Basdevant et al. (Citation2011), as a ratio of present value of changes in cumulative nominal GDP changes over the one year ahead to the present value of the changes in cumulative nominal mineral revenue over the same period. Table shows that a cut in labour taxes yields larger multipliers across all periods. Table also shows that increasing government consumption and cutting consumption tax have lower multipliers than the other two instruments. The only strategy of which the multiplier does not decline over the period is one that involves growth in government investment. The multiplier grew to reach 0.15 suggesting sustainability in the long run. The multipliers in this study are close with those reported in the empirical literature. Petrovic et al. (Citation2014) suggest that fiscal multipliers are smaller for small open economies. Arizala et al. (Citation2017) find fiscal multipliers in the SSA region to be less than those in advanced and other emerging countries. Auerbach and Gorodnichenko (Citation2016) found that multipliers for public investment tend to be larger than those for public consumption. In emerging and developing countries, Estevão and Samaké (Citation2013) find spending multipliers to range between 0.01 and 0.5.
Table 3. Multipliers across different fiscal stimulus instruments
6. Conclusion and policy implications
The study used a DSGE model from a small open economy perspective to analyse the effect of fiscal stimuli under four scenarios, with the view of proposing an appropriate policy option for Botswana, which is on the brink of persistent mining total productivity shock. The four scenarios are consumption tax cut, labour tax cut, increase in government investment and increase in government consumption.
The results give an indication that in the short run, the dominant fiscal strategy is one that involves a cut in labour taxes. This strategy leads to the largest growth dividends, higher employment, a much improved trade balance, and a faster accumulation of reserves. In addition, this fiscal stimulus is less inflationary and has the potential to enhance competitiveness even as mining productivity continues to slow further. The results also show that all other fiscal stimuli are inflationary and have Dutch disease effects. However, increases in government spending, irrespective of whether it is channelled towards public investment or public consumption, crowded out private sector activities. The crowding of the private sector activities is detrimental to the economic growth of Botswana.
With regard to the fiscal multipliers, the results show that a cut in labour taxes has relatively larger multipliers across the period, while it is only the government investment multipliers that are found to be increasing gradually over time. These results suggest some interesting policy implications for Botswana. For instance, in order to reduce vulnerabilities to shocks in mining TFP, there is a need to redesign the tax policy framework taking into consideration the findings of this study. Nonetheless, the consistent increase of the fiscal multiplier that involves increasing government investment expenditure cannot be ignored. It suggests that, in the short run, governments may consider a cut in labour tax, but in the long run, increasing government spending on investment should be considered. The operationalisation thereof may entail strengthening implementation and adherence by incorporating the proposed tax policy reform in the existing Public Finance Management Acts.
This will go a long way in ensuring that the economy does not experience any fiscal collapse due to worsening of macroeconomic vulnerabilities.
Additional information
Funding
Notes on contributors
Sayed O. M. Timuno
Sayed O. M. Timuno, holds a PhD in Economics from the University of Johannesburg. He has several years of experience in econometrics and macroeconomic policy analysis. His research interest are macroeconomic modelling, monetary and fiscal policy analysis.
Joel Hinaunye Eita
Joel Hinaunye Eita, PhD, is a professor of economics and econometrics at the University of Johannesburg, South Africa. His research areas are macroeconomic modelling, international trade, finance and financial markets. He presented several research papers at local and international conferences. He published research papers in local and international journals.
References
- Acemoglu, D., Johnson, S., & Robinson, J. A. (2002). An African success story: Botswana. MIT Department of Economics Working Paper No. 01/37. https://ssrn.com/abstract=290791
- Alesina, A., & Ardagna, S. (2010). Large changes in fiscal policy: Taxes versus spending. Tax Policy and the Economy, 24(1), 35–19. https://doi.org/10.1086/649828
- Aliyu, J. A., & Tijjani, M. S. (2015). Asymmetric cointegration between exchange rate and trade balance in Nigeria. Cogent Economics & Finance, 3(1), 1045213. https://doi.org/10.1080/23322039.2015.1045213
- Arestis, P. (2011). Fiscal policy is still an effective instrument of macroeconomic policy. Panoeconomicus, 58(2), 143–156. https://doi.org/10.2298/PAN1102143A
- Arestoff, F., & Hurlin, C. (2010). Are public investment efficient in creating capital stocks in developing countries. Economics Bulletin, 30(4), 3177–3187. http://www.accessecon.com/Pubs/EB/2010/Volume30/EB-10-V30-I4-P293.pdf
- Arizala, F., Gonzalez-Garcia, M. J. R., Tsangarides, M. C. G., & Yenice, M. (2017). The impact of fiscal consolidations on growth in Sub-Saharan Africa. IMF Working Papers 17/271, 1–33.
- Arslanap, S., Bornhorst, F., Gupta, S., & Sze, E. (2010). Public capital and growth. IMF Working Papers, WP/10/175.
- Auerbach, A. J., & Gorodnichenko, Y. (2016). Effects of fiscal shocks in a globalized world. IMF Economic Review, 64(1), 177–215. https://doi.org/10.1057/imfer.2015.15
- Bank of Botswana. (2007). Annual report. Bank of Botswana. http://www.bob.bw/assets/uploaded/Statistical%20Section%202007.pdf
- Bank of Botswana. (2014). Annual report. Bank of Botswana. http://www.bob.bw/assets/uploaded/BoB-AR-2014%20WEB-STAT.pdf
- Barro, R. J. (1990). Government spending in a simple model of endogeneous growth. Journal of Political Economy, 98(5), S103–S125. https://www.journals.uchicago.edu/doi/10.1086/261726
- Basdevant, O., Benicio, D., Mircheva, B., Mongardini, J., Verdier, G., Yang, S., & Zanna, L. F. (2011). The design of fiscal adjustment strategies in Botswana, Lesotho, Namibia, and Swaziland. IMF Working Papers 11/266, 1–38.
- Berg, A., Gottschalk, J., Portillo, R., & Zanna, L. F. (2010). The macroeconomics of medium-term aid scaling-up scenarios. IMF Working Papers 10/160, 1–45.
- Berg, A., Portillo, R., Yang, S. C. S., & Zanna, L. F. (2013). Public investment in resource-abundant developing countries. IMF Economic Review, 61(1), 92–129. https://doi.org/10.1057/imfer.2013.1
- Berg, M. A., Portillo, R., Buffie, M. E. F., Pattillo, M. C. A., & Zanna, L. F. (2012). Public investment, growth, and debt sustainability: Putting together the pieces. IMF Working Papers 12/144, 1–54.
- Bhattarai, K., & Trzeciakiewicz, D. (2017). Macroeconomic impacts of fiscal policy shocks in the UK: A DSGE analysis. Economic Modelling, 61, 321–338. https://doi.org/10.1016/j.econmod.2016.10.012
- Bi, H., Shen, M. W., & Yang, M. S. C. S. (2014). Fiscal limits, external debt, and fiscal policy in developing countries. IMF Working Papers 14/49, 1–37.
- Blanchard, O., Erceg, C. J., & Lindé, J. (2017). Jump-starting the Euro-area recovery: Would a rise in core fiscal spending help the periphery? NBER Macroeconomics Annual, 31(1), 103–182. https://doi.org/10.1086/690240
- Cacciatore, M., & Traum, N. (2018). Trade flows and fiscal multipliers. CEPR Discussion Paper No. DP12960. https://ssrn.com/abstract=3190200
- Caldara, D., & Kamps, C. (2017). The analytics of SVARs: A unified framework to measure fiscal multipliers. The Review of Economic Studies, 84(3), 1015–1040. https://doi.org/10.1093/restud/rdx030
- Christiano, L., Eichenbaum, M., & Rebelo, S. (2011). When is the government spending multiplier large? Journal of Political Economy, 119(1), 78–121. https://doi.org/10.1086/659312
- Coenen, G., Straub, R., & Trabandt, M. (2013). Gauging the effects of fiscal stimulus packages in the Euro area. Journal of Economic Dynamics & Control, 37(2), 367–386. https://doi.org/10.1016/j.jedc.2012.09.006
- D’Alessandro, A., Fella, G., & Melosi, L. (2018). Fiscal stimulus with learning‐by‐doing. FRB of Chicago Working Paper No. 2018-9. https://ssrn.com/abstract=3203588
- Davig, T., & Leeper, E. M. (2009). Expectations and fiscal stimulus. CAEPR Working Papers No.006-2009. https://ssrn.com/abstract=1416885
- Delong, J. B., & Summers, L. (2012). Fiscal policy in a depressed economy. Brookings Papers on Economic Activity, 43(1), 233–297. https://doi.org/10.1353/eca.2012.0000
- Drygalla, A., Holtemöller, O., & Kiesel, K. (2017). The effects of fiscal policy in an estimated DSGE model: The case of the German stimulus packages during the great recession. IWH Discussion Papers, 34/2017.
- Easterly, W., & Rebelo, S. (1993). Fiscal policy and economic growth: An empirical investigation. Journal of Monetary Economics, 32(3),:417–458. https://doi.org/10.1016/0304-3932(93)90025-B
- Eggertsson, G. B. (2008, December). Can tax cuts deepen recessions? Federal Reserve Bank of New York. https://www.ny.frb.org/research/economists/eggertsson/
- Erceg, C. J., & Lindé, J. (2013). Fiscal consolidation in a currency union: Spending cuts vs. tax hikes. Journal of Economic Dynamics & Control, 37(2), 422–445. https://doi.org/10.1016/j.jedc.2012.09.012
- Estevão, M. M. M., & Samaké, I. (2013). The economic effects of fiscal consolidation with debt feedback. IMF Working Papers 13/136, 1–51.
- Fazzari, S. M., Morley, J., & Panovska, I. (2015). State-dependent effects of fiscal policy. Studies in Nonlinear Dynamics & Econometrics, 19(3), 285–315. https://doi.org/10.1515/snde-2014-0022
- Fève, P., & Sahuc, J. G. (2017). In search of the transmission mechanism of fiscal policy in the Euro area. Journal of Applied Econometrics, 32(3), 704–718. https://doi.org/10.1002/jae.2517
- Finmark Trust. (2014). FinScope consumer survey Botswana. Finmark Trust. http://www.finmark.org.za/wp-content/uploads/2015/07/Brochure_FS_Botswana_2014_Consumer1.pdf
- Fleming, J. M. (1962). Domestic financial policies under fixed and under floating exchange rates. IMF Staff Papers, 9(3), 369–380. https://doi.org/10.2307/3866091
- Friedman, M. (1959). A program for monetary stability (No. 3). Ravenio Books. Fordham University Press.
- Galí, J., López-Salido, J. D., & Vallés, J. (2007). Understanding the effects of government spending on consumption. Journal of the European Economic Association, 5(1), 227–270. https://doi.org/10.1162/JEEA.2007.5.1.227
- Gnip, A. G. (2015). Empirical assessment of stabilization effects of fiscal policy in Croatia. Romanian Journal of Economic Forecasting, 18(1), 47–69. http://www.ipe.ro/rjef/rjef1_15/rjef1_2015p47-69.pdf
- Gros, D., & Mayer, T. (2012). A sovereign wealth fund to lift Germany’s curse of excess savings. CEPS Policy Briefs, No. 280. https://ssrn.com/abstract=2145918
- Hamilton, J. D. (2009). Understanding crude oil prices. The Energy Journal, 30(2), 179–206. https://doi.org/10.5547/0195-6574-EJ-Vol30-No2-9
- Harvey, C., & Lewis, S. R., Jr. (1990). Policy choice and development performance in Botswana. Basingstoke and London, Macmillan, in association with the O.E.C.D. Development Centre, Paris; New York, St Martin’s Press.
- Hemming, R., Mahfouz, S., & Kell, M. (2002). The effectiveness of fiscal policy in stimulating economic activity: A review of the literature. IMF Working Papers 02/208, 1–53.
- Hur, S. K., Mallick, S., & Park, D. (2014). Fiscal policy and crowding out in developing Asia. Environment and Planning. C, Government & Policy, 32(6), 1117–1132. https://doi.org/10.1068/c12185r
- Ilzetzki, E., Mendoza, E. G., & Végh, C. A. (2013). How big (small?) are fiscal multipliers? Journal of Monetary Economics, 60(2), 239–254. https://doi.org/10.1016/j.jmoneco.2012.10.011
- Iwata, Y. (2011). The government spending multiplier and fiscal financing: Insights from Japan. International Finance, 14(2), 231–264. https://doi.org/10.1111/j.1468-2362.2011.01285.x
- Iyoboyi, M., & Muftau, O. (2014). Impact of exchange rate depreciation on the balance of payments: Empirical evidence from Nigeria. Cogent Economics & Finance, 2(1), 923323. https://doi.org/10.1080/23322039.2014.923323
- Jacquinot, P., Lozej, M., & Pisani, M. (2018). Labour tax reforms, cross-country coordination and the monetary policy stance in the euro area: A structural model-based approach. Working Paper Series 2127, European Central. https://www.ecb.europa.eu//pub/pdf/scpwps/ecb.wp2127.en.pdf
- Jha, S., Mallick, S. K., Park, D., & Quising, P. F. (2014). Effectiveness of countercyclical fiscal policy: Evidence from developing Asia. Journal of Macroeconomics, 40, 82–98. https://doi.org/10.1016/j.jmacro.2014.02.006
- Jibir, A., & Aluthge, C. (2019). Modelling the determinants of government expenditure in Nigeria. Cogent Economics & Finance, 7(1), 1620154. https://doi.org/10.1080/23322039.2019.1620154
- Junior, C. J. C., & Sampaio, A. V. (2014). Tax reduction policies of the productive sector and its impacts on Brazilian economy. Dynare Working Papers Series (No. 36), CEPREMAP. https://www.dynare.org/wp-repo/dynarewp036.mod
- Keynes, M. J. (1936). The general theory of employment, interest, and money. Kessinger Publishing.
- Kojo, N. C. (2010). Diamonds are not forever: Botswana medium-term fiscal sustainability. Policy Research working paper; no. WPS 5480. World Bank. https://openknowledge.worldbank.org/handle/10986/3962
- Krugman, P. (2010). British fashion victims. The New York Times, 21.
- Li, S. M., & Spencer, A. H. (2016). Effectiveness of the Australian fiscal stimulus package: A DSGE analysis. Economic Record, 92(296), 94–120. https://doi.org/10.1111/1475-4932.12224
- Lorusso, M., & Pieroni, L. (2019). Disentangling civilian and military spending shocks: A Bayesian DSGE approach for the US economy. Journal of Risk and Financial Management, 12(3), 141. https://doi.org/10.3390/jrfm12030141
- Magweva, R., & Sibanda, M. (2020). Inflation and infrastructure sector returns in emerging markets—panel ARDL approach. Cogent Economics & Finance, 8(1), 1730078. https://doi.org/10.1080/23322039.2020.1730078
- Malik, Z. K., Ali, Z. S., Imtiaz, A., & Aftab, A. (2019). Preference shocks in an RBC model with intangible capital. Cogent Economics & Finance, 7(1), 1586621. https://doi.org/10.1080/23322039.2019.1586621
- Melina, M. G., Yang, M. S. C. S., & Zanna, L. F. (2014). Debt sustainability, public investment, and natural resources in developing countries: The DIGNAR model. IMF Working Papers 14/50, 1–41.
- Ministry of Finance and Development Planning Botswana. (2009). National development plan 10. Ministry of Finance and Development Planning, Botswana. https://www.finance.gov.bw/images/NDP-TEN/NDP_TEN_final.pdf
- Ministry of Finance and Economic Development Botswana. (2017). Financial statement of the consolidated fund. Ministry of Finance and Economic Development Botswana. https://www.finance.gov.bw/images/DevelopmentandBudget/Financial_Tables_20152016_22_01_2015.pdf
- Mountford, A., & Uhlig, H. (2009). What are the effects of fiscal policy shocks? Journal of Applied Econometrics, 24(6), 960–992. https://doi.org/10.1002/jae.1079
- Mucka, Z. (2016). Fiscal policy matters: A new DSGE model for Slovakia. Discussion Papers No. 1/20. Council for Budget Responsibility.
- Mundell, R. A. (1963). Capital mobility and stabilization policy under fixed and flexible exchange rates. Canadian Journal of Economics and Political Science/Revue Canadienne de Economiques et Science Politique, 29(4), 475–485. https://doi.org/10.2307/139336
- Nasir, A. M., Yago, M., Soliman, M. A., & Wu, J. (2016). Financial stability, wealth effects and optimal macroeconomic policy combination in the United Kingdom: A new-Keynesian dynamic stochastic general equilibrium framework. Cogent Economics & Finance, 4(1), 1136098. https://doi.org/10.1080/23322039.2015.1136098
- Omolade, O., Ngalawa, H., & Kutu, A. (2019). Crude oil price shocks and macroeconomic performance in Africa’s oil-producing countries. Cogent Economics & Finance, 7(1), 1607431. https://doi.org/10.1080/23322039.2019.1607431
- Perotti, R. (2005). Estimating the effects of fiscal policy in OECD countries. CEPR Discussion Paper No. 4842. https://ssrn.com/abstract=717561
- Petrovic, P., Arsic, M., & Nojkovic, A. (2014). Fiscal multipliers in emerging European economies. Fiscal Council - Republic of Serbia. http://dx.doi.org/10.2139/ssrn.2402170.
- Phillips, A. W. (1958). The relationship between unemployment and the rate of change of money wages in the United Kingdom 1861–1957. Economica, 25(100), 283–299. https://onlinelibrary.wiley.com/doi/full/10.1111/j.1468-0335.1958.tb00003.x
- Primus, K. (2016). Fiscal rules for Resource Windfall Allocation: The case of Trinidad and Tobago. IMF Working Papers 16/188, 1–48.
- Ramey, V. A., & Zubairy, S. (2018). Government spending multipliers in good times and in bad: Evidence from US historical data. Journal of Political Economy, 126(2), 850–901. https://doi.org/10.1086/696277
- Riera-Crichton, D., Vegh, C. A., & Vuletin, G. (2016). Tax multipliers: Pitfalls in measurement and identification. Journal of Monetary Economics, 79, 30–48. https://doi.org/10.1016/j.jmoneco.2016.03.003
- Romer, C. D., & Romer, D. H. (2010). The macroeconomic effects of tax changes: Estimates based on a new measure of fiscal shocks. American Economic Review, 100(3), 763–801. https://doi.org/10.1257/aer.100.3.763
- Romer, P. M. (1986). Increasing returns and long-run growth. Journal of Political Economy, 94(5), 1002–1037. https://doi.org/10.1086/261420
- Schmitt-Grohe, S., & Uribe, M. (2003). Closing small open economy models. Journal of International Economics, 61(1), 163–185. https://doi.org/10.1016/S0022-1996(02)00056-9
- Statistics Botswana. (2016a). International merchandise trade statistics. Statistics Botswana. http://www.statsbots.org.bw/sites/default/files/publications/IMTS%20DECEMBER%202016.pdf
- Statistics Botswana. (2016b). National accounts statistics report. Statistics Botswana. http://www.statsbots.org.bw/sites/default/files/publications/National%20Accounts%20%202016.pdf
- Statistics Botswana. (2018). Gross Domestic Product Quarter 3. Statistics Botswana. http://www.statsbots.org.bw/sites/default/files/publications/Gross%20Domestic%20Product%20Quarter%203%2C%202018.pdf
- Taylor, J. B. (1993). Discretion versus policy rules in practice. Carnegie-Rochester conference series on public policy 39 (pp. 195–214).
- Van Brusselen, P. (2010). Fiscal stabilisation plans and the outlook for the world economy. Bank of Italy Occasional Paper. https://ssrn.com/abstract=1985198
- Vlasov, S. A., & Deryugina, E. B. (2018). Fiscal multipliers in Russia. Journal of Economic Theory Studies of the Russian Economy Issues of Economic Policy Hot Topic, 2(38), 83–95. https://www.econorus.org/journal/pdf/NEA-38en.pdf