
 ?Mathematical formulae have been encoded as MathML and are displayed in this HTML version using MathJax in order to improve their display. Uncheck the box to turn MathJax off. This feature requires Javascript. Click on a formula to zoom.
Abstract
This research examines the influence of world crude oil price shocks on the financial performance of Vietnamese oil- and gas-related firms. Based on copula approach and the sample data of domestic giant oil- and gas firms from 2009 to 2019, in particular in the situation of oil price steadily going up and economic depression of 2011–2012; approximately nine copulas including Gauss, Clayton, Rotated-Clayton, Plackett, Frank, Gumbel, Rotated-Gumbel, Student, Symmetrized-Joe-Clayton have been focused. A new evidence could be found that the oil price shocks have not impacted on the stock return of oil- and gas-related firms in the wave of increasing oil price, but a lagged period of time oil- and gas-related firms could receive more stock returns. The results further demonstrate that world oil price fluctuations have significantly impacted on the financial performance of some firms as PVS, PVG, and PET in the pre-depression period. In respect to the economic depression of 2011–2012, the study reveals no evidence in the relationship between world oil price fluctuations and stock returns of oil- and gas-related firms. In other words, results in the post-depression period suggest that world oil price shocks can affect stock returns of selected giant oil- and gas-related firms.
PUBLIC INTEREST STATEMENT
The world crude oil price shocks occurred in the period of 2011–2012 can affect the financial performance of oil- and gas-related firms. In this paper, we carry out a study on Vietnamese oil- and gas-related firms, our results suggest a new evidence that world crude oil price has no impact on the financial performance in the wave of increasing crude oil price, but a lagged period of time oil- and gas-related firms could significantly receive more benefits, implying that the crisis of crude oil price on performance of Vietnamese oil- and gas-related firms need a lagged period of time to be effective. Further, the study also reveals that there is no evidence in the linkage between crude oil price fluctuations and stock returns of Vietnamese oil- and gas-related firms in the context of economic depression of 2011–2012, contrary to some researchers believe. Surprisingly, changes in world crude oil price can significantly affect stock returns of selected Vietnamese oil- and gas-related firms in the post-depression period.
1. Introduction
World crude oil has been one of the most important commodities which contribute significantly a great role to manufacturing industry, business activities, individual, and households’ energy consumption. The global energy crisis of 1972–1973 occurred and led a series of economic structural shifts. The global economy had faced difficulties such as maintain their operational activities, economic performance, and sustainable development (Inkenberry, Citation1986; Kamran et al., Citation2020; Licklider, Citation1988; Mukherjee et al., Citation2020). Therefore, after the energy crisis, the issue had gained much more important and required more discussion how to relieve negative externalities from the crisis while maintaining firm performance in particular and the economic growth in general (Hamilton, Citation1983; Lv et al., Citation2020; Wattanatorn & Kanchanapoom, Citation2012).
Over the past two decades, this argument has been remarkably flourished by researchers, the government, and business community. As shown by Bagirov and Mateus (Citation2019) in the discussion between world oil price shocks and business efficiency in oil- and gas-related firms in the both unlisted and listed firms in the region of Western European, the movements of world oil volatility on stock returns could be dependent on specific sectors. Additionally, oil prices positively affected the profitability of listed oil- and gas-related firms in Western Europe. Regarding recent crisis of 2014, it negatively impacted the financial efficiency in both unlisted and listed firms. Not only that, the financial efficiency of only listed oil- and gas- related firms could be negatively impacted on the global financial crisis of 2008–2009. In this argument, Zhu et al. (Citation2019) studied highlighted the state-owned companies had been more energetic to asymmetric effect of petroleum prices while domestic-owned companies had been more energetic to negative petroleum price returns.
Nowadays, many countries have targeted the use of clean energy in order to obtain sustainable development and environmental protection (Tran et al., Citation2020). In this context, Kocaarslan and Soytas (Citation2019) indicated a negative effect on stock returns of clean energy due to increasing in oil price could be found. This was supported by the indication of business cycle changes in clean energy stock efficiency in the long-run.
In the situation of Vietnam, the various types of energy resource have been used in the country. Over the past 20 years, Vietnam has been known as one of the largest oil and natural gas producers in Association of Southeast Asian Nations. Unfortunately, industrialization and economic reforms have significantly requested more energy consumption in the country (Tran et al., Citation2020). According the General Statistics Office (GSO) of Vietnam, the net importing value of crude oil in 2019 reached roughly 3.64 million tons, up from 1.3 million tons a year earlier. It supported the economic growth at approximately 7.02; 7.08 percent for 2018, 2019, meanwhile the average growth of 7 percent since 1986 (Tran et al., Citation2020).
Concerned with the correlation between world oil price shocks and stock returns, to the best of our knowledge, a very few studies has focused on analyzing how fluctuations of world crude oil price can affect stock return of oil-related companies in agreement with the approach of copula. Theoretically, copula is a joint distribution function or univariate distribution function with margins of one-way variable (Nelsen, Citation2006). Further investigated on this study, nine copulas including Gauss, Clayton, Rotated-Clayton, Plackett, Frank, Gumbel, Rotated-Gumbel, Student, Symmetrized-Joe-Clayton will be used in order to find the linkage between the world crude oil price fluctuations and oil- and gas-related stocks on Vietnam’s stock exchange. In addition, Dtinews (Citation2013) indicated that oil price steadily increased in the period of 2011 and 2012 could drive up inflation rates, in which prices of all goods, services, and transportation sector could go up in Vietnam. Further, GDP growth in this period could fall down at the lowest rate in the period of 1990 and 2019. Therefore, the purpose of this study is to estimate the effect of world oil price shocks on the stock returns in the stage of economic depression.
The remaining paper proceeds as follows: Section 2 is devoted to literature review. Section 3 discusses the concept of copula and the contribution of the theory of copulas to the detection of the contagion. Section 3 further indicates the data and methodology. Section 4 presents the results and discussion. Section 5 synthesizes the conclusions.
2. Literature review
The 1970s oil crisis occurred after a number of years of harsh negotiations in the relationship between major oil exporting members in the Organization of Petroleum Exporting Countries (OPEC) and giant oil businesses over production of petroleum and other petroleum-related products (Inkenberry, Citation1986). In 1973, the OPEC oil started a decision to stop exporting oil to the United States. Within a year, world crude oil prices accelerated at least four times higher than these of the pre-crisis period (Inkenberry, Citation1986; Licklider, Citation1988).
The discussion regarding how the world oil prices impacted on economic indicators have been investigated by many researchers (Alaali, Citation2020; Hamilton, Citation1983; Lv et al., Citation2020). As suggested in Hamilton (Citation1983), the economic recession of the United States had been faced since the World War II by a steady increase of crude oil. Using a study in the 1948–1972 period, Hamilton (Citation1983) indicated that oil fluctuations predominantly contributed U.S. recessions prior to 1972. Furthermore, increasing of world oil price can certainly affect post-OPEC macroeconomic performance. Another study on Thai stock exchange over the period from 2001 to 2010, Wattanatorn and Kanchanapoom (Citation2012) highlighted the relationship between oil prices and performance of listed firms by employing the method of fixed and random effects models and least square to correct endogeneity problem. Results indicated that oil prices would have significantly impacted on the profitability in the energy and food industry.
Another study of Lv et al. (Citation2020) gained our attention to analyze the relationship between world oil price fluctuations and stock returns in the United States and China. Employing BEKK-GARCH model to estimate the comparative discussion, the impact of oil price fluctuations on returns of stock was dependent on sub-sector category in the oil business. Further, the impact of returns of stock on oil price could be found in the United States while rarely influenced in the China’s market. In terms of risk spillover, a fewer China’s oil firm stocks were likely to transmit its risks to the oil market but more in the United States.
Another study was investigated by Alaali (Citation2020), it depicted that shocks in oil price had typically affected macroeconomic factors such as economic growth, inflation, and productivity. A very few studies have focused on the relationship between oil price shocks and its impact on the firm-level sample and using the approach of GMM covering the years between 1986 and 2011 in the United Kingdom. Additionally, oil price shocks could be a proxy for uncertain factor for firm efficiency, assessment, and investment selection. Their investigation argued that the stock price changes tended to be positively correlated with investment. In addition, a U-shaped correlation between volatility of oil price and investment could be found. On the same token, Huang and Mollick (Citation2020) findings suggested that a structural vector autoregression model (SVAR) is applied in order to estimate the variance decomposition of returns of oil-related companies in aggregate market in S&P 500, S&P energy industry, Chevron as well as Exxon Mobil oil giant companies. The sample data was classified by two subsamples from 2000 to 2010 period and 2011–2018 period. The results indicated that supply attention could become more substantial in the period of after 2011, for both oil companies and for aggregate market as well as energy industry. More specifically, supply fluctuations in relation to tight oil could explain in the model between 29% for S&P 500 and 31% for S&P Energy industry of the changes in stock returns in the duration of after 24 months and further concluded a 28% and 29% for oil businesses. In respect to pre-2011 subsample, no finding could be found.
Concerned with the linkage between world oil price and stock returns, recent literature is in lack of empirical investigations of this relationship based on copula approach (Huang & Mollick, Citation2020). Regarding the dependence structure between stock returns, it is expected to use the copula modeling for financial market. Copula functions were introduced by Nelsen (Citation2006). This method has been supported by Boubaker and Salma (Citation2011) who measured the dependence structure between S&P 500 and 15 stock market indices during the pre-crisis and crisis period in order to demonstrate the contagion using copula modeling. To be precise, Boubaker and Salma (Citation2011) used five copulas in their study including Gauss, Student, Clayton, Gumbel, and Frank copulas. Further expanded the scope, this study will use nine copula funtions including Gauss, Clayton, Rotated-Clayton, Plackett, Frank, Gumbel, Rotated-Gumbel, Student, Symmetrized-Joe-Clayton aimed to investigate the dependence structure of the world crude oil return and eight principle oil and gas stocks on Vietnam’s stock market.
3. Data and methodology
3.1. Data
The study explores the effects of world crude oil price on some Vietnamese stock market indices by using a daily time-series data spanning from 25 November, 2009 to 4 Oct,ober 2019. Data related to world crude oil price, the authors consider published of world crude oil WTI in USD per barrel on a daily basis on Finance News. Additionally, oil- and gas-related firms are retrieved from Vietnam’s stock market, which includes Ho Chi Minh City Stock Exchange (HOSE) and Hanoi Stock Exchange (HNX).
3.2. Methodology
Theoretically, the limitations of conventional measures of contagion were certainly presented in relation to Boubaker and Salma (Citation2011). It discussed that copula is a suitable approach in the analysis of dependence structure of random multivariate variables. Indeed, Boubaker and Salma (Citation2011) used five copulas in their study among a sample data of eight developed and eight emerging economies and therefore finding the existence of contagious nature of the crisis between developed and emerging economies. Further discussed, correlation analysis is not sufficient to measure the dependence structure found in financial markets. Indeed, the results are only reliable if the random variables are jointly Gaussian and the dependency is linear. In addition, correlation is a scalar measure which is not designed to analyze the dependence structure. According to Rodriguez (Citation2006), the weakness of correlation-based analysis was if correlation coefficient got zero, it could regularly not indicate independence between the random variables or an increase in the correlation between two variables could be due merely to an increase in the variance of one variable. For these reasons, the copula approach is more appropriate to present a complete picture of the dependence structure. For simplicity, this study is limited to the theory of bivariate variables.
3.2.1. The two-dimensional copula concept
Copula is a joint distribution function or univariate distribution function with margins of one-way variable. We have the concept of two-dimensional copula (Adam et al., Citation2013; Cherubini et al., Citation2004; Nelsen, Citation2006) as follows:
Definition 1. A two-dimensional copula (or two-copula) is a function C whose domain is , and C(x)
satisfies the following properties:
1. if at least one coordinate of x is 0.
2. .
3. with
, so we have:
Further discussed, one of copulas’ characteristics which helps it become an effective probabilistic application in the financial sector is that from the distribution of the component variables (they are maybe different and not necessarily independent), we can determine a copula as a joint distribution of those variables. This is significant when we consider a portfolio of assets whose distributions are not the same and dependent. Accordingly, copula is defined as a joint distribution function where variables are the marginal distribution functions of the original variables. Further, the significant importance of the copula is that it can capture the dependence structure of a multivariate distribution. This is supported by the Sklar’s theorem.
Theorem 1. Let be a joint distribution function with margins
and
. Then there is a copula C such that for all x, y, in R,
If and
are continuous, then C is unique; otherwise, C is uniquely determined on
and C is invariant under strictly increasing transformations of the random variables.
Based on Sklar’s theorem, the joint distribution can be decomposed into its univariate marginal distributions
and
, and a copula C, which attaches the dependence structure between the variables X and Y. From these the marginal distribution’s behaviors of the dependence structure can be defined. The density of a bivariate law can be written also in terms of the density of the copula associated c and marginal densities
and
:
That is, the density of F is expressed as the product of the copula density and the univariate marginal densities. In conclusion, copula models which are different from linear correlation, focus on the asymmetric association between random variables. So they provide rich information on both dependence degree and dependence structure.
3.2.2. Modeling the dependence structure and contagion
The definition of contagion can be discussed by the so-called asymptotic tail dependence coefficients introduced by Sibuya (Citation1960) (hereinafter TDC), which defines our measure of contagion. The coefficients describe the tendency of financial markets to break up or boom together, i.e. it measures the dependence between extreme outcomes of the variables. The upper (or lower) TDC is a limiting probability of one variable exceeding (or falling behind) a high-order (low-order) quantile, given that the other variable exceeds (falls behind) the same quantile. Formally, if is a vector of continuous random variables with marginal distributions
&
, respectively, then the upper and lower TDCs are defined as follows:
and
If the either upper or lower TDC equals zero, the respective extreme values are independent, otherwise there is dependence between extreme values of the variables considered. In this case, we accept that TDCs are simple functions of copula parameters. Table gives an overview of the copulas employing along with their TDCs. It is therefore concluded that parameters of the copulas are obtained by maximizing the respective likelihood functions.
Table 1. Copula functions and its characteristics
3.3. Research analysis
For the dependence structure between world crude oil return and each stock return, we use the copula functions which were introduced by Nelsen (Citation2006), Huang and Mollick (Citation2020) as the method used in the financial market. This method had been supported by Boubaker and Salma (Citation2011) who measured the dependence structure with five copulas: Gauss, Student, Clayton, Gumbel, and Frank. In this context, the authors expand the results of previous empirical studies and employ nine copulas in the analysis, including Gauss, Clayton, Rotated-Clayton, Plackett, Frank, Gumbel, Rotated-Gumbel, Student, Symmetrized-Joe-Clayton copula functions. Table depicts the parameters of some copulas used in the study.
Table 2. Copula Parameters
Based on three periods of analysis, it is important to select the suitable copula to capture the dependence structure of each pair of returns, including world crude oil return and Vietnam’s stock returns (Nelsen, Citation2006). Accordingly, the study is to calculate the tail dependence coefficients by those best copulas. As shown by Boubaker and Salma (Citation2011), Adam et al. (Citation2013), the dependence structure changes could be interpreted by changes of either dependence structure, i.e. the changes of copula function, or the same dependence structure in different periods but with different dependence coefficients.
4. Results and discussion
4.1. Data description
The data covers the period from 25 November 2009 to 4 Oct,ober 2019 with the total of 2426 observations. In addition, returns are defined as the log difference of index values. If and
are the value of the index at time t and time (t—1) then the stock return will be calculated as follows:
In the period of 2011–2012, Vietnam’s economic performance had severely met problems because of slowdown in growth at a rate of about 4 percent. Further, petroleum has an important role in Vietnam economy but the price had steadily fluctuated. As shown by Dtinews (Citation2013), petroleum price in this period hike drove up inflation rates in Vietnam, prices of all goods, services, and transportation sector were up. As suggested in O’Brien and Weymes (Citation2010), increase in energy price had been as the main driver to increase inflation rates in the case of a somewhat poor fuel funding and heavily depend on imported oil. Once again about the data, the number of observations in three consecutive periods are, respectively, 269, 477, and 1680. Table shows summary statistics for returns from the sample stocks and world crude oil returns. Letter “R” before each name means “Return” of each time series.
Table 3. Descriptive Statistics of Returns of Daily Stocks and World Crude Oil
Table describes the descriptive statistics of the variables used in the study regarding their mean, standard deviation, minimum, and maximum values, skewness, kurtosis, and Jarque-Bera in Vietnam. This analysis is analyzed based on three periods. As commonly observed, the percentage means of the daily stock index and world crude oil returns are close to zero in most cases. In addition, the skewness of all the series are different from zero with skewing to the left or to the right. The results of the Jaque-Bera test in Table reveals the normality distributions of returns. As a result, the Jaque-Bera test with a pvalue of 0.00 strongly rejects the null hypothesis of normality in some return series, indicating supports the inappropriateness of using the multivariate normal distribution in examining financial data. While the Jaque-Bera test with a pvalue different from 0.00 accepts the null hypothesis of normality in the others. Throughout this analysis, a few of variables of RWTI, RPVD, RPVE, and RPVS in some specific cases are not normally distributed. Therefore, it has not much influenced on the coming results. These findings were strongly supported by Micceri (Citation1989), Blanca et al. (Citation2013), who investigated distributional attributes of data and depicted that non-normal distributions will be commonly appeared when analyzing with variables in social sciences.
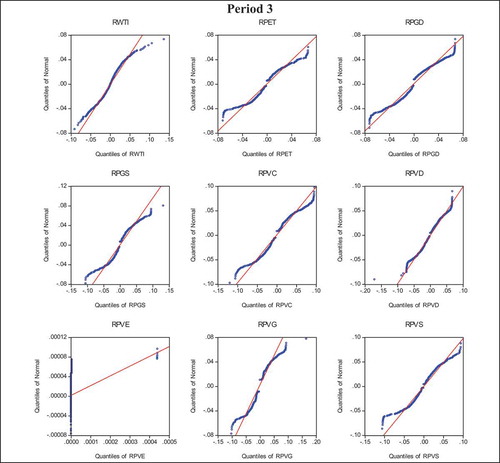
Figures – of normal q-q plots of all of the series show that some of the returns series exhibit a non-normal pattern. Intuitively, the strong departure from linearity at the end of the q-q plots indicates non-normal fat-tailed behavior by these of the return series. At the same time, the smooth departure from linearity at the end of the q-q plots indicates normal distributed behavior by the other return series.
Figure 1. Normal q-q plots of returns of stock indices for period 1.
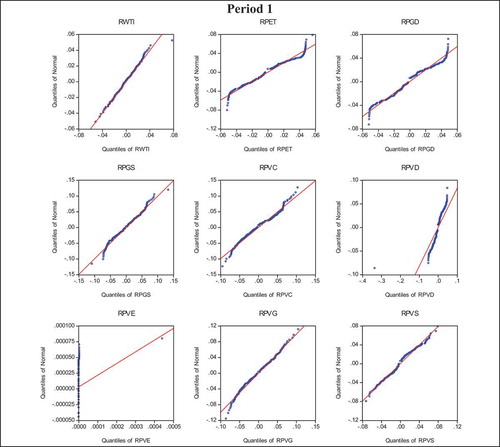
Figure 2. Normal q-q plots of returns of stock indices for period 2.
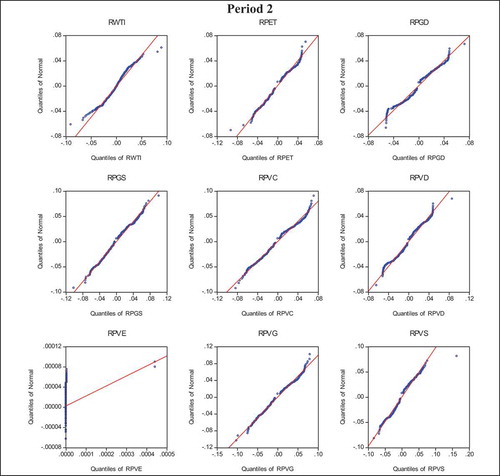
Figure 3. Normal q-q plots of returns of stock indices for period 3.
4.2. Empirical results and discussion
It is strongly supported the hypothesis that we can interpret the copula parameters differently. As shown by the method of Gaussian copula, it is considered the copula of a multivariate normal distribution. Therefore, the study continues to analyze based on Gaussian copula’s parameter of each pairs of the world crude oil return (WCOR) and a stock return (SR) in the case of Vietnam. The dependence correlations are reported in Tables – as follows:
Table 4. Dependence coefficient of WCOR and SR in pre-depression period
Table 5. Dependence coefficient of WCOR and SR in depression period
Table 6. Dependence coefficient of WCOR and SR in post- depression period
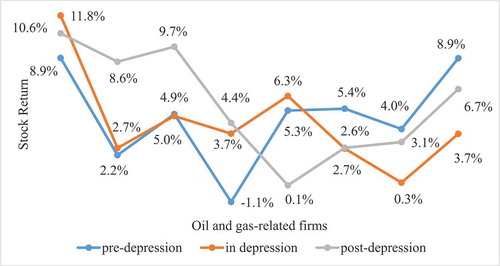
Tables – show that almost the dependence coefficients (DC) are positive, except from the pair of WCOR and Rpgs in the pre-depression period. In each period, if WCOR increased/decreased, SR could also increase/decrease in the same way. In the pre-depression period, the DC is highest in the pair comprising the world crude oil return and the PVD stock return (8.89%), followed by the pair of WCOR and the PVE stock return (8.88%), and the pair of WCOR and the PGD stock return (5.39%). The results obtained from Tables – also suggest that the lowest DC is—1.06% between WCOR and the PGS stock return. In addition, the DC is highest in the pair comprising WCOR and the PVD stock return (11.83%), followed by WCOR and PVG stock return (6.27%), and PVC stock return (4.88%) pairs in the depression period. The lowest DC is 0.28% between WCOR and PET stock return. Regarding the post- depression period, the three correlation in top three highest in the pairs comprising WCOR and SR are: PVD (10.6%), PVC (9.68%), và PVS (8.64%). The lowest DC is 0.09% between WCOR and PVG stock return. It is further indicated that a different of Gaussian copula’s dependence parameters of correlation coefficients can be found. The DCs calculated by Gaussian copula has been changed in all three periods. The following Figure presents the trend in change of DCs in three periods.
Figure 4. DCs between WCOR and SR in three periods.
Further discussed on the analysis, Tables – present in detail the choice of the best copula and its corresponding parameters for the pair of WCOR-PVD returns, respectively in the three periods of the study. Additionally, using the log-likelihood, AIC and BIC criteria, the study is to choose the best copula. The following results obtained thanks to some matlab codes from http://public.econ.duke.edu/~ap172/ with necessary modification to fit the collected data. The best copula is marked in bold in each Tabl
Table 7. Estimation of copula parameters for WCOR and PVD in pre-depression period and best copula
Table 8. Estimation of copula parameters for WCOR and PVD in depression period and best copula
Table 9. Estimation of copula parameters for WCOR and PVD in post- depression period and best copula
In terms of the pair of WCOR and PVD returns, Tables – show that the best copulas found in the three periods, are the Student copula, the Frank copula and the Student copula, respectively. More specifically, the Frank family has neither lower nor upper tail dependency. Additionally, the Student copula can reveal both left and right tail dependence at the same time and with the same tail dependence coefficients, indicating the possibility of the symmetric tail dependence of the pair. Further, upper tail dependence indicates that the two returns are likely to go up together; and lower tail dependence implies that the two returns are likely to go down at the same time. In this context, the two returns are likely to go down at the same time with the same probability. It is further reported that the dependence structure between WCOR and PVD return has predominantly changed through three periods, thanks to the changes of copula functions in the different periods.
Similarly, the study continues selecting the best copulas for each pair of WCOR and Vietnamese oil and gas stock returns in each period and therefore its best copula’s parameters which measure the tail dependence. In agreement with the same analysis, results are presented in Table below.
Table 10. The choice of the best copula for WCOR and Vietnam’s oil and gas stock returns, and tail dependence coefficients in each period
Table illustrates the dependence structure between world oil price shocks and Vietnam’s oil and gas stocks in the three periods, which are the pre-depression period, depression period, and post- depression period. In the trend of upper tail dependence between world crude oil and oil and gas stocks, the study concludes that the world crude oil price has increased in the same way with stocks such as PVD, PGS, PVG, and PET in the pre-depression period; PGS, PVG, PET, and PVE in the depression period. Regarding post-depression period, an increase in both world oil price and stocks as PVD, PVS, PVC, and PVE could be found.
In the trend of lower tail dependence between world crude oil price shocks and oil and gas stocks, it is reported that the world crude oil price has decreased in the same way with stocks such as PVD, PVS, PGS, PVG, and PET in the pre-depression period; PVS, PVC, PGS, PVG, PGD, PET, and PVE in the depression period. For the post-depression period, a decrease in both world oil price and stocks as PVD, PVS, PVC, PVG, and PVE could be found. To be precise, Granger Causality Test is now carried out for world oil shocks and firm performance. The results are summarized in Table .
Table 11. Granger Causality Test
In the pre-depression period, Table depicts that the increase in world oil price will positively impact on the stock returns of oil-related firm such as PVG and PET. In the case of decrease of world oil price, it will frequently reduce the stock returns in firms of PVS, PVG, and PET. This result is supported by the previous studies of Wattanatorn and Kanchanapoom (Citation2012) in Thai stock exchange. Additionally, this result contradicts with recent studies of Lv et al. (Citation2020) in the case of China’s oil firms, otherwise this study is similar to the finding in the case of the United States.
During the depression, the study finds no evidence of the relationship between world oil price fluctuations and stock return of oil-related firms in all selected firms chosen to study. The possible evidence could be that oil-related firms in Vietnam had been unable to anticipate the price adjustment on their services, therefore they could not grasp more opportunities to make more profit in this period. This result is consistent with the previous studies in China’s market by Lv et al. (Citation2020). In fact, a fewer China’s oil firm stocks are affected by risk spillover in the oil market, and few stocks could predominantly transmit its risks to the oil market.
In the post-depression period, Table indicates that an increase or a decrease in world oil price could either generate or reduce stock returns of oil-related firm, for example, PVD, PVS, and PVC. In particular, a lower in world oil price could decrease stock return regarding PGS, and PVG only. This finding is supported by Iavorskyi (Citation2013), Nguyen (Citation2020), and Nguyen et al. (Citation2020). In fact, PetroVietnam has become at the top of the 500 Vietnam’s biggest enterprises listed in the country, the oil-related firms as PVD, PVS, and PVC have become the state-owned oil and gas giant firms of PetroVietnam. More precise, a larger firm has more competitive advantages because of economies of scale, since cost per unit of output can decrease with increasing scale so as that firm could be are more effective in operation. Another possibility, a larger bank could totally maintain a lower bankruptcy cost and promote a higher performance growth (Nguyen, Citation2020). Similarly, Iavorskyi (Citation2013) indicated that a larger firm by size could tend to promote a larger contribution of their performance. In addition, although many oil- and gas-related firms could not grasp the opportunity to enhance their profit in the depression period due to increasing of oil, but some months later, oil-related firms would be able to anticipate the price adjustment and achieve more profitability. Throughout three periods, a new evidence could be found that the oil price shocks has not impacted on the stock return of oil-related firms in the economic depression, but a lagged period of time, some oil-related firms could receive more profitability because of increasing of oil price in the previous period.
5. Conclusions
This research has investigated the dependence structure between the world crude oil shocks and Vietnam’s oil- and gas-related stocks during the economic depression of 2011–2012. Our estimation was carried out by using the theory of copulas to detect of the contagion. More specifically, approximately nine copulas including Gauss, Clayton, Rotated-Clayton, Plackett, Frank, Gumbel, Rotated-Gumbel, Student, Symmetrized-Joe-Clayton were studied to demonstrate the dependence structure of the world crude oil shocks and each oil and gas stock on Vietnam’s stock exchange in the three periods. In particular, GDP Vietnam had severely depressed in the period of 2011–2012 at a rate of about 5.25 percent. Further, oil and gas price in this period had steadily risen and driven up inflation rates as well as prices of all goods, services, and transportation sector were up. Accordingly, the research used copulas to examine the dependence structure based on the study of the world crude oil price shocks and the Vietnam’s biggest oil and gas stocks in order to test the contagion of world crude oil to some stocks in the economic depression.
The results obtained from the copula modeling could provide some interesting findings. The results show that there exists dependence structure changes. More specifically, fluctuations in world oil price have significant impact on the financial performance of PVS, PVG, and PET in the pre-depression period. Ever since, the recent economic depression of 2011–2012, it is a growing concern, but the study finds no evidence of the relationship between world oil price fluctuations and stock returns of oil-related firm in listed firms. On the other side, results from the effect post-depression period suggest that world oil price shocks can affect stock returns of giant oil- and gas-related firms. This is because of the fact that a larger business has more competitive advantages under economies of scale, in which cost per unit of output can decline with increasing scale so that a firm could be are more effective.
Author contributions
V.C.N. wrote the introduction and theoretical framework. T.T.N. designed the research methodology, T.N.T. collected and analyzed the data and wrote the results. V.C.N. and T.T.N. reported the analysis and wrote the methodology section. V.C.N. and T.T.N. read and edited the last version of manuscript. All authors have read and agreed to the published version of the manuscript.
Conflicts of interest
The authors declare no conflict of interest.
correction
This article has been republished with minor changes. These changes do not impact the academic content of the article.
Additional information
Funding
Notes on contributors
Thu Thuy Nguyen
Thu Thuy Nguyen is a graduate of doctoral study at the National Economics University, Vietnam. She works for Thuongmai University in Hanoi and specializes in macroeconomics, and financial mathematics. She has published some scientific papers on worldwide.
Van Chien Nguyen
Van Chien Nguyen is a graduate of doctoral study at the Department of Economics of University of Colombo, Sri Lanka. He works for Thu Dau Mot University and his research interests are macroeconomics and finance.
Trong Nguyen Tran
Trong Nguyen Tran is a graduate of doctoral study at the Institute of Mathematics, is an institution of advanced research in mathematics, belonging to the Vietnam Academy of Science and Technology in Vietnam. He works for Academy of Policy and Development in Hanoi and specializes in macroeconomics, financial mathematics and public policy. He has published many reputed papers on the journals of mathematics, finance, and macroeconomics.
References
- Adam, M., Banbuła, P., & Markun, M. (2013). Dependence and contagion between asset prices in Poland and abroad. A copula approach. NBP Working Paper No. 169. https://ssrn.com/abstract=2369256
- Alaali, F. (2020). The effect of oil and stock price volatility on firm level investment: The case of UK firms. Energy Economics, 87(3), 104731. https://doi.org/10.1016/j.eneco.2020.104731
- Bagirov, M., & Mateus, C. (2019). Oil prices, stock markets and firm performance: Evidence from Europe. International Review of Economics & Finance, 61(3), 270–20. https://doi.org/10.1016/j.iref.2019.02.007
- Blanca, M. J., Arnau, J., López-Montiel, D., Bono, R., & Bendayan, R. (2013). Skewness and kurtosis in real data samples. Methodology, 9(2), 78–84. https://doi.org/10.1027/1614-2241/a000057
- Boubaker, A., & Salma, J. (2011). Detecting financial markets contagion using copula Functions. International Journal of Management Science and Engineering Management, 6(6), 443–449. https://doi.org/10.1080/17509653.2011.10671194
- Cherubini, U., Luciano, E., & Vecchiato, W. (2004). Copula methods in finance. John Wiley & Sons Ltd.
- Dtinews. (2013). Petroleum price hike drives up inflation rates in big cities. Dantri International, Business News. Retrieved April 16, 2020, from http://dtinews.vn/en/news/018/30205/petroleumprice-hike-drives-up-inflation-rates-in-big-cities-.html
- Hamilton, J. D. (1983). Oil and the macro-economy since World War II. Journal of Political Economy, 91(2), 228–248. https://doi.org/10.1086/261140
- Huang, W., & Mollick, A. V. (2020). Tight oil, real WTI prices and U.S. stock returns. Energy Economics, 85(1), 104574. https://doi.org/10.1016/j.eneco.2019.104574
- Iavorskyi, M. (2013). The impact of capital structure on firm performance: evidence from Ukraine. Kyiv School of Economics. Retrieved April 16, 2020, from http://www.kse.org.ua/download.php?downloadid=306
- Inkenberry, G. J. (1986). The irony of state strength: Comparative responses to the oil shocks in the 1970s. International Organization, 40(1), 105–137. https://doi.org/10.1017/S0020818300004495
- Kamran, H. W., Haseeb, M., Nguyen, V. C., & Nguyen, T. T. (2020). Climate change and bank stability: The moderating role of green financing and renewable energy consumption in ASEAN. Talent Development and Excellence, 12(2s), 3738–3751. http://iratde.com/index.php/jtde/article/view/1280/979
- Kocaarslan, B., & Soytas, U. (2019). Asymmetric pass-through between oil prices and the stock prices of clean energy firms: New evidence from a nonlinear analysis. Energy Reports, 5, 117–125. https://doi.org/10.1016/j.egyr.2019.01.002
- Licklider, R. (1988). The power of oil: The Arab oil weapon and the Netherlands, the United Kingdom, Canada, Japan, and the United States. International Studies Quarterly, 32(2), 205–226. https://doi.org/10.2307/2600627
- Lv, X., Lien, D., & Yu, C. (2020). Who affects who? Oil price against the stock return of oil-related companies: Evidence from the U.S. and China. International Review of Economics & Finance, 67, 85–100. https://doi.org/10.1016/j.iref.2020.01.002
- Micceri, T. (1989). The unicorn, the normal curve, and other improbable creatures. Psychological Bulletin, 105(1), 156–166. https://doi.org/10.1037/0033-2909.105.1.156
- Mukherjee, S., Bhattacharjee, S., Paul, A., & Banerjee, U. (2020). Assessing green human resource management practices in higher educational institute. Test Engineering and Management, 82(1), 221–240. http://testmagzine.biz/index.php/testmagzine/article/view/972
- Nelsen, R. B. (2006). An introduction to copulas, springer series in statistics (2nd ed.). Springer.
- Nguyen, V. C. (2020). Human capital, capital structure choice and firm profitability in developing countries: An empirical study in Vietnam. Accounting, 6(2), 127–136. https://doi.org/10.5267/j.ac.2019.11.003
- Nguyen, V. C., Nguyen, T. T., & Nguyen, H. T. (2020). Government ability, bank-specific factors and profitability: an insight from banking sector of Vietnam. Journal of Advanced Research in Dynamical and Control Systems, 12(4), 415–424. https://doi.org/10.5373/JARDCS/V12I4/20201455
- O’Brien, D., & Weymes, L. (2010). The impact of oil prices on Irish Inflation. Quarterly Bulletin Articles, 3(3), 66–82. https://core.ac.uk/download/pdf/6377745.pdf
- Rodriguez, J. S. (2006). Measuring financial contagion: A copula approach. Journal of Empirical Finance, 14(3), 401–423. https://doi.org/10.1016/j.jempfin.2006.07.002
- Sibuya, M. (1960). Bivariate extreme statistics I. Annals of the Institute of Statistical Mathematics, 11(3), 195–210. https://doi.org/10.1007/BF01682329
- Tran, T. N., Nguyen, T. T., Nguyen, C., & Vu, T. H. (2020). Energy consumption, economic growth and trade balance in East Asia: A panel data approach. International Journal of Energy Economics and Policy, 10(4), 443–449. https://doi.org/10.32479/ijeep.9401
- Wattanatorn, W., & Kanchanapoom, T. (2012). Oil prices and profitability performance: Sector analysis. Procedia - Social and Behavioral Sciences, 40, 763–767. https://doi.org/10.1016/j.sbspro.2012.03.263
- Zhu, F., Zin, F., Wu, H., & Wen, F. (2019). The impact of oil price changes on stock returns of new energy industry in China: A firm-level analysis. Physica A: Statistical Mechanics and Its Applications, 532, 121878. https://doi.org/10.1016/j.physa.2019.121878