
 ?Mathematical formulae have been encoded as MathML and are displayed in this HTML version using MathJax in order to improve their display. Uncheck the box to turn MathJax off. This feature requires Javascript. Click on a formula to zoom.
Abstract
In this paper, two univariate generalised autoregressive conditional heteroskedasticity (GARCH) option pricing models are applied to Bitcoin and the Cryptocurrency Index (CRIX). The first model is symmetric and the other takes asymmetric effects into account. Furthermore, the accuracy of the GARCH option pricing model applied to Bitcoin is tested. Empirical results indicate that asymmetry is not an important factor to consider when pricing options on Bitcoin or CRIX, this is consistent with findings in the literature. In addition, the GARCH option pricing model provides realistic price discovery within the bid-ask spreads suggested by the market.
PUBLIC INTEREST STATEMENT
Cryptocurrencies have become very popular in recent years, not just among finance professionals, but also the general public. This focus of this paper is the pricing of financial instruments (derivatives) that depend on the prices of cryptocurrencies. Hence, a method for pricing these instruments in the absence if a well established cryptocurrency derivatives market is provided. The findings of this study will hopefully contribute to future research focusing on cryptocurrencies. Not only cryptocurrency derivative pricing, but also hedging, trading, and risk management of cryptocurrencies.
1. Introduction
Cryptocurrencies, and especially Bitcoin, have gained a lot of attention in recent years. A problem that the cryptocurrency market is currently facing, is that it does not have a well established derivatives market. This implies that there is no consensus regarding the pricing of options and other derivatives based on cryptocurrencies. Conventional wisdom among finance researchers is that the price of a derivative instrument is dependent on the value of the underlying asset. According to Barnes (Citation2018), cryptocurrencies have no intrinsic value. Barnes (Citation2018) further explains that cryptocurrencies have prices, which are generally unrelated to economic events and determined by interaction between supply and demand. Therefore, cryptoccurency derivative prices are dependent on cryptocurrency prices.
Madan et al. (Citation2019) explain that the cryptocurrency derivatives market is a young market and therefore different pricing methodologies are required for price discovery. Madan et al. (Citation2019) found that models that incorporate stochastic volatility generally perform well when applied to the pricing of cryptocurrency options. A possible solution is to rely on historical data; this was considered by Hou et al. (Citation2019) for the pricing of Bitcoin and Cryptocurrency Index (CRIX) options, with the focus on a stochastic volatility model with correlated jumps.
In this paper, the generalised autoregressive conditional heteroskedasticity (GARCH) option pricing model is applied to Bitcoin and CRIX. We consider symmetric and asymmetric GARCH models to assess the impact of asymmetric effects on the implied volatility of cryptocurrencies.
The process works as follows, the univariate GARCH model parameters are calibrated to historical Bitcoin and CRIX returns (under the real world measure). Wilmott (Citation2007) explains that the value of an option can be shown to be the expectation of the discounted future payoff under the risk-neutral measure. Given the estimated parameters and the risk-neutral GARCH model dynamics, option prices are obtained for various strike prices and maturities using Monte Carlo simulation. The GARCH model implied volatility is then easily computed given the option prices (by inverting the classical Black-Scholes model). The pricing performance of the GARCH option pricing model is also tested by comparing the model prices to Bitcoin market option prices, and prices obtained using the Heston stochastic volatility model.
In a similar study, Dyhrberg (Citation2016) made use of univariate GARCH models (symmetric and asymmetric) to assess the financial asset capabilities of Bitcoin. The empirical results of this study indicate that the volatility of Bitcoin reacts similarly to positive and negative news. However, the focus of this paper is on symmetric and asymmetric effects of cryptocurrencies in an option pricing context, and how option prices can be obtained in the absence of a well-established derivatives market (by making use of historical data).
The rest of this paper is structured as follows. In Section 2 the recent and relevant literature is considered. Section 3 focuses on the theoretical framework in which the GARCH option pricing framework is outlined. In Section 4, the statistical properties of the dataset and estimation method is considered. Section 5 focuses on the empirical results, and Section 6 outlines the concluding remarks.
2. Literature review
Research focusing on cryptocurrency volatility is well documented. In a recent study, Kurihara and Fukushima (Citation2018) made use of different univariate GARCH models to analyse Bitcoin volatility. Both symmetric and asymmetric GARCH models were considered. The overall conclusion is that there is not much difference when symmetric and asymmetric GARCH models are compared, and that traders should consider both short and long term volatility when examining Bitcoin prices.
In a similar study, Katsiampa (Citation2017) considered a wide range of univariate GARCH models for the modelling of Bitcoin volatility. In this study, the best fitting model was determined using the Akaike, Bayesian and Hannan-Quinn information criterion. The empirical results indicate that the autoregressive component GARCH model is the best performing model. This highlights the importance of both short and long run volatility components of the conditional variance.
According to Chu et al. (Citation2017), with the exception of Bitcoin, there is limited research focused on the GARCH modelling of cryptocurrencies. Chu et al. (Citation2017) considered a range of different GARCH models and error distributions applied to seven different cryptocurrencies. Empirical results indicate that the normal distribution is the best performing error distribution, and that the symmetric integrated GARCH model is the best fitting model in most cases.
Ardia et al. (Citation2019) tested the value-at-risk forecasting ability of the Markov-switching GARCH model when applied to Bitcoin. Ardia et al. (Citation2019) argues that the application of other GARCH type models in the presence of regime changes lead to poor risk forecasts. The results indicate that the two regime Markov-switching GARCH models are the most reliable when forecasting Bitcoin risk.
According to Madan et al. (Citation2019), the Bitcoin derivatives market is a young, but growing market. Shi and Shi (Citation2019) explain that BTC futures were introduced in 2012, this was done to provide investors with additional trading tools for BTC. In 2014 more BTC derivatives such as BTC swaps and options emerged. Karkkainen (Citation2018) analysed BTC futures using vector autoregressive and vector error correction models. The author’s empirical results indicate that futures lead price discovery in the BTC market. This is consistent with existing literature of futures-spot market price discovery.
To illustrate how cryptocurrency derivatives can be used, Sebastião and Godinho (Citation2019) investigated the hedging properties of BTC futures. The authors considered an equal and opposite hedge, as well as optimal hedge ratios estimated using the ordinary least squares, and dynamic conditional correlation GARCH approach. The hedge effectiveness was determined by comparing the variance, semivariance, and expected shortfall of the hedged portfolio to the unhedged position. Their empirical results show that BTC futures are effective hedge instruments for BTC and also other cryptocurrencies.
Madan et al. (Citation2019) made use of option price data collected from various unregulated exchanges to construct various Bitcoin volatility surfaces. Furthermore, different Markov models were calibrated to the volatility surfaces to determine the best performing model. The empirical results indicate that the classical Black-Scholes model does not capture the volatility surface well and that models including some notion of stochastic volatility perform better. However, the GARCH option pricing model was not considered.
In a recent study, Pagnottoni (Citation2020) made use of a neural network approach for the pricing of Bitcoin options, where the classical models, namely the trinomial tree model, Monte Carlo simulation, and finite difference methods were used as input layers. The empirical results show that Bitcoin option prices are overpriced when classical methods are considered, and that the use of the neural network model significantly improves pricing performance.
Hou et al. (Citation2019) mentioned that research based on cryptocurrency derivatives is limited despite its necessity, and that cryptocurrency derivatives trading on unregulated exchanges have recently increased significantly. Hou et al. (Citation2019) proposed a stochastic volatility model with correlated jumps. The empirical results indicate that the pricing mechanism underscores the importance of jumps in the cryptocurrency derivative markets. The theoretical framework is considered in the next section.
3. Theoretical framework
Duan (Citation1995) assumes the following regarding the dynamics of the underlying asset under the real world measure ,
where is the value of the underlying asset (Bitcoin or CRIX) at time
is the continuously compounded risk-free rate (because BTC and CRIX are expressed in USD, the United States three-month treasury bill rate is used as a proxy for the risk-free rate, consistent with Hao & Zhang, Citation2013),
is the unit risk premium, the conditional variance
is driven by some GARCH process and the error term
and
is the information set available at time
. The assumption of a normal distribution is appropriate based on the findings by Chu et al. (Citation2017).
In this paper, two driving GARCH processes are considered, the GARCH(1,1) and the Glosten, Jagannathan, and Runkle (GJR) GARCH(1,1). The former is a symmetric model, which implies that positive and negative shocks have the same effect on volatility, the latter takes asymmetry into account. According to Hansen and Lunde (Citation2005), the GARCH(1,1) is highly robust and it is challenging to find a different GARCH model that produces consistent outperformance. Therefore, the GARCH(1,1) model is used as a benchmark in this study. Furthermore, Peng et al. (Citation2018) compared different univariate GARCH models when applied to exchange rate and cryptocurrency volatility forecasting. Their results indicate that the GJR-GARCH(1,1) is the best performing model. Therefore, the asymmetric GJR-GARCH(1,1) model is included in this study.
According to Alexander (Citation2008), the symmetric GARCH(1,1) model takes the following form under the real world measure :
Furthermore, the real world GJR-GARCH dynamics are given by:
where the indicator function takes a value of one when shocks are negative, and zero otherwise. Under the risk-neutral measure
Hao and Zhang (Citation2013) show that the log-return dynamics are as follows:
where . Under the measure
the GARCH dynamics in EquationEquations (1
(1)
(1) ) and (Equation2
(2)
(2) ) take the following form, respectively:
and
Conventional wisdom amongst quantitative finance researchers is that the price of an option is equal to the expectation of the discounted payoff under the risk neutral measure (Wilmott, Citation2007). In this paper, Monte Carlo simulation (given estimated parameters, and by making use of EquationEquations (3(3)
(3) )–(5)) is used to approximate the discounted payoff of vanilla options with various different strike prices and maturities. Given the price of an option (obtained using the relevant GARCH option pricing model), the implied volatility is easily obtained by inverting the Black-Scholes formula.
The pricing performance of the GARCH option pricing model is tested by comparing prices obtained using the GARCH option pricing model to BTC market option prices and the Heston stochastic volatility model (based on the work by Madan et al., Citation2019). The application of the Heston stochastic volatility mode is an existing method for pricing BTC derivatives. According to Glasserman (Citation2013), the risk-neutral asset price and volatility dynamics in the Heston framework are given by,
where is the variance mean reversion speed,
is the long-run mean of the variance,
is the volatility of the variance, and
is the correlation between the variance and the asset price. A closed form solution does exist for European put and call options, therefore the model is generally calibrated to market option prices (or implied volatility). The data and estimation of GARCH model parameters are discussed in the next section.
4. Data and estimation
In this paper, the GARCH option pricing model is applied to Bitcoin and CRIX. The GARCH models are calibrated to historical data. The Bitcoin and US treasury bill historical data were obtained from the Thomson Reuters Datastream databank. The CRIX historical dataset was obtained from thecrix.de. The weighting scheme of the CRIX is outlined in Trimborn and Härdle (Citation2018). Daily data from the 1st of January 2016 to the 3rd of January 2020 for all variables were used for the estimation of parameters.
The descriptive statistics of Bitcoin (BTC) and CRIX log-returns are reported in Table below:
Table 1. Descriptive statistics: Log-returns
The results indicate that the means of the log-returns for both BTC and CRIX are close to zero. Moreover, both series indicate evidence of fat tails, this is consistent with the stylised facts of financial returns (Cont, Citation2001). The Jarque-Bera test statistics indicate that both series are not normally distributed. Finally, when the two series are compared, the means and standard deviations are similar, this is in line with expectations because the weighting of BTC is high when calculating CRIX (Trimborn & Härdle, Citation2018).
The GARCH model parameters (,
and
) are estimated using the
dynamics and the maximum likelihood method. The log-likelihood function for both models is given by:
where is the number of data points included in the estimation sample. The stationarity and non-negativity constraints of the GARCH(1,1) and GJR-GARCH(1,1) models are well documented in the literature. The results are considered in the next section.
5. Empirical results
In this section, the implied volatility surfaces of Bitcoin (BTC) and CRIX are considered. The importance of asymmetry is illustrated by comparing the implied volatility obtained from the symmetric model to the asymmetric model. Furthermore, the pricing performance of the GARCH option pricing is tested by comparing BTC option prices obtained from the GARCH option pricing model to market option prices, and prices obtained using the Heston stochastic volatility model.
The GARCH(1,1) and GJR-GARCH(1,1) implied volatility of BTC are plotted below:
Figure 1. BTC volatility surfaces.
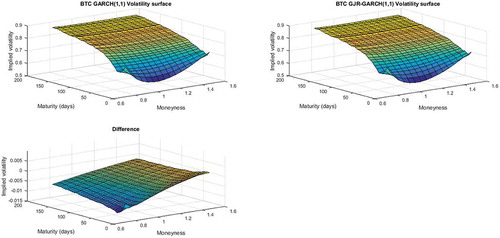
It is clear from Figure above that the GARCH(1,1) and GJR-GARCH(1,1) option pricing models produce a volatility surface that is consistent with what is generally observed in the market. The difference between the two volatility surfaces (GJR-GARCH(1,1) volatilityGARCH(1,1) volatility) remains small across different levels of moneyness and maturity. This suggests that asymmetric effects are not important when modelling BTC volatility. This is in line with findings by Dyhrberg (Citation2016) and Conrad et al. (Citation2018).
Figure 2. BTC volatility surfaces.
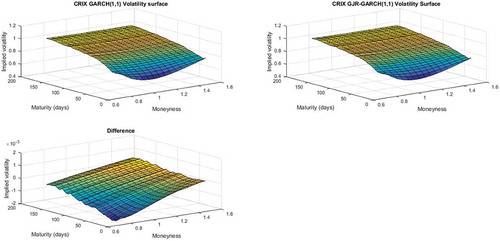
Figure illustrates the GARCH(1,1) and GJR-GARCH(1,1) implied volatility surfaces, and the difference between the two surfaces. Very small differences are observed when the two surfaces are compared. This implies that CRIX volatility reacts similarly to positive and negative shocks. This is in line with the BTC volatility surface; as mentioned previously, this is consistent with expectations.
The pricing performance of the GARCH option pricing model applied to cryptocurrencies is tested by comparing the model prices to market prices of three-month BTC vanilla call options. The market option prices (value date 29 June 2018) were obtained from Madan et al. (Citation2019). As shown above, asymmetry is not significant when pricing cryptocurrency options, therefore the pricing performance of the GARCH(1,1) model is considered. For this analysis, the GARCH(1,1) model is calibrated to log returns from the 1st of January 2016 to the 27 June 2018. The market and model prices are plotted below:
Figure 3. BTC option prices.
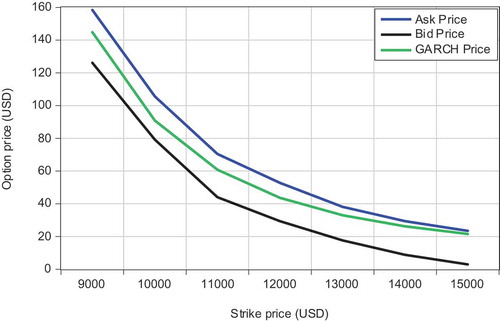
As shown in Figure above, the GARCH(1,1) option pricing model provides realistic price discovery within the bid-ask prices suggested by the market, and when compared with the prices obtained from the Heston model. It is also important to note that the Heston model is calibrated to market option prices, while the GARCH model parameters are calibrated to historical returns data.
6. Conclusion
In this paper, two different GARCH processes were applied to Bitcoin and CRIX. The first model is symmetric and assumes that positive and negative shocks lead to the same effect on volatility. The second model takes asymmetric effects into account. By comparing the volatility surfaces implied by the two models, it gives an indication of the importance of asymmetric effects when pricing options on Bitcoin or CRIX. Furthermore, the pricing performance of the GARCH option pricing model applied to Bitcoin was also considered.
The results indicate that asymmetric effects are not significant when pricing options on Bitcoin and CRIX, the differences obtained from the two surfaces are insignificant in each case. In addition, the prices obtained from the GARCH option pricing model are consistent with market Bitcoin option prices (within the bid-ask spread). Hence, the models can also be used to inform trading decisions, to determine whether option prices are consistent with what is implied by the historical data. Areas for future research include the use of different error distributions (which incorporate skewness and kurtosis) and different GARCH processes when applied to cryptocurrency option pricing.
Acknowledgements
The authors would like to thank the anonymous referees for their insightful comments and suggestions that helped improve the article considerably.
Additional information
Funding
Notes on contributors

Pierre J. Venter
Pierre J. Venter currently works in industry as a quantitative analyst. He is busy with a PhD in Actuarial Science at the University of Pretoria. He is also appointed as a research associate at the Department of Finance and Investment Management, University of Johannesburg. His research interests include quantitative finance and financial econometrics
Eben Mare
Eben Mare has worked as a portfolio manager in the asset management industry for the last 25 years. He holds a PhD in Applied Mathematics and holds a position as Associate Professor in the Department of Mathematics and Applied Mathematics at the University of Pretoria, South Africa. His research interests are in the financial markets and mathematical modelling.
Edson Pindza
Edson Pindza is a mathematician and an entrepreneur. He holds a PhD in Applied Mathematics and is an active researcher in the field of numerical analysis, cryptocurrency, cryptoassets and blockchain technology solutions.
References
- Alexander, C. (2008). Market risk analysis, practical financial econometrics. John Wiley & Sons.
- Ardia, D., Bluteau, K., & Rüede, M. (2019). Regime changes in Bitcoin GARCH volatility dynamics. Finance Research Letters, 29(2), 266–9. https://doi.org/10.1016/j.frl.2018.08.009
- Barnes, P. (2018). Crypto currency and its susceptibility to speculative bubbles, manipulation, scams and fraud. Journal of Advanced Studies in Finance (JASF), 9(2 (18)), 60–77. https://doi.org/10.14505//jasf.v9.2(18).03
- Chu, J., Chan, S., Nadarajah, S., & Osterrieder, J. (2017). GARCH modelling of cryptocurrencies. Journal of Risk and Financial Management, 10(4), 17. https://doi.org/10.3390/jrfm10040017
- Conrad, C., Custovic, A., & Ghysels, E. (2018). Long-and short-term cryptocurrency volatility components: A GARCH-MIDAS analysis. Journal of Risk and Financial Management, 11(2), 23. https://doi.org/10.3390/jrfm11020023
- Cont, R. (2001). Empirical properties of asset returns: Stylized facts and statistical issues. Quantitative Finance, 1(2), 223–236. https://doi.org/10.1080/713665670
- Duan, J. C. (1995). The GARCH option pricing model. Mathematical Finance, 5(1), 13–32. https://doi.org/10.1111/j.1467-9965.1995.tb00099.x
- Dyhrberg, A. H. (2016). Bitcoin, gold and the dollar - A GARCH volatility analysis. Economic Letters, 16(1), 85–92. http://www.sciencedirect.com/science/article/pii/S1544612315001208
- Glasserman, P. (2013). Monte Carlo methods in financial engineering (Vol. 53). Springer Science & Business Media.
- Hansen, P. R., & Lunde, A. (2005). A forecast comparison of volatility models: does anything beat a GARCH(1,1)?. Journal of applied econometrics, 20(7), 873-889. doi:10.1002/(ISSN)1099-1255
- Hao, J., & Zhang, J. E. (2013). GARCH option pricing models, the CBOE VIX, and variance risk premium. Journal of Financial Econometrics, 11(3), 556–580. https://doi.org/10.1093/jjfinec/nbs026
- Hou, A. J., Wang, W., Chen, C. Y. H., & Härdle, W. K. (2019). Pricing cryptocurrency options: The case of bitcoin and CRIX. Available at SSRN 3159130.
- Karkkainen, T. (2018). Price discovery in the bitcoin futures and cash markets. Available at SSRN 3243969. https://doi.org/10.2139/ssrn.3243969
- Katsiampa, P. (2017). Volatility estimation for Bitcoin: A comparison of GARCH models. Economics Letters, 158(9), 3–6. https://doi.org/10.1016/j.econlet.2017.06.023
- Kurihara, Y., & Fukushima, A. (2018). How does price of Bitcoin volatility change? International Research in Economics and Finance, 2(1), 8. https://doi.org/10.20849/iref.v2i1.317
- Madan, D. B., Reyners, S., & Schoutens, W. (2019). Advanced model calibration on bitcoin options. Digital Finance, 1(1–4), 117–137. https://doi.org/10.1007/s42521-019-00002-1
- Pagnottoni, P. (2020). Neural network models for Bitcoin option pricing. Front AI and Financial Technology, 2(5), 62-70. https://doi.org/10.3389/frai.2019.00005
- Peng, Y., Albuquerque, P. H. M., De Sá, J. M. C., Padula, A. J. A., & Montenegro, M. R. (2018). The best of two worlds: Forecasting high frequency volatility for cryptocurrencies and traditional currencies with support vector regression. Expert Systems with Applications, 97(7), 177–192. https://doi.org/10.1016/j.eswa.2017.12.004
- Sebastião, H., & Godinho, P. (2019). Bitcoin futures: An effective tool for hedging cryptocurrencies. Finance Research Letters, 33(2), 1-6. https://doi.org/10.1016/j.frl.2019.07.003
- Shi, S., & Shi, Y. (2019). Bitcoin futures: Trade it or ban it? The European Journal of Finance, 25(16), 1–16. https://doi.org/10.1080/1351847X.2019.1647865
- Trimborn, S., & Härdle, W. K. (2018). CRIX an index for cryptocurrencies. Journal of Empirical Finance, 49(1), 107–122. https://doi.org/10.1016/j.jempfin.2018.08.004
- Wilmott, P. (2007). Paul Wilmott introduces quantitative finance. John Wiley & Sons.