?Mathematical formulae have been encoded as MathML and are displayed in this HTML version using MathJax in order to improve their display. Uncheck the box to turn MathJax off. This feature requires Javascript. Click on a formula to zoom.
Abstract
This paper explores the symmetric and asymmetric dependency structure of decomposed return series of Gold and eight cryptocurrencies to establish the hedging and diversification potentials of these asset classes. Daily data spanning 30 April 2013 to 18 April 2019 are employed within the Ensemble Empirical Mode Decomposition and Quantile-in-Quantile regression techniques. Our empirical results provide evidence that cryptocurrencies and Gold can both hedge and diversify for each other at different conditional distributions of their returns. We also find that cryptocurrencies are not purely speculative but can be driven by medium- and long-term fundamentals. In addition, both Gold and cryptocurrencies can be hedge and diversifiers for other traditional asset classes such as crude oil, fiat currencies, and other commodities.
PUBLIC INTEREST STATEMENT
This research is important for all stakeholders in the financial and commodities markets. Since the emergence of cryptocurrencies, there has been heightened concern about how they affect investment in conventional assets such as gold. It is, therefore, important to find approaches to reduce the risks cryptocurrencies pose, but more importantly, to benefit from them by building portfolios with gold to take advantage of the peculiar properties of cryptocurrencies. In this study, we have used techniques that can help investors achieve this by addressing the behaviour of these assets and matching them with the time-dependent nature of investor preferences. We find that gold and cryptocurrencies can help protect (hedge) investors against unfavourable price changes in other conventional assets such as crude oil, currencies, and other commodities.
1. Introduction
Digital currencies which rely on cryptographic proofs for confirmation of transactions referred to as cryptocurrencies (cryptos) emerged in 1983 following the seminar paper of (Chaum, Citation1983). These currencies differ from fiat currencies by its unique combination of three features: ensuring limited anonymity, independence from a central authority, and double-spending attack protection. The interest on cryptos heightened following achievement of these three features by Nakamoto (Citation2008) in the paper “A Peer to Peer Electronic Cash System” and the subsequent introduction of Bitcoin on 3 January 2009 (Lansky, Citation2018). As of April 2019, over 2000 cryptos were in existence compared to a little above 600 in January 2016 (Lansky, Citation2018) and 1622 as of May 2018 (Klein et al., Citation2018), with a total market capitalisation of over 240 USD billion. This signifies a rapid growth in a short time span. According to Klein et al. (Citation2018), cryptos have become attractive due to embodied innovative technology, high-security architecture, prosperity in functionalities, and investment opportunity as an asset.
The emergence of cryptos has widened the investment and diversification platforms available to global investors. Cryptocurrencies have been likened to gold, which for years have been used as a hedge and safe-haven against assets like stocks, bonds, and other monetary assets (Baur & Lucey, Citation2010; Baur & McDermott, Citation2010, Citation2016; Klein et al., Citation2018). Research on the potential of some cryptos (usually Bitcoin) to act as a hedge and safe-haven similar to gold has emerged (Bouri, Gupta et al., Citation2017; Bouri, Jalkh et al., Citation2017). They have become recognised as a new gold in digital form because of similarities in traits as highlighted in Dyhrberg (Citation2016). These similarities between cryptos and gold include scarcity, the cost involved in the extraction, and non-interference or control by government. Cryptocurrencies, however, could differ from gold by exhibiting the characteristics of fiat currency, making them hybrid commodities. As a choice of alternative investment, Das and Kannadhasan (Citation2018) posit that risk-averse investors may prefer gold, however, investors with speculative motive may opt for cryptocurrency, such as Bitcoin. Such dynamics occasion the need to explore further and generate a better understanding of the dynamic interactions between cryptos and gold.
This has generated a plethora of studies examining the interdependency structure of some cryptos (mostly, Bitcoin) and gold prices (Das & Kannadhasan, Citation2018; Dyhrberg, Citation2016; Klein et al., Citation2018; Zwick & Syed, Citation2019). However, the price generation process involves multiple factors that relate to economic characteristics of the structure of these markets which make it difficult to understand (Di Matteo et al., Citation2003). The complexity of the price generation process interrogates the validity of natural law of scale-invariance or fractals of a self-similar process to reflect the behavioural market theory known as the heterogeneous market hypothesisrogeneous market hypothesis (HMH) (Müller et al., Citation1993). The HMH sees market participants as heterogeneous with different information, objectives, and varying investment horizons. Such market participants react to the information at different times, which makes market data mixed and noisy. This causes the price series of cryptocurrency and gold to exhibit non-linearity, non-stationarity, and long memory.
It is clear that the potential of non-linearity in the data generating process of these prices renders the use of classical linear models inappropriate. The complex nature of such time series has increased time-frequency representations such as Short-time Fourier transform (Yunhong et al., Citation1998), Wavelet transform (Hu et al., Citation2009), and adaptive optimum kernel time-frequency representation (Liao et al., Citation2015; Wang et al., Citation2011) in modelling the behaviour of the series by determining the frequencies present, the strength of the frequencies, and their patterns over time (Nava et al., Citation2018b, Citation2018a). However, these methods are deficient in handling the complex dynamics of these types of time series. For example, Fourier analysis is effective in studying periodic and stationary time series whose properties do not change much over time while wavelet transform is inaccurate in detecting the event under noisy conditions (Xiao et al., Citation2017). In addition, these methods require a priori-basis selection which confounds the economic interpretation or meaning of the analysis.
Ostensibly, these methods have been used by previous studies in analysing the relationships between cryptos and gold prices in spite of the weakness outlined. For example, Das and Kannadhasan (Citation2018) employed wavelet-based approach, Zwick and Syed (Citation2019) used threshold regression model while Klein et al. (Citation2018) utilized BEKK-GARCH to examine the relationship between Bitcoin and gold. This leads to inaccurate identification of hidden structures embedded in the data, the validity of a conclusion drawn from the analysis, and its policy implications.
Recently, the empirical mode decomposition (EMD) method (R. D. Huang et al., Citation1996; N. E. Huang et al., Citation1999; Huang, Citation1998) for analysing the non-linear and non-stationary signal data is proposed. Unlike the previous methods, such as the wavelet analysis and spectrum analysis, EMD eliminates the need for an apriori basis selection and addresses the weakness of competing model to correctly identify the hidden structures embedded in the data. According to Huang (Citation1998), the EMD technique assumes that the financial time series has many intrinsic mode functions (IMFs) of different oscillations which must satisfy two conditions: (1) it has the same number of extremum and zero-crossing or differs by one at the most and (2) it is symmetric with the local zero mean. In spite of these strengths, the standard EMD suffers from mode-mixing making physical meaning of individual IMF unclear. As a way of improvement, the ensemble empirical mode decomposition (EEMD) which corrects the issue of mode-mixing is introduced (Wu & Huang, Citation2009). The EEMD has been recently applied to financial time series decomposition (Li et al., Citation2018; Wu & Huang, Citation2009; Xu et al., Citation2016; N. Zhang et al., Citation2017).
This study follows Bouri, Gupta et al. (Citation2017) and Das and Kannadhasan (Citation2018) to analyse the asymmetric and symmetric dependency structure of decomposed series by quantile-in-quantile regression (QQR) but deviates from these studies by using EEMD instead of wavelets decomposition. Bouri, Gabauer et al. (Citation2020) also examines the volatility connectedness of cryptocurrencies in the midst of investor happiness using the QQR technique without EEMD decomposition (see also Tweneboah et al., Citation2020). Owusu Junior et al. (Citation2020), on the other hand, employ both the EEMD and QQR on spot and futures of energy and precious metal prices in India. The advantage of this method lies in the strength of EEMD to efficiently decomposed non-linear and non-stationary series which improve the quality of the decomposed series. The paper makes two contributions to literature. First, to our knowledge this the first paper to employ EEMD-based QQR to analyse the dependency structure of cryptos and gold. Second, although there are more than 2000 cryptos available, the extant literature concentrated on mostly Bitcoin, this study expands the discussion to seven other cryptos based on a longer span of data available. Owusu Junior and Tweneboah (Citation2020) employ the EEMD-based QQR to examine the asymmetric linkages between major African stock returns and exchange rates.
Our empirical results reveal that cryptos and gold can both hedge and diversify for each other at different conditional distributions of their returns. We also find that cryptos are not purely speculative but can be driven by medium- and long-term fundamentals. In addition, both gold and cryptos can be hedge and diversifiers for other traditional asset classes such as oil, currencies, and other commodities.
2. Models and methodologies
2.1. Ensemble empirical mode decomposition (EEMD)
We employ the ensemble empirical mode decomposition (EEMD), QR, and QQR techniques for our analysis. This involves a two-step approach by which we extract intrinsic mode functions (IMFs) from gold and returns of the selected cryptos with EEMD. We then proceed to estimate bi-directional regressions with QR the QQR methods at different frequencies. The IMFs, representing different time scales, are important in this study given the non-linearity and non-stationarity within our series (Ivanov, Citation2013).
As a potential successor of empirical mode decomposition (EMD), the EEMD improves the former by an objective intermittence test on a white noise-added signal (data) which allows the mean to be treated as the final true results (Wu & Huang, Citation2009). The EEMD sifts through the original series with a sufficient number of iterations. With the added white noise, it provides a uniform reference in the time-frequency space essential in this study and in line with the EEMD. We provide a brief description of the EEMD methodology based on Wu and Huang (Citation2009).
The EEMD defines the IMF components as the mean of an ensemble of trials, where each is made of the signal (data) and a white noise of finite amplitude. In generic terms, all data are a sum of signal (that is actual data,
) and noise
so that
While many data analysis techniques have failed to remove this noise component, the EEMD adds white noise to remove weak signals (to keep the true signal). This is based on inspirations from Flandrin et al. (Citation2004), Gledhill (Citation2003), and Wu and Huang’s (Citation2009) EEMD improves upon EMD and the works of the above authors by using the cancellation (effects) principleFootnote1 associated with an ensemble of noise-added cases to improve results. This improvement stems from overcoming the problems of scale separation and mode mixingFootnote2 associated with the EMD without a subjective test (known as noise-assisted data analysis (NADA)) on the original data. Scale separation is a problem linked to the intermittency test aimed at fixing mode mixing problem based on a subjective selection of scales (Wu & Huang, Citation2009).
From EquationEquation (1)(1)
(1) an
artificial observation,
is realised by adding a white noise of different realisations, which avoids mode mixing which provides a relatively uniform reference scale distribution to facilitate EMD.
The development of EEMD relies on the properties of EMD of Huang Norden et al. (Citation1998) and N. E. Huang et al. (Citation1999) as follows:
Add a white noise to the targeted data to arrive at
Decompose
into IMFs
Iterate 1 and 2 with varying white noise series and
Obtain the (ensemble) means of corresponding IMFs of the decomposition as the final result.
The desirable features of the EEMD are that the randomly added white noise series will cancel out each other in the final rendition of the respective IMFs. Hence, mean IMFs reside within the natural dyadic filter windows which sidesteps the mode mixing problem. The largest number of IMFs (and one residual
) of a data set is approximately
where
denoted the total number of data points. Thus,
can be represented as
.
2.2. The QR and QQR approaches
The QQR technique is the non-parametric version of quantile regression that empirically justifies the conditional quantile relationship between two or more variables. The QQR technique is assumed to combine one of quantile regression and non-parametric estimators. To study bearish and/or bullish relationship between gold and cryptocurrencies, the QQR technique seems appropriate. In terms of price patterns, quantiles can describe asymmetry between high and low returns as well as capturing possible non-stationarity in the series. In this study, we look at this nexus starting with
where and
denote the gold and cryptocurrency returns at period t, θ is the θth quantile of the conditional distribution of
and
is the error quantile whose θth conditional quantile is made-up to be zero, and
represents the slope of this relationship. One can view EquationEquation (3)
(3)
(3) as the quantile regression, from which QQR can be derived.
The EquationEquation (3)(3)
(3) can be extended by a first-order Taylor expansion of a quantile of
as follows:
whereexplains the partial derivative of
, indicative of a marginal effect as the slope. We see that θ is the functional form of
and
while τ is the functional form of
and
, hence θ and τ are the functional forms of
and
. If we represent
and
by
and
, respectively, then
can suffice. By substituting EquationEquation (5)(5)
(5) into (Equation3
(3)
(3) ), we arrive at the EquationEquation (6)
(6)
(6) as follows:
where, (*) gives the conditional quantile of θth of gold returns. Further, it reveals the actual association between the quantile of cryptocurrency returns (θth) and the quantile of gold returns (τth) of parameters and
with indices of θ and τ. The QQR is based on linear regression in the neighbourhood of
at which point stationarity can be relaxed (see Bouri, Gabauer et al., Citation2020; Tweneboah et al., Citation2020). Further, we can imply local stationarity from Baruník & Křehlík (Citation2018). Hence, the QR and QQR estimations can be performed without the need for the series to be stationary.
As in ordinary least squares (OLS), a similar minimisation is applied to arrive at EquationEquation (7)(7)
(7)
where is the quantile loss function representing as
, i is the function of indicator,
is the kernel density function and h denotes kernel density function bandwidth parameter. The kernel function weights the observations of
where the minimal weights are negatively related to the distribution function of
as
. In line with Sim and Zhou (Citation2015) we use
for empirical QQ analysis which is the bandwidth for the quantiles. The bandwidth is the partition of the quantiles and determines the smoothness of the estimation results. Smaller bandwidths are preferred to larger ones as the latter may induce bias in the estimated coefficients. We note that in the case where gold is the independent variable the equations can be modified accordingly. We use the least-squares cross-validation (LSCV) kernel with lag 1, based on Breslaw (Citation1992) for estimations in this paper.
By using QR and QQR to quantify the relationship between gold and cryptos with IMFs as inputs, not only are we able to capture the time-varying non-linear non-stationary link, we are also able to infer the nexus during both bear and bull return episodes at short-, medium-, and long-terms. As the first of a few studies of this nature, our paper provides fresh insights for different types of gold investors to satisfy their profit-maximising or risk-minimising goals.
3. Data and preliminary analysis
We present the sampled cryptos in Table . Selection is based on a large span of available data for which the same number of IMFs are obtained. We also consider the market capitalisation in the selection of cryptos. For example, Bitcoin (64%), Ethereum (22%), Ripple (5%), Litecoin (2%), and others (8%) (Y. Zhang et al., Citation2019). All cryptos data are gleaned from CoinMarketCapFootnote3 but gold data is taken from the Bloomberg Terminal; and are quoted in USD. For the purposes of this study, gold is matched with each cryptocurrency according to time span and trading days. The return series is decomposed into a number of IMFs depending on the length of series and they represent short-term, medium-term, and long-term dynamics. We select IMF 1, IMF 5, and IMF Residual to represent short-, medium-, and long-term dynamics, respectively, in line with the extant literature.
Table 1. Summary of sample data
We present the summary statistics of gold and returns of the selected cryptos and the number of IMFs in Table . We find both left and right skewness and excess kurtosis are corroborated by the Shapiro-Wilk test of normality. These confirm asymmetries in the distributions of the series. We also find similar patterns for the IMFs across the time-scales. Further, IMFs seem to be useful as inputs for the regression techniques in the light of frequency-variations in the time series. These provide further motivation to employ quantile-based regressions to analyse the gold-cryptos nexus. The times series plots presented in (in the Appendices) also show volatility clusters and thus an indication of time-varying risk emanating from the series.
Table 2. Summary statistics and stationarity tests of gold and cryptocurrencies returns and their IMFs
4. Empirical results: asymmetric regression results
4.1. QR results
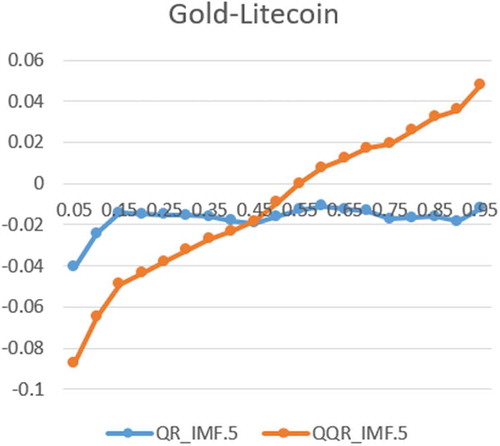
In this study, we surmise a bi-directional nexus between gold and cryptocurrencies and we perform regressions accordingly. For clarity of presentation and want of space, we elect to plot the regression coefficients, rather than present the actual coefficients in tables.Footnote4 These are presented in Figure . We note that both QR (lines in wine colour) and QQR (lines in blue colour) estimates are in the same plots. Apart from Figure providing a pictorial representation of the gold-cryptos link in terms of magnitude and direction, it also engenders a basis to validate estimates from the QQR technique—this is further explained in Section 4.2. In the plots, we note that the pair with Gold as the first variable and crypto as the second variable (e.g., Gold-Bitcoin) implies Gold is the dependent variable and Bitcoin is the independent variable (hereafter referred to as from). The reverse is true (hereafter referred to as to). Thus, in the QR Gold-Bitcoin implies the quantile returns of Gold are regressed on the returns of Bitcoin. But for QQR, the quantile returns of Gold are regressed on the corresponding quantile returns of Bitcoin. The same analogy applies to Bitcoin-Gold, for instance.
We advise the reader that the plots in Figure are constructed with the background that the bi-directional gold-cryptos link at the composite level (returns without decomposition) and in the short-term (IMF1) are mostly insignificant at the conventionalFootnote5 levels of significance. Significance is attained in the medium-term (IMF5) and long-term (IMFR). We further observe that, in the case of Ethereum, there is no significant link with gold throughout. This may be quite surprising given the place of Ethereum in the cryptos space. For instance, it has attracted a great deal of attention and rivalled Bitcoin as the second-ranking crypto in their early years (Mensi et al., Citation2018). Therefore, we present the results for all gold-cryptos pairs in the medium- and long-terms except for Ethereum.
We also present the Augmented Dickey-Fuller (ADF) unit root test to examine the stationarity properties of the series (Table ). For the ADF without drift and trend at lag 1, most of the series exhibit stationarity at the 5% significance level. We find that the IMFR for gold is non-stationary and this is to be expected since the series represents a trend in the long-term. However, the IMFR the cryptos are mostly stationary, except for XRP. Nonetheless, as explained in Section 2.2, we do not require strict global stationarity in the series in order to perform the QR and QQR estimations in this study. Hence, all the series in Table are used in our estimations and analysis.
It is clear from the coefficient estimates that composite and short-term gold-cryptos links can be spurious. Investors may be caught in the frenzy about cryptos (especially Bitcoin) as the new gold (Dyhrberg, Citation2016) in the short-term. Further, from an econometric perspective, a claim by Klein et al. (Citation2018) that Bitcoin does not bear a resemblance to any other conventional asset, may be supported. Nonetheless, if we follow the definition of a hedge by Baur and Lucey (Citation2010), we can deem these insignificant coefficients to imply that gold and cryptocurrencies are uncorrelated, which suggests that gold and cryptos can hedge each other at the competitive level and in the short-term. Further, we may see the unconditional connectedness between cryptos and gold as negligible as found by (Kurka, Citation2019). However, with time investors may rebalance their portfolios with after a careful assessment of the market. This may serve as a reminder that Weber’s (Citation2016) Bitcoin standard may be far-fetched. But this could support the assertion that cryptos may not be adopted by states by reason of their risks (Lansky, Citation2018). Notwithstanding, this scenario corroborates the findings of Bouoiyour et al. (Citation2016), using EMD that Bitcoin, for instance, is driven by long-term fundamentals as opposed to being labelled as a purely speculative asset class. Further, Kristoufek (Citation2015) find Bitcoin to possess both speculative and standard financial asset properties (see also, Zwick & Syed, Citation2019). Thus, we surmise that it takes some time and detailed analysis for noteworthy relationships between gold and cryptos to be revealed; as we have done in this study.
At this juncture, we analyse the QR estimates. We refer to blue colour plots in Figure . We observe that from and to share a similar pattern in the medium- and long-terms. The coefficients of the former are smaller and the plots are smoother than those of the former. However, estimates are somewhat smooth until the 75th quantile and take jumps afterwards. In the extreme upper tails, we realise the links are strongest. In general, we find that the magnitude of both from estimates rise from lower quantiles through to upper quantiles, except for Dash, Litecoin, and Ripples (which exhibit a reverse pattern). But for to estimates, links fall from lower quantile to upper quantiles; and are steeper after the 75th. Exceptions are noted for Dash, Litecoin, NEM (rise steadily), Stellar (in the long-term), Monero (fall, rise, and fall again), and Ripple (fall steadily and rise in the medium-term). These patterns show us how the two asset classes are linked as per trends in the market. So we see the asymmetric nature of the nexus which should be instructive, in generic terms, for investment strategies involving these asset classes.
Figure 1. Return and IMF plots of gold and cryptocurrencies.
Figure 2. Bi-directional gold and cryptos QR and QQR.
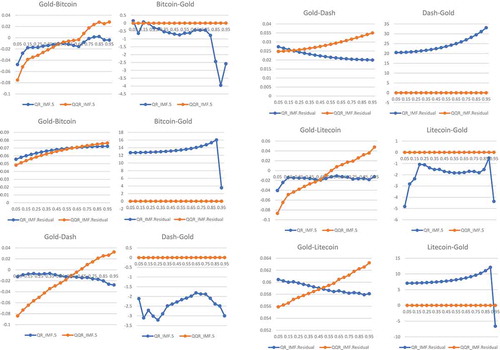
Figure 2. (Continued).
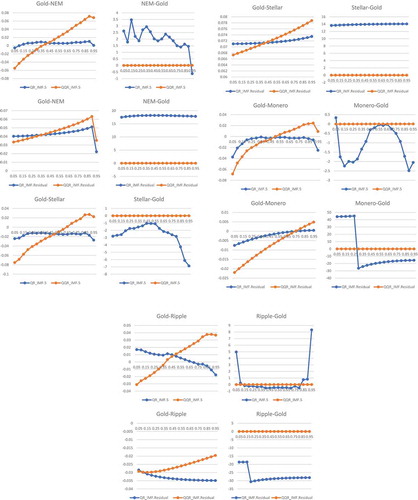
Having established hedging potential between gold and cryptos (uncorrelated) in the short-term and at composite level, we now analyse the direction of the nexus to provide insight into diversification possibilities. In this regards, we consider a negative coefficient or inverse relationship as one that provides diversification potential but positive coefficient does not. However, Baur and Lucey (Citation2010, p. 219) distinguish between hedge and diversifier as follows: “A hedge … uncorrelated or negatively correlated … ” and “A diversifier … positively (but not perfectly correlated) … ” These two do not possess the specific property risk reduction market turmoils and so cannot be safe haven. Therefore, we follow the definitions of Baur and Lucey (Citation2010) to identify specific quantiles where gold and cryptos can hedge or diversify for each other.
In the from context, we observe hedging possibilities mostly in the medium-term except for NEM which shows only diversifier prospects in both medium-and long-terms. In the long-term gold and cryptos mostly have positive relationships and thus may diversify each other. But Monero can hedge in the long-term up to the 75th quantile. The specific quantiles where inverse relationships are observed (hedging) are as follows: Bitcoin (lower half of distribution), Dash and Stellar (across all quantiles but small in magnitude as compared to the others), Monero (up to 15th quantile and after the 85th), and Ripple (only after the 65th quantile). It follows that the other quantiles offer diversifications instead.
The to link is comparable with from nexus in the sense that gold and cryptos are hedgers of each other mostly in the medium-term but diversifies in the long-term. There are, however, a few exceptions. For instance, Ripple cannot hedge at the tails of the distribution in the medium-term but it can diversify in the long-term. Monero can also hedge in the long-term in the upper third of the distribution. Lastly, NEM can also hedge only at the extreme tails of the distribution, but can otherwise diversify.
Our findings corroborate other studies that find cryptos to act as a hedge under different circumstances. For instance, Bouri et al. (Citation2017) support the view under global uncertainty at higher quantiles and in the short-term. Bouri et al. (Citation2017) also reveal hedge and diversifier properties for Bitcoin against commodities in a time-varying manner. For gold, in particular, Zwick and Syed (Citation2019) find both hedge and diversifier features of Bitcoin.
Further, our findings reveal that gold and cryptos, on the hand can hedge or be safe haven under market uncertainties. For instance, Selmi et al. (Citation2018) find Bitcoin and gold, rather than oil, as safe-haven under global uncertainty. Once more, Al-Yahyaee et al. (Citation2019) document the diversification benefits of Bitcoin and gold for oil and Standard & Poor Goldman Sachs Commodity Index (S&P GSCI). Furthermore, given that our variables are denominated in US dollars, we can relate our findings to Kliber et al. (Citation2019) who find Bitcoin as a weak hedge in all US dollar-denominated investment markets.
We further observe from Figure that, the to (i.e. crypto-gold) links are stronger than from (i.e. gold- crypto) links. In other words, when cryptos are the dependent variables they hedge or diversify better than when gold is the dependent variable, both in the medium- and long-terms. This implies that the conditional quantiles of gold provide stronger hedging and diversification potentials on cryptos than the conditional quantiles of cryptos have on gold. We suggest that bearish and bullish gold prices are better indicators for hedging and diversification strategies than rising and plummetting prices of cryptocurrencies.
We have established the importance of asymmetric dependence connection between gold and cryptos for investment strategies. Our finding, however, contravenes that of Charles and Darné (Citation2019) who find GARCH-type models to be inappropriate for modelling dynamic asymmetric Bitcoin returns. In terms of the hedging ability of cryptos, Kurka (Citation2019) holds a different opinion, that market disruptions may be transmitted from Bitcoin to the traditional economy.
4.2. QQR results
The QQR is a non-parametric technique which provides us with no significance of the regression coefficients. However, it is possible to infer the validity of the QQR from the QR. Bouri et al. (Citation2017) suggest the QQR approach “decomposes” the QR estimates into the specific quantiles of the explanatory variables. In Figure we observe that while the QQR and QR estimates are not the same, they show similar patterns for the most part. For the gold-crypto link, we find much more resemblance, but QQR estimates are subsumed under the QR estimates in the crypto-gold link. From these, we can reinforce the validity of the QQR technique in the context of this study. That means the analysis pertaining to QR in terms of hedging and diversification apply to the QQR estimates as well, only differing in magnitudes.
Specifically, we observe that in the long-term QQR estimates are essentially zeros as compared to QR estimates. Further, in the lower half of the distribution, QR lies above QQR but in the upper half, the reverse is true. This holds for the gold-crypto links, except for Ripple. The QR and QQR plots diverge after the 15th quantile with QQR rising and QR falling, in the long-term.
5. Conclusions and recommendations
In this study, we examined the asymmetric frequency-varying connection between gold and major cryptocurrencies to identify hedging and diversification possibilities between the two asset classes. With daily return series, we decomposed the series into short-, medium- and, long-term frequencies using EEMD and employed the QR and QQR techniques. The EEMD does not only delineate the series into time horizons, but also reduces the noise that may be present in the series. The QR and QQR also capture the asymmetries in the relationship at different portions of the return distributing over the time scales (see also Troster et al., Citation2018). Our sampled period spanned 30/04/2013 to 18/04/2019.
We found both QR and QQR as valid models to examine the relationship between gold and cryptos at different time-frequency scales. In one sense, our study is unique among many that use noise reduction in the context of frequency-dependent asymmetric analysis. Thus, we improve upon several studies whose important patterns may be shrouded noise in the data or proffer inaccurate results. Among other things, we confirm the HMH in the context of dynamic asymmetric, hedge, diversifier as opposed to the efficient market hypothesis (EMH). This partially corroborates Nadarajah and Chu (Citation2017) who find only a weak form of efficiency in Bitcoin after an odd integer power transformation of the returns. Without this transformation, Bitcoin was starkly inefficient.
Following Baur and Lucey’s (Citation2010) definitions of hedge and diversification, we find that both gold and cryptos can hedge and diversify for each other within the medium- and long-terms. However, we do not find any significant link between gold and Ethereum at all time scales and in the unconditional and conditional distributions of the returns. Our findings corroborate the notion of cryptos and gold possessing hedge and diversifier properties under different scenarios (see Bouri, Gupta et al., Citation2017; Bouri, Jalkh et al., Citation2017; Kliber et al., Citation2019; Zwick & Syed, Citation2019; etc.). Notwithstanding, Klein et al. (Citation2018) and Kurka (Citation2019) discount these properties for Bitcoin, among others.
Further, we support Liu’s (Citation2019) assertion that portfolio diversification across different cryptos can improve investment outcomes. Our results indicate that cryptos and gold (together), on the one hand, can hedge and diversify for other traditional assets, on the other hand. This assertion is corroborated by Selmi et al. (Citation2018) and Al-Yahyaee et al. (Citation2019), among others. In the nutshell, we find that there are possibilities of increased reward or risk-reduction in portfolios constructed with gold different cryptos. It should, however, be noted that these phenomena are asymmetric and occur at different time horizons. Hence, investment decisions should be wary of these dynamics.
Cover Image
Source: Author.
Acknowledgements
The authors would like to thank Aviral Kumar Tiwari (PhD) for providing QR and QQR codes in R used in this paper. We acknowledge the same used in Owusu Junior, P., Tiwari, A. K., Padhan, H., & Alagidede, I. (2020). Analysis of EEMD-based quantile-in-quantile approach on spot- futures prices of energy and precious metals in India. Resources Policy, 68, 101731. https://doi.org/10.1016/j.resourpol.2020.101731 and Owusu Junior, P., & Tweneboah, G. (2020). Are there asymmetric linkages between African stocks and exchange rates? Research in International Business and Finance, 101245. https://doi.org/10.1016/j.ribaf.2020.101245
Additional information
Funding
Notes on contributors
Peterson Owusu Junior
Peterson Owusu Junior is completing his PhD at Wits Business School (Wits University). His interests are in financial econometrics with respect to emerging markets risk analysis.
Anokye M. Adam
Anokye M. Adam (PhD) is Associate Professor in Finance and Head of Finance Department at the School of Business, University of Cape Coast, Ghana. His research interests are in financial markets, risk analysis, and behavioural finance.
George Tweneboah
George Tweneboah (PhD) is a Senior Lecturer at the Wits Business School (Wits University). His research has focused on time series modelling, exchange rate management, economic integration, financial market, development, fiscal sustainability.
Notes
1. See De Cheveigné (Citation2005) for further details.
2. Any IMF consisting of oscillations of dramatically disparate scales caused by intermittency of the driving mechanism (Wu & Huang, Citation2009).
4. All regression tables are available upon request to the corresponding author.
5. That is 1%, 5%, and 10% significance levels.
References
- Al-Yahyaee, K. H., Mensi, W., Al-Jarrah, I. M. W., Hamdi, A., & Kang, S. H. (2019). Volatility forecasting, downside risk, and diversification benefits of Bitcoin and oil and international commodity markets: A comparative analysis with yellow metal. The North American Journal of Economics and Finance, 49, 104–19. https://doi.org/10.1016/j.najef.2019.04.001
- Baruník, J., & Křehlík, T. (2018). Measuring the frequency dynamics of financial connectedness and systemic risk. Journal of Financial Econometrics, 16(2), 271–296. https://doi.org/10.1093/jjfinec/nby001
- Baur, D. G., & Lucey, B. M. (2010). Is gold a hedge or a safe haven? An analysis of stocks, bonds and gold. Financial Review, 45(2), 217–229. https://doi.org/10.1111/j.1540-6288.2010.00244.x
- Baur, D. G., & McDermott, T. K. (2010). Is gold a safe haven? International evidence. Journal of Banking & Finance, 34(8), 1886–1898. https://doi.org/10.1016/j.jbankfin.2009.12.008
- Baur, D. G., & McDermott, T. K. J. (2016). Why is gold a safe haven? Journal of Behavioral and Experimental Finance, 10(C), 63–71. https://doi.org/10.1016/j.jbef.2016.03.002
- Bouoiyour, J., Selmi, R., Tiwari, A. K., & Olayeni, O. R. (2016). What drives Bitcoin price. Economics Bulletin, 36(2), 843–850. http://www.accessecon.com/Pubs/EB/2016/Volume36/EB-16-V36-I2-P82.pdf
- Bouri, E., Gabauer, D., Gupta, R., & Tiwari, A. (2020). Volatility connectedness of major cryptocurrencies: The role of investor happiness (Working Paper Series (No. 202059)). University of Pretoria.
- Bouri, E., Gupta, R., Tiwari, A. K., & Roubaud, D. (2017). Does Bitcoin hedge global uncertainty? Evidence from wavelet-based quantile-in-quantile regressions. Finance Research Letters, 23(50), 87–95. https://doi.org/10.1016/j.frl.2017.02.009
- Bouri, E., Jalkh, N., Molnár, P., & Roubaud, D. (2017). Bitcoin for energy commodities before and after the December 2013 crash: Diversifier, hedge or safe haven? Applied Economics, 49(50), 5063–5073. https://doi.org/10.1080/00036846.2017.1299102
- Breslaw, J. A. (1992). Kernel estimation with cross-validation using the fast Fourier transform. Economics Letters, 38(3), 285–289. https://doi.org/10.1016/0165-1765(92)90072-7
- Charles, A., & Darné, O. (2019). Volatility estimation for Bitcoin: Replication and robustness. International Economics, 157, 23–32. https://doi.org/10.1016/j.inteco.2018.06.004
- Chaum, D. (1983). Blind signatures for untraceable payments. In D. Chaum, R. L. Rivest, & A. T. Sherman (Eds.), Advances in cryptology (pp. 199–203). Springer. https://doi.org/10.1007/978-1-4757-0602-4_18
- Das, D., & Kannadhasan, M. (2018). Do global factors impact bitcoin prices? Evidence from wavelet approach. Journal of Economic Research, 23, 227–264. https://www.researchgate.net/profile/Manoharan_Kannadhasan/publication/329308550_Do_global_factors_impact_bitcoin_prices_evidence_from_wavelet_approach/links/5c00e0c1299bf1a3c1562dad/Do-global-factors-impact-bitcoin-prices-evidence-from-wavelet-approach.pdf
- De Cheveigné, A. (2005). The cancellation principle in acoustic scene analysis. In P. Divenyi (Ed.), Speech Separation by humans and machines (pp. 245–259). Springer. https://doi.org/10.1007/0-387-22794-6_16
- Di Matteo, T., Aste, T., & Dacorogna, M. M. (2003). Scaling behaviors in differently developed markets. Physica A: Statistical Mechanics and Its Applications, 324(1), 183–188. https://doi.org/10.1016/S0378-4371(02)01996-9
- Dyhrberg, A. H. (2016). Bitcoin, gold and the dollar – A GARCH volatility analysis. Finance Research Letters, 16, 85–92. https://doi.org/10.1016/j.frl.2015.10.008
- Flandrin, P., Rilling, G., & Goncalves, P. (2004). Empirical mode decomposition as a filter bank. IEEE Signal Processing Letters, 11(2), 112–114. https://doi.org/10.1109/LSP.2003.821662
- Gledhill, R. J. (2003). Methods for investigating conformational change in biomolecular simulations [A dissertation for the degree of Doctor of Philosophy at the Department of Chemistry]. University of Southampton.
- Hu, G. B., Liu, Y., & Deng, Z. M. (2009). Arrival time estimation of signals based on Haar wavelets transform. System Engineering and Electronics, 31(7), 1615–1619. http://en.cnki.com.cn/Article_en/CJFDTotal-XTYD200907022.htm
- Huang, N. E., Shen, Z., & Long, S. R. (1999). A new view of nonlinear water waves: The Hilbert spectrum. Annual Review of Fluid Mechanics, 31(1), 417–457. https://doi.org/10.1146/annurev.fluid.31.1.417
- Huang Norden, E., Shen, Z., Long Steven, R., Wu Manli, C., Shih Hsing, H., Zheng, Q., Tung, C. C., Liu, H. H., & Yen, N.-C. (1998). The empirical mode decomposition and the Hilbert spectrum for nonlinear and non-stationary time series analysis. Proceedings of the Royal Society of London. Series A: Mathematical, Physical and Engineering Sciences, 454(1971), 903–995. https://doi.org/10.1098/rspa.1998.0193
- Huang, R. D., Masulis, R. W., & Stoll, H. R. (1996). Energy shocks and financial markets. Journal of Futures Markets: Futures, Options, and Other Derivative Products, 16(1), 1–27. https://doi.org/10.1002/(SICI)1096-9934(199602)16:1<1::AID-FUT1>3.0.CO;2-Q
- Huang, Z. (1998). Extensions to the k-means algorithm for clustering large data sets with categorical values. Data Mining and Knowledge Discovery, 2(3), 283–304. https://doi.org/10.1023/A:1009769707641
- Ivanov, S. I. (2013). The influence of ETFs on the price discovery of gold, silver and oil. Journal of Economics and Finance, 37(3), 453–462. https://doi.org/10.1007/s12197-011-9205-8
- Klein, T., Pham Thu, H., & Walther, T. (2018). Bitcoin is not the new gold – A comparison of volatility, correlation, and portfolio performance. International Review of Financial Analysis, 59, 105–116. https://doi.org/10.1016/j.irfa.2018.07.010
- Kliber, A., Marszałek, P., Musiałkowska, I., & Świerczyńska, K. (2019). Bitcoin: Safe haven, hedge or diversifier? Perception of bitcoin in the context of a country’s economic situation — A stochastic volatility approach. Physica A: Statistical Mechanics and Its Applications, 524, 246–257. https://doi.org/10.1016/j.physa.2019.04.145
- Kristoufek, L. (2015). What are the main drivers of the Bitcoin price? Evidence from wavelet coherence analysis. PloS One, 10(4), e0123923. https://doi.org/10.1371/journal.pone.0123923
- Kurka, J. (2019). Do cryptocurrencies and traditional asset classes influence each other? Finance Research Letters, 31, 38–46. https://doi.org/10.1016/j.frl.2019.04.018
- Lansky, J. (2018). Possible state approaches to cryptocurrencies. Journal of Systems Integration, 9(1), 19–31. https://doi.org/10.20470/jsi.v9i1.335
- Li, C., Li, Z., Wu, J., Zhu, L., & Yue, J. (2018). A hybrid model for dissolved oxygen prediction in aquaculture based on multi-scale features. Information Processing in Agriculture, 5(1), 11–20. https://doi.org/10.1016/j.inpa.2017.11.002
- Liao, R., Guo, C., Wang, K., Zuo, Z., & Zhuang, A. (2015). Adaptive optimal kernel time–Frequency representation technique for partial discharge ultra-high-frequency signals classification. Electric Power Components and Systems, 43(4), 449–460. https://doi.org/10.1080/15325008.2014.986775
- Liu, W. (2019). Portfolio diversification across cryptocurrencies. Finance Research Letters, 29, 200–205. https://doi.org/10.1016/j.frl.2018.07.010
- Mensi, W., Al-Yahyaee, K. H., & Kang, S. H. (2018). Structural breaks and double long memory of cryptocurrency prices: A comparative analysis from Bitcoin and Ethereum. Finance Research Letters, 29, 222–230. https://doi.org/10.1016/j.frl.2018.07.011
- Müller, U. A., Dacorogna, M. M., Davé, R. D., Pictet, O. V., Olsen, R. B., & Ward, J. R. (1993). Fractals and intrinsic time: A challenge to econometricians [Unpublished Manuscript]. Olsen & Associates, Zürich.
- Nadarajah, S., & Chu, J. (2017). On the inefficiency of Bitcoin. Economics Letters, 150, 6–9. https://doi.org/10.1016/j.econlet.2016.10.033
- Nakamoto, S. (2008). Bitcoin: A peer-to-peer electronic cash system. http://bitcoin.org/bitcoin.pdf.
- Nava, N., Di Matteo, T., & Aste, T. (2018a). Dynamic correlations at different time-scales with empirical mode decomposition. Physica A: Statistical Mechanics and Its Applications, 502, 534–544. https://doi.org/10.1016/j.physa.2018.02.108
- Nava, N., Di Matteo, T., & Aste, T. (2018b). Financial time series forecasting using empirical mode decomposition and support vector regression. Risks, 6(1), 7. https://doi.org/10.3390/risks6010007
- Owusu Junior, P., Tiwari, A. K., Padhan, H., & Alagidede, I. (2020). Analysis of EEMD-based quantile-in-quantile approach on spot- futures prices of energy and precious metals in India. Resources Policy, 68, 101731. https://doi.org/10.1016/j.resourpol.2020.101731
- Owusu Junior, P., & Tweneboah, G. (2020). Are there asymmetric linkages between African stocks and exchange rates? Research in International Business and Finance, 54, 101245. https://doi.org/10.1016/j.ribaf.2020.101245
- Selmi, R., Mensi, W., Hammoudeh, S., & Bouoiyour, J. (2018). Is Bitcoin a hedge, a safe haven or a diversifier for oil price movements? A comparison with gold. Energy Economics, 74, 787–801. https://doi.org/10.1016/j.eneco.2018.07.007
- Sim, N., & Zhou, H. (2015). Oil prices, US stock return, and the dependence between their quantiles. Journal of Banking & Finance, 55, 1–8. doi:doi.10.1016/j.jbankfin.2015.01.013
- Troster, V., Tiwari, A. K., Shahbaz, M., & Macedo, D. N. (2018). Bitcoin returns and risk: A general GARCH and GAS analysis. Finance Research Letters, 30, 187–193. https://doi.org/10.1016/j.frl.2018.09.014.
- Tweneboah, G., Owusu Junior, P., & Kumah, S. P. (2020). Modelling the asymmetric linkages between spot gold prices and African stocks. Research in International Business and Finance, 54, 101246. https://doi.org/10.1016/j.ribaf.2020.101246
- Wang, X., Gao, J., Chen, W., Xu, J., Zhao, W., & Jiang, X. (2011). Adaptive optimal-kernel time-frequency representation and its application in characterizing seismic attenuation. SEG technical program expanded abstracts 2011 (Vol. 1–0, pp. 1046–1051). https://doi.org/10.1190/1.3627384
- Weber, W. E. (2016). A Bitcoin standard: Lessons from the gold standard (Working Paper No. 2016–14). Bank of Canada Staff Working Paper website. https://www.econstor.eu/handle/10419/148121
- Wu, Z., & Huang, N. E. (2009). Ensemble empirical mode decomposition: A noise-assisted data analysis method. Advances in Adaptive Data Analysis, 1(1), 1–41. https://doi.org/10.1142/S1793536909000047
- Xiao, X., He, J., Huang, H., Miller, T. R., Christakos, G., Reichwaldt, E. S., Ghadouani, A., Lin, S., Xu, X., & Shi, J. (2017). A novel single-parameter approach for forecasting algal blooms. Water Research, 108, 222–231. https://doi.org/10.1016/j.watres.2016.10.076
- Xu, M., Shang, P., & Lin, A. (2016). Cross-correlation analysis of stock markets using EMD and EEMD. Physica A: Statistical Mechanics and Its Applications, 442, 82–90. https://doi.org/10.1016/j.physa.2015.08.063
- Yunhong, W., Guosui, L., Xi, L., & Yiding, W. (1998). A pattern recognition method based on short-time Fourier transform and sigular values feature extraction [J]. Signal Processing, 2. http://en.cnki.com.cn/Article_en/CJFDTotal-XXCN199802004.htm
- Zhang, N., Lin, A., & Shang, P. (2017). Multidimensional k-nearest neighbor model based on EEMD for financial time series forecasting. Physica A: Statistical Mechanics and Its Applications, 477, 161–173. https://doi.org/10.1016/j.physa.2017.02.072
- Zhang, Y., Chan, S., Chu, J., & Nadarajah, S. (2019). Stylised facts for high frequency cryptocurrency data. Physica A: Statistical Mechanics and Its Applications, 513, 598–612. https://doi.org/10.1016/j.physa.2018.09.042
- Zwick, H. S., & Syed, S. A. S. (2019). Bitcoin and gold prices: A fledging long-term relationship. Theoretical Economics Letters, 9(7), 2516–2525. https://doi.org/10.4236/tel.2019.97159
Appendix A.