
 ?Mathematical formulae have been encoded as MathML and are displayed in this HTML version using MathJax in order to improve their display. Uncheck the box to turn MathJax off. This feature requires Javascript. Click on a formula to zoom.
Abstract
In recent decades, the ASEAN economies have implemented a number of regional integration policies. Using a panel dataset of 10 ASEAN countries from 1980 to 2017, this study examines the productivity and efficiency of the ASEAN economies using a stochastic production frontier model. Furthermore, the parametric model is decomposed using a generalised Malmquist productivity index to provide estimates of gross technical efficiency, technical progress and returns to scale change, while taking into account of transient and persistent efficiency. The results show that there is room for efficiency gains, as the ASEAN economies can increase GDP by 7.7 per cent if persistent efficiency is increased. Furthermore, the results show that technical progress is increasing over time and exhibits increasing returns to scale. However, technical change is slow, as it averages at one per cent over the sample period. Policy implications for future growth are discussed.
PUBLIC INTEREST STATEMENT
This study examines the productivity of the ASEAN economies using a stochastic production frontier model from 1980 to 2017 in the presence of transient and persistent efficiency. Examining the productivity of the ASEAN economies allows policymakers to evaluate the effects of previous policy implementations and provides policymakers with essential information for future policies. The estimated findings show that capital and labour are positive and significant to total factor productivity (TFP) growth. However, the effects of labour are more effective as it increases over time. Furthermore, the average technical efficiency of the ASEAN economies is at 92.3%, which suggests GDP can be increased by a further 7.7% if persistent efficiency is increased. Finally, the technological progress of the ASEAN economies shows mixed results with an average of 1.0% technical change over the time period, however, improving over time. Policy implications are discussed.
1. Introduction
The Association of South-East Asian Nations (ASEAN) marked its 50th anniversary in 2017, achieving 50 years of growth, prosperity and peace. The region continues to develop into a major player in the global economy, as the organisation currently has a combined gross domestic product (GDP) that ranks fifth in the world (World Bank). Despite its accomplishments in economic development, the ASEAN economies are still lacking behind in terms of economic integration (Petri et al., Citation2012). In recent years, the region has implemented several regional integration policies such as the ASEAN Economic Community (AEC) Blueprint, an initiative to create a single market that encompasses the free movement of goods, services, investment, capital and skilled labour across the region. However, the ASEAN member states are diverse in its development, as the region includes large economies such as Indonesia and Thailand, alongside smaller developing nations such as Lao PDR and Cambodia. This diversity makes economic integration difficult and more importantly, economic integration may lead to uneven development, as advanced economies within the region may benefit more from regional integration (Ravenhill, Citation2008). Meanwhile, growth economics and understanding the wealth of nations has always been an important research agenda. In particular, understanding the productivity of nations is critical, as productivity is suggested to be a driver of long-term growth and can affect regional integration efforts, leading to sustainable future development (Ortega-Argilés, Citation2012). This is essential as it allows for the formulation of policies that will be beneficial for long-run growth, as short-term policies are likely to backfire as it only benefits the short-run.
Focusing back on the ASEAN economies, prior to the turn of the 21st century, research has shown that the ASEAN economies developed through capital-intensive growth (Walmsley et al., Citation2017). This strategy is not sustainable in the long-run as capital will reach its steady-state. Furthermore, other researches have suggested that the ASEAN economies are heavily dependent on external trade for economic growth (Masron, Citation2017). While trade theories suggest that openness to trade can potentially lead to further growth through the transfer of capital and foreign technologies, capital and disembodied technological progress will eventually converge to its steady-state. More importantly, there is a lack of research examining the productivity of the ASEAN economies in recent years. This is crucial to conduct as there has been a number of key economic initiatives that have been implemented, such as the AEC and the ASEAN Free Trade Agreement (AFTA), that can potentially have a profound impact on productivity growth (ASEAN Secretariat, Citation2018). At the same time, there are recent advances in the field of productivity and efficiency, such as the parametric application of the Malmquist index for productivity measures and the estimation of transient and persistent efficiency (Badunenko & Kumbhakar, Citation2016; Filippini & Greene, Citation2016).
Taking all these factors into account, this study examines the productivity of the ASEAN economies in the presence of transient and persistent efficiency, using a panel dataset of 10 ASEAN countries from 1980 to 2017. More specifically, this study examines whether past regional integration policies have increased the productivity and efficiency of the region. This study employs a stochastic production frontier model with a four-component error structure estimated using random-effects and maximum likelihood. Random-effects and maximum likelihood are employed as it accounts for unobserved heterogeneity and thus, allows for the estimation of transient and persistent efficiency (Badunenko & Kumbhakar, Citation2016). This can provide estimates of the main contributor of growth in the region in the context of a production function. In addition, the study examines the specific contribution of capital and labour over time and reassess whether the effects of capital are diminishing over-time, as previous studies have suggested that the growth of the ASEAN economies was capital-intensive. Finally, using a parametric decomposition of the Malmquist index (Orea, Citation2002), the stochastic frontier is decomposed to provide estimates of gross technical efficiency, technological progress through total factor productivity (TFP) and returns to scale change, which will have policy implications for the region and the individual member states.
This study provides new empirical evidence on the productivity and efficiency of the ASEAN economies. The ASEAN economies have been overlooked in the literature in recent years. As the ASEAN economies begin to further integrate with policy initiatives such as the AEC, it is pertinent that policymakers understand the previous growth path of the region and the individual member states in order to evaluate the future direction of the region. Furthermore, the novelty of the study also lies in its econometric approach, employing a stochastic production frontier model with a four-component error structure that allows for the estimates of transient and persistent efficiency (Badunenko & Kumbhakar, Citation2016; Filippini & Greene, Citation2016). To the best of the authors’ knowledge, this is the first study to employ the method in the context of the ASEAN economies. The estimation of transient and persistent efficiency can provide policymakers with further information on the performance of the individual member states and the ASEAN region, allowing for deeper policy implications.
The estimated findings show that while both capital and labour are positive and significant to GDP growth, the effects of labour are more effective as it increases over time. Furthermore, the gross technical efficiency of the ASEAN economies on average is at 92.3 per cent, which suggests GDP can be increased by a further 7.7 per cent if persistent efficiency is increased, which can be addressed through long-term structural changes such as policy implementations. Equally important, the technological progress of the ASEAN economies shows mixed results as the ASEAN economies have achieved an average of 1.0 per cent technical change over the time period. Finally, the returns to scale change for the ASEAN economies are positive and averages at 8.8 per cent, which suggests an increasing returns to scale change and contributes positively to TFP growth. The results echo similar findings to earlier research on the ASEAN economies, particularly on the subpar performance of the ASEAN economies with regards to TFP growth and the weakening effects of capital on growth. Policy implications are discussed further.
The following sections will be organised as follows. Section 2 provides readers with a brief review of the development of the ASEAN economies and productivity growth in the region. The econometric model, variables, and data sources are discussed in Section 3. The estimated results are presented and discussed in Section 4. The study concludes in Section 5.
2. The evolution of the ASEAN economies
The ASEAN economies are a regional intergovernmental organisation of 10 countries that includes Brunei Darussalam, Cambodia, Indonesia, Lao PDR, Malaysia, Myanmar, Philippines, Singapore, Thailand, and Viet Nam. The organisation promotes intergovernmental cooperation as well as economic, socio-cultural and security cooperation among the member states and other countries in the Asia-Pacific region. Initially founded in 1967 by Indonesia, Malaysia, Philippines, Singapore and Thailand, the region continues to commit towards deeper regional integration with their motto of “One Vision, One Identity, One Community” (ASEAN Secretariat, Citation2018). This was in stark contrast as prior to 1967, the region was marred by poverty, ethnic divide and feudal conflicts that dominated the first half of the 20th century (Booth, Citation1999).
In previous years, economic growth is currently trending upwards, and poverty is consistently declining, thus making the region economically strong (ASEAN Secretariat, Citation2018). In fact, the ASEAN economies are currently the 5th largest economy in the world in terms of GDP, after the US, China, Japan, and Germany (CitationWorld Bank, Various Years). Furthermore, in terms of population, the ASEAN economies have a combined total population of over 600 million, with half of the population at the age range of 15 to 65 (CitationWorld Bank, Various Years). Despite its strong economic standing as an organisation, the ASEAN member states are very diverse economies in terms of their economic development, political viewpoints, and their socio-cultural systems.
Figure 1. ASEAN growth rates (GDP per capita).
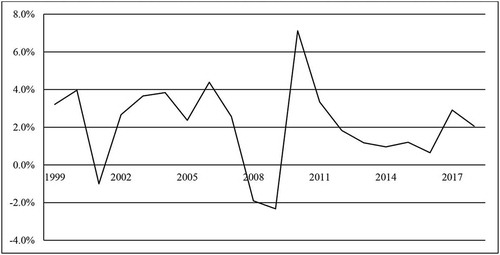
Finally, in terms of overall economic growth, the GDP per capita growth rate of the ASEAN economies have fluctuated over the last two decades. Figure presents the growth rates of the region in the last two decades. In closer examination of Figure , it can be observed that the region suffered from a fluctuating growth rate after the onset of the Asian financial crisis in 1997, which began in Thailand. At the height of the crisis, the region contracted with an average growth rate of negative—1.0 per cent. On the other hand, during the earlier years of the 21st century, the region has recovered well and achieved a relatively moderate economic growth rate (Lee & Tan, Citation2006). However, this growth was halted during the 2007 global financial crisis, which affected many economies worldwide. The ASEAN economies contracted with an average negative growth rate of—1.9 per cent in 2008 and—2.3 per cent in 2009 before a sharp recovery in 2010, where the region enjoyed a growth rate of 7.1 per cent. The subsequent Eurozone crisis in 2012 did not adversely affect the ASEAN economies, compared to the previous financial crises. However, growth was slow during the period, as it fluctuated between 1.0 per cent to 1.2 per cent during the years after the Eurozone crisis. Overall, in the last two decades, the region has achieved a moderate growth rate of 2.1 per cent during the period.
Although the ASEAN economies have experienced a relatively moderate growth path, there are a number of challenges that the region faces (ASEAN Secretariat, Citation2018). In addition to a slowdown in economic growth, the region also faces the issue of weak workforce productivity, an overdependence on external trade and a lack of investments in infrastructure leading to voids in infrastructure development in communication, energy and transport (Lesher & Plummer, Citation2011). Furthermore, these issues are intensified by other neighbouring economies such as China and India. Therefore, the ASEAN economies, as an integrated region and individually, must be ready to commit and develop future initiatives to address these issues.
In light of these issues, the organisation established the AEC Blueprint in 2007, a policy initiative with the goal of economic integration (ASEAN Secretariat, Citation2018). In addition to the implementation of the AEC in 2007, the organisation has reintroduced the AEC Blueprint 2025 alongside other initiatives to promote further regional integration, such as the ASEAN Community Vision, the ASEAN Political-Security Community Blueprint and the ASEAN Socio-Cultural Community Blueprint. The AEC aims to create a competitive economic region that serves as a single market and production base that is fully integrated with the global economy, while promoting the equitable economic development of the region (ASEAN Secretariat, Citation2018). Thus, the realisation of the AEC will strengthen ASEAN as an organisation and will encourage growth and development within the region. This is particularly important as the region faces the challenge of rapid economic growth from China, India and other emerging nations and as such, the AEC aims to provide a foundation for future growth (Ravenhill, Citation2008).
While the AEC provides a platform for future development for the region, understanding the growth path of the ASEAN economies is crucial to consider as it can provide policy implications for future growth and allows one to assess the effectiveness of past regional integration policies. Growth economics and understanding the wealth of nations are an important research agenda in the field of economics. This issue becomes increasingly important, especially when the ASEAN member states are a diverse set of economies. The most prominent growth model, the Solow (Citation1956) model, emphasises the role of savings and population growth, as well as technological progress as the driving force of economic growth. However, the growth of these input factors cannot fully explain the growth of output, and thus, there must be other driving forces that explain growth (Nordhaus, Citation1969).
As a result, understanding the productivity growth of an economy is essential as it is considered to be a major determinant of future standard of living, and a permanent decline in productivity is of serious concern (Munnell, Citation1990). A higher level of productivity can lead to lower costs that can be passed onto consumers, improved competitiveness and trade performance leading to higher profits and wages. Hence, the ASEAN economies as a region and its individual member states must investigate its productivity growth for future policy implications. At the same time, productivity growth can be misleading. For instance, productivity growth can be increased by employing more capital which results in an increase in labour productivity growth. This is not sustainable as economies will converge to its steady state and as a consequence, productivity growth is suggested to be pro-cyclical in the short-term, as during times of recessions productivity will be lower (Holtz-Eakin, Citation1992; Saint-Paul, Citation1993). This generally arises when examining short-term productivity growth or the technical efficiency of an economy. Technical efficiency is the effectiveness of producing maximum output from minimum inputs and is short-term in nature as it accounts for the relative production frontier for a specific time period. As a result, examining productivity growth through efficiency only is likely to provide inferences for the short-term, which can back-fire as it only benefits the short-run (Baumol, Citation1986).
More recently, developments in the field of productivity and efficiency have allowed researchers to differentiate efficiency into two factors: persistent efficiency (long-term) and transient efficiency (short-term) (Colombi et al., Citation2014; Badunenko & Kumbhakar, Citation2016; Filippini & Greene, Citation2016; Tsionas & Kumbhakar, Citation2014. In general, persistent efficiency can be increased by structural changes through reforms and policy changes while transient efficiency is non-systematic developments that can be solved in the short-run and are more cyclical in nature (Badunenko & Kumbhakar, Citation2016). This distinction is crucial as it provides policy-makers with more information to make informed decisions. In summary, examining the productivity of economies in relation to capital, labour and technological progress while taking into account of persistent and transient efficiency provides a deeper understanding of productivity growth. This is essential as the ASEAN economies in the last two decades have implemented various policies for regional integration and can potentially have profound impact on productivity.
With this in mind, the ASEAN economies were closely researched prior to the turn of the 21st century. Earlier studies have suggested that the growth of the ASEAN and many Asian economies was capital intensive and therefore not sustainable in the long-term (Krugman, Citation1994; Young, Citation1995). On the other hand, other studies have suggested that the ASEAN economies have technologically progressed, providing evidence of high total factor productivity growth for some of the ASEAN member states (Sarel, Citation1997). However, other researchers suggested that the growth in productivity was driven by trade openness and foreign direct investment (Lee & Tan, Citation2006). Similarly, some studies have highlighted that the ASEAN economies were dependent on export-led strategies, benefiting from disembodied technologies that will eventually converge (Hill, Citation1997). Disembodied technological progress increases output with improved technology without any changes in input and investment in capital, while embodied technological progress increases output with investment in improved technology (Kaldor, Citation1957). As such, disembodied technological progress will eventually converge.
Prior to the 1980s, the majority of the ASEAN member states adopted an import-substituting industrialisation strategy that leads to a decline in trade as the region remained restrictive in trade and investment policies (Yam, Citation1995). This is particularly interesting as the region has implemented the ASEAN Free Trade Agreement in 1992, reducing trade barriers and tariffs. However, disembodied technological progress from foreign technologies and foreign direct investment are not sustainable for future growth (Wan Lee & Brahmasrene, Citation2014). The AEC will reduce the regions reliance on outward-oriented trade and focus on creating a single market that can potentially increase real incomes by 5.3 per cent (Petri et al., Citation2012). Accordingly, there has been a lack of consensus on the productivity growth of the ASEAN economies and there is a lack of studies examining the productivity of the ASEAN economies in recent years, particularly after the initial implementation of the AEC.
More recently, research on the ASEAN economies has found that despite the efforts in economic integration, the ASEAN economies are behind in terms of institutional development and have a deficit on the rule of law (Lane, Citation2011). This is important as it is suggested that development in institutional settings can promote economic growth in the ASEAN economies (H. Haini, Citation2019b). Furthermore, other empirical researches suggest that despite rapid growth, there are gaps in labour mobility policies which can potentially affect productivity growth (Menon, Citation2013). This is crucial at a time when the ASEAN economies are experiencing a demographic change and encouraging regional integration will reduce the issue of labour shortages and stimulate further productivity growth in the region (Walmsley et al., Citation2017). Thus, understanding the productivity and efficiency of the ASEAN economies can provide policymakers with policy implications for the future growth of the region as the AEC continues to be implemented.
3. Empirical methodology
This section discusses the econometric model employed followed by a discussion on the data and variables used.
3.1. Stochastic production frontier model
The stochastic frontier model, written in EquationEquation (1)(1)
(1) , was developed by Aigner et al. (Citation1977), building upon pioneering work from Farrell (Citation1957).
The model consists of the outcome variable , while
is a row vector of input variables (capital and labour) and other control or environmental variables that may be included. The model developed introduces an error specification that consists of two components: idiosyncratic error
and the time-varying technical efficiency
.
Further developments in the field introduced the addition of persistent efficiency (Pitt & Lee, Citation1981), in addition to time-varying technical efficiency
, and the idiosyncratic error
. Finally, the most recent development in stochastic frontier modelling was suggested by Colombi et al. (Citation2014), Badunenko and Kumbhakar (Citation2016), Filippini and Greene (Citation2016), and Tsionas and Kumbhakar (Citation2014). This model separates the error term
into four components shown in EquationEquation (3)
(3)
(3) , and can be grouped into a time-invariant error component
and a time-varying error component
. In this case,
captures random noise and can be interpreted as country-specific effects (Greene, Citation2005). Meanwhile,
captures long-term (persistent) efficiency (Kumbhakar & Heshmati, Citation1995). Both
and
are time-invariant. The third component,
, captures short-run time-varying (transient) efficiency, while
captures random noise or idiosyncratic error (Badunenko & Kumbhakar, Citation2016). All error terms are assumed to be independently and identically distributed.
In the case of the ASEAN economies, identifying transient and persistent efficiency is essential as the region and the individual member states have undergone significant reforms and structural changes, along with policy initiatives that can potentially affect the efficiency of the region. Investigating the nature of efficiency is valuable as the decompositions can have policy implications. For example, if persistent efficiency is low, it may be an indicator of non-competitive market conditions and thus, must be addressed appropriately (Badunenko & Kumbhakar, Citation2016).
Accordingly, this study employs a stochastic production frontier model with a four-component error structure and is estimated using random-effects and maximum likelihood, as shown in EquationEquation (3)(3)
(3) , where the variables are in log form and mean-differenced. In each cross-section, there are
countries indexed
that operates over
indexed
. The variables
shift the frontier leading to technological advancement. The justification and details of these variables employed are discussed further in Section 2.2.
The model is estimated using random-effects and maximum likelihood, as it is assumed that all errors are independently distributed. Estimating a stochastic frontier using fixed-effects will not be suitable as the time-varying idiosyncratic error , will be correlated with the fixed effects (Badunenko & Kumbhakar, Citation2016). The efficiency error terms
and
are also assumed to have half-normal distributions (Greene, Citation2004). Finally, the production frontier is estimated using a one-step simulated maximum likelihood method as the Bayesian approach may involve a loss of information (Filippini & Greene, Citation2016). In this case, the study estimates the production frontier in the first stage, splits the time-varying error components in the second stage and finally the time-invariant errors in the final stage.
In addition to persistent and transient efficiency, this study decomposes the frontier into a Malmquist index as an estimate of gross technical efficiency, technical change and returns to scale change. In brief, the Malmquist index is based on the idea that production technology is defined by a set of input-output combinations (Farrell, Citation1957; Färe et al., Citation1994; Malmquist, Citation1953). The production frontier allows for the estimation of the output distance function, which measures the distance of a vector of inputs and outputs in period with respect to the technical frontier. Thus, following the estimation of the output distance function, the Malmquist index allows for the measurement of technical change between two periods based on its relative distance. Färe et al. (Citation1994) suggest the following Malmquist index to account for changes in technology.
However, many previous studies estimate the Malmquist index by employing the non-parametric data envelopment analysis method. This study estimates the Malmquist index using the parametric stochastic method, which assumes a predefined functional form. The parametric specification allows for flexibility and has been used in a number of studies (Balk, Citation2001; Orea, Citation2002; Pantzios et al., Citation2011). Therefore, this study employs the translog output distance function using a predefined parametric form and provides estimates of gross efficiency, technical change, returns to scale while taking into account of persistent and transient efficiency.
3.2. Data and variables
The data is compiled from the Penn World Table 9.1 and employs annual country-level data for all the variables (Feenstra et al., Citation2015). Country-level data are compiled for the 10 ASEAN economies from 1980 to 2017. The time period is chosen, as there are missing data before 1980, since the simulation of persistent and transient efficiency requires no missing data. All the variables are logged-transformed and mean-differenced which can be interpreted as elasticities.
The full estimated model is shown in EquationEquation (4)(4)
(4) and the stochastic production frontier model employs the standard variables used in frontier modelling (Aigner et al., Citation1977). The output variable
is real GDP and is standard for analysing productivity. The two main variable inputs for the production function are also included such as real capital stock, denoted as
and labour employed, denoted as
. The interaction term between capital and labour and its squared terms are also included for further inferences. In addition, the time trend and its squared term are included to account for Hicks-neutral technological change, denoted as
and
. The interaction between time and real capital stock and labour employed is also included to evaluate the effects of capital and labour over time. Finally, the study employs three control variables which include
, which is the ratio of government spending as a share of GDP,
which is a ratio of exports and imports to GDP and also known as openness to trade and
, which is a dummy variable for the five ASEAN founding countries. These five countries are Indonesia, the Philippines, Malaysia, Singapore and Thailand.
In terms of the estimated transient and persistent efficiency scores, it is expected that persistent efficiency will be lower than transient efficiency as the ASEAN economies have gone through significant structural changes over the sample period. It is expected that efficiency scores will have room for improvement as the ASEAN economies are still far from full regional integration. In terms of the estimated technological progress, it is expected that on average, the ASEAN economies should achieve low scores of 0 per cent to 1 per cent technological progress, as highlighted by the earlier studies (Young, Citation1995) and that the returns to scale change should be declining over the sample period as the ASEAN economies grew through capital-intensive growth (Krugman, Citation1994).
Table presents the summary statistics of the variables employed at levels. It can be observed that there is considerable variation across the ASEAN economies highlighting the diversity of the region. In terms of the specific details, the largest real GDP, real capital stock and labour employed on average were observed in Indonesia, while the lowest real GDP and real capital stock on average were observed in Cambodia and Lao PDR. Additionally, the lowest labour employed on average was seen in Brunei and Singapore, which is unsurprising as they are the two ASEAN economies with the lowest population. Expectedly, government spending is highest in Myanmar and Lao PDR, while government spending is the lowest in Singapore. Finally, Singapore and Malaysia are the two most open economies while the least open economies on average are Cambodia, Viet Nam and Lao PDR.
Table 1. Summary statistics
4. Results and discussion
This section begins with a discussion of the production frontier estimates. The transient and persistent efficiency scores, as well as the technological change and returns to scale change, are presented, followed by discussion and policy implications.
Table reports the coefficients and parameters of the production frontier. The estimated results show expected findings. Both capital and labour, denoted k and l, are positive and significant at the 1% level, in line with the production theory (Holtz-Eakin, Citation1992). In theory, a production function must have monotonicity properties satisfied before it can be reasonably interpreted and, in this case, both k and l are positive and significant to growth (Henningsen & Henning, Citation2009). More interestingly, the estimates show that capital accounts for 54 per cent of GDP growth while labour accounts for 41 per cent of GDP growth. The estimations support the suggestion put forth by Krugman (Citation1994) and Young (Citation1995), who highlights that the ASEAN economies grew mainly through capital-intensive growth. However, when examining the interaction terms between capital and labour, (k × l), it can be observed that the interaction is negative and significant at the 1% level.
Table 2. Production function coefficients and associated parameters
This suggests that a trade-off exists and reveals a different situation. On closer examination of the squared terms of capital and labour, k2 and l2, although both are positive and significant, the coefficient of l2 is larger than k2. This suggests that the effects of labour is more effective as it increases in comparison to capital in the ASEAN economies. Furthermore, the interaction between capital and time, (k × t), is insignificant while the interaction between labour and time, (l × t), is positive and significant at the 5% level. Thus, the estimated findings emphasise the need to reform and implement growth-enhancing labour policies for the long-run.
Both the time-trend and its square term, t and t2, are positive and significant at the 1% and 5% level. This suggests that the ASEAN economies have benefited from technological progress and have experienced a shift in the frontier, supporting the production theory. This growth may have resulted from the earlier free trade policies that the ASEAN economies have implemented when the region began to integrate and progressively open the region to freer trade. This can benefit the region as it can absorb technological advances that are generated in other advance economies in the form of foreign direct investment and the transfer of foreign technologies (Edwards, Citation1998; Javorcik, Citation2004). However, in closer examination, it can be observed that the coefficients of the time-trends are quite small and suggests that the gains in technological progress may be minimal.
The coefficients of the control variables also show expected results. The share of government spending over GDP, gov, is positive and significant at the 10% level to GDP. This is consistent with previous studies examining the effects of government size and growth, whereby government spending can be beneficial to growth (Scully, Citation1995). On the other hand, the coefficient of gov is small. This highlights the debatable role that governments play in economic growth, as on the one hand, larger governments may crowd out the private sector and lead to negative growth (Fölster & Henrekson, Citation2001). Yet in many developing countries, such as the majority of the ASEAN member states, government spending exists to support the economy despite being less efficient and less productive than the private sector.
Meanwhile, it can be observed that the effects of opn is positive and significant at the 10% level to growth. Openness to trade is well established in the literature to have a positive association with economic growth in past and recent empirical works (Barro, Citation1991; Darku & Yeboah, Citation2018). Policies that increase openness, such as the ASEAN Free Trade Agreement, can encourage capital inflows and promote foreign direct investment into the economy (Wan Lee & Brahmasrene, Citation2014). This allows the economies to benefit from an increase in capital input and benefit from disembodied technological progress from foreign firms and converge towards a higher growth rate. Finally, the founders of the ASEAN economies are associated with stronger growth, as asean5 is positive and significant at the 10% level. This is unsurprising as it suggests that these initial economies benefited from first-mover advantages, relative to the other ASEAN economies which joined at later stages. These first-mover advantages include the initial regional integration efforts, whereby the other ASEAN economies would only benefit from second-mover advantages (Choi et al., Citation2017).
Table presents the average efficiency scores of the ASEAN economies from the fitted structural form of the frontier model. Gross efficiency is the interaction between persistent efficiency (1—exp ()) and transient efficiency (1—exp (
)), and these efficiency scores are bounded between 0 and 1, where 0 is the least efficient and 1 is the most efficient. The reported average persistent efficiency scores of the ASEAN economies are 91.7 per cent while the average transient efficiency scores of the region are at 99.3 per cent. This results in an average gross efficiency score of 92.3 per cent, implying that the region can increase its GDP by a further 7.7 per cent if persistent efficiency issues is increased through policy changes within the individual ASEAN member states and as a region. Any additional interpretations on these aggregated figures may not be reliable and as such, will need to be further decomposed over time and across the ASEAN economies alongside the estimates of technical change and returns to scale change.
Table 3. Average efficiencies of the ASEAN economies
Table reports the estimated gross efficiency, technical change and returns to scale change over time. In terms of gross efficiency, the scores remain relatively similar over the sample time period from 1980 to 2017. Although it can be observed that there is a reduction in efficiency levels during the Asian financial crisis in 1997, efficiency scores remain relatively similar, averaging at around 92.3 per cent throughout the sample. In terms of technological progress, the ASEAN economies did not perform well in terms of TFP growth. Technical change was low prior to 1992 before the ASEAN Free Trade Agreement was signed and averaged below 1 per cent.
Table 4. Gross efficiency, technical change and returns to scale over time
This echoes the argument put forth by Krugman (Citation1994) and Young (Citation1995), who criticised the capital-intensive growth that the ASEAN economies adopted and did not achieve a sustainable level of technological progress. Despite the criticism, capital-intensive growth strategy was a decent growth strategy as the ASEAN economies benefited from increasing returns to scale over the time period, averaging at 8.8 per cent. Returns to scale refer to the rate by which output GDP changes if both capital and labour are changed by the same factor, and in this case, increasing returns to scale means that output GDP grows more than the inputs of capital and labour.
Figure 2. Gross efficiency over time.
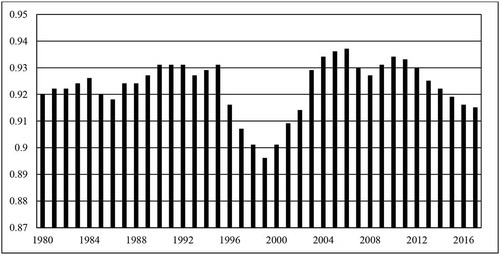
Figure provides a closer examination of gross efficiency over time. Although on average gross efficiency remains relatively similar across the sample time-period, in 1994 it can be observed that there is a substantial downward trend in gross efficiency. In fact, gross efficiency reached a low of below 90 per cent during the aftermath of the Asian financial crisis. Likewise, in 2007, gross efficiency experienced a downfall and again in 2011, during the onset of the Eurozone crisis and have been declining ever since. The downward trend is concerning, and these efficiency issues must be addressed by the individual ASEAN economies and collectively as a region through policy-implementation that can improve the efficiency of capital and labour.
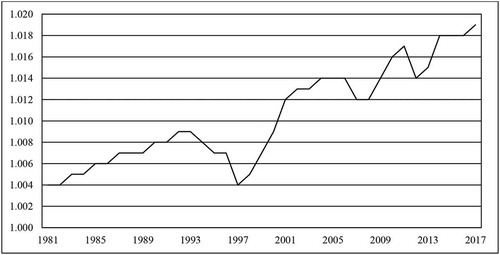
Similarly, Figure provides a closer examination of technical change over time. In similar fashion to the gross efficiency scores, it can be observed that technical change had a dramatic decline during the Asian financial crisis, hitting a low of 0.4 per cent technical change in 1994. Additionally, technical change also declined during the global financial crisis in 2007 and also during the onset of the Eurozone crisis in 2011. However, the decline in technological progress was less dramatic compared to the fall experienced during the Asian financial crisis. On the one hand, it can be concluded that the ASEAN economies did not perform well in terms of TFP growth, as the average technical change over the time-period is at 1.0 per cent. It is suggested that the recommended total factor productivity level of 2.0 per cent to 5.0 per cent a year in order to achieve sustainable growth (Munnell, Citation1990). On a positive note, technical change over time shows a positive upward trend and is close to achieving a technical change of over 2.0 per cent in 2017. The ASEAN economies should continue to observe the growth-enhancing policies that are currently in place and continue to identify policies to promote growth.
Figure 3. Technical change over time.
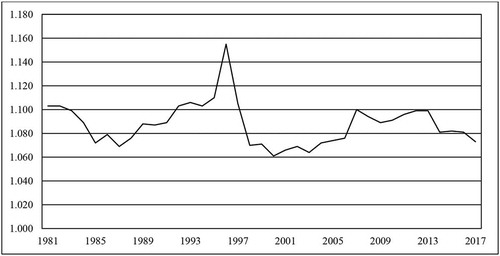
Meanwhile, Figure , which illustrates the returns to scale change over time, presents an interesting picture. It can be established that the ASEAN economies benefited from increasing returns to scale, which suggests that the economy is still converging towards its steady-state. Although at first sight, the returns to scale change seems to be stationary without any significant trends. However, on closer inspection, the returns to scale change appear to have an inverse relationship with gross efficiency and technical change. In particular, prior to the height of the Asian financial crisis, there exhibits an increasing returns to scale trend, followed by a decreasing returns to scale trend, which is expected after the onset of the crisis. The effects of the global financial crisis in 2007 and the eurozone crisis also exhibit similar trends with respect to returns to scale.
Figure 4. Returns to scale change over time.
In addition to analysing the productivity and efficiency of the ASEAN economies over time, it is also essential to decompose the estimated productivity frontier to examine the individual ASEAN member states. Table reports the gross efficiency, technical change and returns to scale change across the ASEAN member states. The estimated findings of Table are also illustrated in Figures 7 and 8, to present the estimated gross efficiency and technical change by rankings to provide further analysis of the findings. On brief inspection, the ASEAN economies in terms of productivity and efficiency are diverse across the group which is expected. For example, Indonesia is an upcoming and emerging economy with a large capital and labour force, while Singapore is a highly developed free-market economy that consists of a small labour workforce when compared to Indonesia. Furthermore, economies such as Cambodia, Lao PDR, Myanmar and Viet Nam are developing at a faster rate and are converging with their richer ASEAN counterparts following reforms and regional integration.
Table 5. Gross efficiency, technical change and returns to scale in the ASEAN economies
As a consequence, it is expected to observe differences in terms of productivity and efficiency levels across these diverse set of countries. Focusing on the gross efficiency across the ASEAN economies, in Table , it can be seen that Indonesia, on average over the sample time period, is the most efficient at utilising capital and labour relative to the production frontier of the ASEAN economies. This is followed by Malaysia, Thailand, Philippines and Singapore, which is interesting as these are the five original founding members of ASEAN. Meanwhile, Cambodia, Lao PDR, Viet Nam, Brunei and Myanmar are ranked in the bottom five in terms of gross efficiency relative to the ASEAN economies. This is quite fascinating as not only these countries joined decades after the initial declaration of ASEAN, but Cambodia, Lao and Myanmar are third world countries while Viet Nam was only considered a second world country as it was previously part of the Communist Bloc after World War II. These third world and developing economies generally experience many reforms and structural changes in order to grow and thus, will have lower efficiency before converging with its richer counterparts. Brunei is a curious one as it actually has the second-highest Human Development Index and is classified as a developed country. However, upon closer investigation, the Brunei economy is highly dependent on its oil and gas production while other sectors of its economy are relatively underdeveloped. As a result, this may perhaps explain the lower gross efficiency scores that the country experiences.
At the same time, the technological progress across the ASEAN economies also presents an interesting picture in Table . Unsurprisingly, Indonesia has the highest average TFP growth compared with the ASEAN economies. However, at a close second, Viet Nam has an average of 1.5 per cent technical change. This actually highlights the positive effects of the economic reforms and policies such as the Doi Moi policy, which the country has implemented in 1986. The Doi Moi policy was similar to China’s Open-Door Policy (H. Haini, Citation2020b), whereby the Communist Party in Viet Nam encouraged privately owned enterprises to operate and overturn collective farming to increase incentives to the agriculture industry (Dollar et al., Citation2004). The other ASEAN economies also achieved a subpar TFP growth performance and surprisingly, Singapore and Brunei rank the two lowest economies for technical change averaging at 0.5 per cent and 0.1 per cent respectively. The results echo similar findings from Kim and Lau (Citation1994), Young (Citation1995), and Hsieh (Citation2002), who suggests that Singapore is vulnerable to external shocks due to its reliance on its export market and small domestic market. Meanwhile, Brunei relies heavily on its oil and gas exports, while its other industries are relatively underdeveloped.
Finally, to provide a complete picture of technical progress across the ASEAN economies, Table reports the decompositions of technical change over time in the respective ASEAN economies. Similar trends can be observed across the economies where technical change suffers a drop during the Asian financial crisis, global financial crisis and the eurozone crisis, with the Asian financial crisis experiencing a large drop in TFP growth. Focusing on the individual economies, there are a number of ASEAN countries that have recently achieve a higher TFP growth and is positively trending upwards. Unsurprisingly, Indonesia began to achieve a technological change of more than 2.0 per cent in 2002 and have continued to perform consistently. Similarly, the Philippines and Thailand have also achieved a technical change of more than 2.0 per cent in recent years.
Table 6. Technical change over time in individual ASEAN economies
Astonishingly, Myanmar and Viet Nam, also achieve a technical change of more than 2.0 per cent in recent years. In the case of Viet Nam, these efforts can be traced back to the Doi Moi policy discussed earlier. However, Myanmar is a remarkable case as its political and economic reforms were only initiated in 2011, when the new government took power, after decades of economic isolation (Hlaing, Citation2012). Myanmar’s economic reforms focused on good governance, transparency and accountability, which supports many institutional development and economic growth theories (Glaeser et al., Citation2004), while including measures to attract foreign investment, liberalise trade, enhancing economic integration and reducing the government’s role in order to promote the private sector.
This has been successful as shown by the technical progress achieved by Myanmar which also indicates a positive trend for the future. On the other hand, Brunei has achieved a disappointing technological progress of 0.1 per cent despite being the second wealthiest ASEAN member state in the region, in terms of GDP per capita. This suggests the dependency of the Brunei economy on capital-intensive growth, which is unsustainable in the long-run, and thus, the country must implement growth-enhancing policies that can improve productivity for its economy. Similarly, Singapore, the wealthiest nation in the ASEAN region, in terms of GDP per capita, also suffers from the same issue. This arises due to Singapore’s dependency on its external markets making it vulnerable to external shocks. Other factors highlight Singapore’s dependency on low-skilled foreign workers which constitute 38 per cent of Singapore’s labour force. The economy must focus on upgrading its existing labour force and innovate its economy in order to achieve a higher TFP growth rate.
5. Concluding remarks
This study examines the productivity of the ASEAN economies from 1980 to 2017 in the presence of transient and persistent efficiency using a stochastic production frontier model. Previous empirical researches have shown that the source of ASEAN’s productivity growth has been driven by capital-intensive growth and the region relies heavily on external trade for development. The empirical findings suggest that technological progress has been consistently low, and the region will reach its steady-state if these are not addressed. However, these previous researches have been conducted before the turn of the 21st century, and since then, there has been a lack of research that examines the productivity and efficiency of the ASEAN economies in recent years. Although there are previous strands of literature that examines the determinants of economic growth within the region, there have been few studies that examine productivity growth in the context of a production function while employing recent methodological developments in the field. This is important as the region has implemented various policy initiatives in recent years, most notably the AEC Blueprint, which promotes further integration within the region. This can potentially result in long-term structural changes that can be beneficial for the economy. As a result, this study examines the productivity of the ASEAN economies over an extended time-period while decomposing the frontier for estimates of gross efficiency, technical change and returns to scale change while taking into account transient and persistent efficiency. A deeper insight into the productivity and efficiency of the ASEAN economies can provide policymakers with essential information for future policy formulation.
The estimated results for the production function model presents expected results, as capital and labour are positive and significant to GDP. More interestingly, the study finds that capital stock accounts for 54 per cent while labour accounts for 41 per cent of GDP growth. In more detail, the interaction between capital and labour suggests a trade-off, and the estimated results show that the effects of capital are weakening over the long-run while labour has a more significant impact as it increases over time. This suggests the convergence of capital towards its steady-state growth. The estimated decompositions of the production frontier model produce interesting results. On average, the gross efficiency of the ASEAN economies is 92.3 per cent efficient at utilising capital and labour. This can be improved by increasing persistent efficiency through long-term structural changes, such as the implementation of productivity-enhancing policies. Thus, if these issues are addressed, the ASEAN economies can potentially increase GDP by 7.7 per cent. In more detail, the study also finds that gross efficiency within the region falls during times of crisis, in particular, during the Asian financial crisis. The economies must establish policies to reduce the effects of contagion during crisis periods in order to maintain efficiency levels and re-focus its efforts on the domestic economy to avoid external shocks to its productivity.
Furthermore, the decompositions of technical change provide expected results. On the one hand, it can be observed that despite the slow TFP growth of the ASEAN economies, the region is trending towards a higher level of productivity growth. Similarly, it was observed that the region suffers a drop in TFP during times of crisis. The region and individual member states must re-focus on its domestic economies and implement further policies to promote integration to protect itself from external shocks. Furthermore, the region and the individual member states should formulate policies that can improve the skills of its labour force, through educational and health policies that can improve human capital development (H. Haini, Citation2020a). Moreover, it is critical to consider structural changes that can improve productivity and efficiency, such as developing a stronger ICT sector that can allow the region to develop its domestic economy and provide itself with a platform for future growth (Haini, 2019). As technological progress is inseparably linked with capital formation, developing a stronger ICT sector will promote disembodied and embodied technological progress and encourages the region to develop a highly skilled labour force for the industry. These are policies that can be implemented in the medium-term while policies that focus on regional integration will generally be longer-term.
There are a number of directions for future work that will be of interest to policymakers. This study employs a dataset of aggregated country-level data which can be improved by employing a dataset of firm-level data on the manufacturing or services industry. This can provide a deeper understanding of productivity and efficiency levels within the region and individual economies on the firm-level for specific industries. This can allow for the formulation of exclusive policies for industries within the region to promote productivity growth. Future research should focus on examining the productivity and efficiency of the sectors within the industry that can be improved and can have spillover effects on the real economy.
Disclosure statement
The author reports no potential conflict of interest and usual disclaimer applies.
Additional information
Funding
Notes on contributors

Hazwan Haini
Hazwan Haini is a lecturer in economics at the UBD School of Business and Economics at Universiti Brunei Darussalam. His research interests include economic growth, applied economics and spatial econometrics, with focus on ASEAN economies and China. He has published in several peer-reviewed journals and has presented in numerous international conferences. His recent work was published in Economic Change and Restructuring, Applied Economics Letters and Post-Communist. Previously, Hazwan has supported teaching at Loughborough University as a Graduate Teaching Assistant, delivering tutorials and lectures for the Economics Department. His teaching skills have been recognised and has been awarded an Associate Fellow of the Higher Education Academy.
References
- Aigner, D., Lovell, C. A. K., & Schmidt, P. (1977). Formulation and estimation of stochastic frontier production function models. Journal of Econometrics, 6(1), 21–21. https://doi.org/10.1016/0304-4076(77)90052-5
- ASEAN Secretariat. (2018). ASEAN Stats.
- Badunenko, O., & Kumbhakar, S. C. (2016). When, where and how to estimate persistent and transient efficiency in stochastic frontier panel data models. European Journal of Operational Research, 255(1), 272–287. https://doi.org/10.1016/j.ejor.2016.04.049
- Balk, B. M. (2001). Scale efficiency and productivity change. Journal of Productivity Analysis, 15(3), 159–183. https://doi.org/10.1023/A:1011117324278
- Barro, R. J. (1991). Economic growth in a cross section of countries. The Quarterly Journal of Economics, 106(2), 407–443. https://doi.org/10.2307/2937943
- Baumol, W. J. (1986). Productivity growth, convergence, and welfare: What the long-run data show. American Economic Review, 76(5), 1072–1085. https://www.jstor.org/stable/1816469
- Booth, A. (1999). Initial conditions and miraculous growth: Why is South East Asia different from Taiwan and South Korea? World Development, 27(2), 301–321. https://doi.org/10.1016/S0305-750X(98)00126-0
- Choi, K., Lee, D., & Lim, S. (2017). Strategic trade policies with first-mover and second-mover advantages in a vertical structure. The Journal of International Trade & Economic Development, 26(5), 612–632. https://doi.org/10.1080/09638199.2016.1262892
- Colombi, R., Kumbhakar, S. C., Martini, G., & Vittadini, G. (2014). Closed-skew normality in stochastic frontiers with individual effects and long/short-run efficiency. Journal of Productivity Analysis, 42(2), 123–136. https://doi.org/10.1007/s11123-014-0386-y
- Darku, A. B., & Yeboah, R. (2018). Economic openness and income growth in developing countries: A regional comparative analysis. Applied Economics, 50(8), 855–869. https://doi.org/10.1080/00036846.2017.1343449
- Dollar, D., Glewwe, P., & Agrawal, N. (2004). Economic growth, poverty, and household welfare in Vietnam. The World Bank.
- Edwards, S. (1998). Openness, productivity and growth: What do we really know? The Economic Journal, 108(447), 383–398. https://doi.org/10.1111/1468-0297.00293
- Färe, R., Grosskopf, S., Norris, M., & Zhang, Z. (1994). Productivity growth, technical progress, and efficiency change in industrialized countries. The American Economic Review, 84(1), 66–83. https://www.jstor.org/stable/2117971
- Farrell, M. J. (1957). The measurement of productive efficiency. Journal of the Royal Statistical Society (A, General), 120(3), 253–290. https://doi.org/10.2307/2343100
- Feenstra, R. C., Robert, I., & Timmer, M. P. (2015). The next generation of the penn world table. American Economic Review, 105(10), 3150–3182. https://doi.org/10.1257/aer.20130954
- Filippini, M., & Greene, W. (2016). Persistent and transient productive inefficiency: A maximum simulated likelihood approach. Journal of Productivity Analysis, 45(2), 187–196. https://doi.org/10.1007/s11123-015-0446-y
- Fölster, S., & Henrekson, M. (2001). Growth effects of government expenditure and taxation in rich countries. European Economic Review, 45(8), 1501–1520. https://doi.org/10.1016/S0014-2921(00)00083-0
- Glaeser, E., La Porta, R., Lopez-de-Silanes, F., & Shleifer, A. (2004). Do institutions cause growth? Journal of Economic Growth, 9(3), 271–303. https://doi.org/10.1023/B:JOEG.0000038933.16398.ed
- Greene, W. (2005). Reconsidering heterogeneity in panel data estimators of the stochastic frontier model. Journal of Econometrics, 126(2005 2),269-303
- Greene, W. H. (2004). Distinguishing between heterogeneity and inefficiency: Stochastic frontier analysis of the world health organization’s panel data on national health care systems. Health Economics, 13(10), 959–980. https://doi.org/10.1002/hec.938
- Haini, H. (2019a). Internet penetration, human capital and economic growth in the ASEAN economies: Evidence from a translog production function. Applied Economics Letters, 26(21), 1774–1778. https://doi.org/10.1080/13504851.2019.1597250
- Haini, H. (2019b). Examining the relationship between finance, institutions and economic growth: Evidence from the ASEAN economies. Economic Change and Restructuring, [Online]. https://doi.org/10.1007/s10644-019-09257-5.
- Haini, H. 2020a. Spatial spillover effects of public health and education expenditures on economic growth: Evidence from China’s provinces. Post-Communist Economies, 1–18. ( [Online]). https://doi.org/10.1080/14631377.2020.1722586.
- Haini, H. 2020b. The evolution of China’s modern economy and its implications on future growth. Post-Communist Economies, 1–25. ( [Online]). https://doi.org/10.1080/14631377.2020.1793610.
- Henningsen, A., & Henning, C. H. C. A. (2009). Imposing regional monotonicity on translog stochastic production frontiers with a simple three-step procedure. Journal of Productivity Analysis, 32(3), 217–229. https://doi.org/10.1007/s11123-009-0142-x
- Hill, H. (1997). Towards a political economy explanation of rapid growth in ASEAN. ASEAN Economic Bulletin, 14(2), 131–149. https://doi.org/10.1355/AE14-2C
- Hlaing, K. (2012). Understanding recent political changes in Myanmar. Contemporary Southeast Asia, 34(2), 197–216. https://doi.org/10.1355/cs34-2c
- Holtz-Eakin, D. (1992). Solow and the states: Capital accumulation, productivity and economic growth. (Working Paper No. 4144). National Bureau of Economic Research.
- Hsieh, C. (2002). What explains the industrial revolution in East Asia? Evidence from the factor markets. American Economic Review, 92(3), 502–526. https://doi.org/10.1257/00028280260136372
- Javorcik, B. S. (2004). Does foreign direct investment increase the productivity of domestic firms? In search of spillovers through backward linkages. American Economic Review, 94(3), 605–627. https://doi.org/10.1257/0002828041464605
- Kaldor, N. (1957). A model of economic growth. The Economic Journal, 67(268), 591–624. https://doi.org/10.2307/2227704
- Kim, J., & Lau, L. J. (1994). The sources of economic growth of the East Asian newly industrialized countries. Journal of the Japanese and International Economies, 8(3), 235–271. https://doi.org/10.1006/jjie.1994.1013
- Kruger, J. J. (2008). Productivity and structural change: A review of the literature. Journal of Economic Surveys, 22(2), 330–363. https://doi.org/10.1111/j.1467-6419.2007.00539.x
- Krugman, P. (1994). The myth of Asia’s miracle. Foreign Affairs, 79(November–December), 62–78. https://doi.org/10.2307/20046929
- Kumbhakar, S. C., & Heshmati, A. (1995). Efficiency measurement in Swedish dairy farms: An application of rotating panel data. American Journal of Agricultural Economics, 77(3), 660–674. https://doi.org/10.2307/1243233
- Lane, J. E. (2011). Law and economics in the ASEAN +3 region: The rule of law deficit. International Journal of Social Economics, 38(10), 847–857. https://doi.org/10.1108/03068291111170398
- Lee, H. H., & Tan, H. B. (2006). Technology transfer, FDI and economic growth in the ASEAN region. Journal of the Asia Pacific Economy, 11(4), 394–410. https://doi.org/10.1080/13547860600923593
- Lesher, M., & Plummer, M. G. (2011). Back to basics-post–crisis macroeconomic rebalancing in ASEAN. ASEAN Economic Bulletin, 28(2), 160–182. https://doi.org/10.1355/ae28-2d
- Malmquist, S. (1953). Index numbers and indifference surfaces. Trabajos de Estadistica, 4, 209-242. 2
- Masron, T. A. (2017). Relative institutional quality and FDI inflows in ASEAN countries. Journal of Economic Studies, 44(1), 115–137. https://doi.org/10.1108/JES-04-2015-0067
- Menon, J. (2013). Narrowing the development divide in ASEAN: The role of policy. Asian-Pacific Economic Literature, 27(2), 25–51. https://doi.org/10.1111/apel.12025
- Munnell, A. H. (1990). Why has productivity growth declined? Productivity and public investment. New England Economic Review, January/February, 3–22. https://www.bostonfed.org/publications/new-england-economic-review/1990-issues/issue-january-february-1990/why-has-productivity-growth-declined-productivity-and-public-investment.aspx
- Nordhaus, W. (1969). An economic theory of technological change. The American Economic Review, 59(2), 18–28. https://www.jstor.org/stable/1823649
- Orea, L. (2002). Parametric decomposition of a generalized malmquist productivity index. Journal of Productivity Analysis, 18(1), 5–22. https://doi.org/10.1023/A:1015793325292
- Ortega-Argilés, R. (2012). The transatlantic productivity gap: A survey of the main causes. Journal of Economic Surveys, 26(3), 395–419. https://doi.org/10.1111/j.1467-6419.2012.00725.x
- Pantzios, C. J., Karagiannis, G., & Tzouvelekas, V. (2011). Parametric decomposition of the input-oriented malmquist productivity index: With an application to greek aquaculture. Journal of Productivity Analysis, 36(1), 21–31. https://doi.org/10.1007/s11123-010-0202-2
- Petri, P. A., Plummer, M. G., & Zhai, F. (2012). ASEAN economic community: A general equilibrium analysis. Asian Economic Journal, 26(2), 93–118. https://doi.org/10.1111/j.1467-8381.2012.02079.x
- Pitt, M., & Lee, L. F. (1981). The measurement and sources of technical inefficiency in the Indonesian weaving industry. Journal of Development Economics, 9(1), 43–64. https://doi.org/10.1016/0304-3878(81)90004-3
- Ravenhill, J. (2008). `hting irrelevance: An economic community “with ASEAN characteristics.”. Pacific Review, 21(4), 469–488. https://doi.org/10.1080/09512740802294697
- Saint-Paul, G. (1993). Productivity growth and the structure of the business cycle. European Economic Review, 37(4), 861–883. https://doi.org/10.1016/0014-2921(93)90095-R
- Sarel, M. (1997). Growth and productivity in ASEAN countries. IMF Working Paper WP/97/9, Asia and Pacific Department, Washington: International Monetary Fund
- Scully, G. W. (1995). The “growth tax” in the United States. Public Choice, 85(1/2), 71–80. https://doi.org/10.1007/BF01047902
- Solow, R. M. (1956). A contribution to the theory of economic growth. Quarterly Journal of Economics, 70(1), 65–94. https://doi.org/10.2307/1884513
- Tsionas, E. G., & Kumbhakar, S. C. (2014). Firm heterogeneity, persistent and transient technical inefficiency: A generalized true random-effects model. Journal of Applied Econometrics, 29(1), 110–132. https://doi.org/10.1002/jae.2300
- Walmsley, T., Aguiar, A., & Ahmed, S. A. (2017). Labour migration and economic growth in East and South-East Asia. World Economy, 40(1), 116–139. https://doi.org/10.1111/twec.12334
- Wan Lee, J., & Brahmasrene, T. (2014). ICT, CO2Emissions and economic growth: Evidence from a panel of ASEAN. Global Economic Review, 43(2), 93–109. https://doi.org/10.1080/1226508X.2014.917803
- World Bank. (Various Years). World development indicators.
- Yam, T. K. (1995). China and ASEAN: Rivals for foreign direct investment. Asia Pacific Business Review, 2(1), 50–67. https://doi.org/10.1080/13602389500000031
- Young, A. (1995). The tyranny of numbers: Confronting the statistical realities of the East Asian growth experience. The Quarterly Journal of Economics, 110(3), 641–680. https://doi.org/10.2307/2946695
