
 ?Mathematical formulae have been encoded as MathML and are displayed in this HTML version using MathJax in order to improve their display. Uncheck the box to turn MathJax off. This feature requires Javascript. Click on a formula to zoom.
Abstract
This study focuses on assessing the role of various bank-specific, industry-specific and macroeconomic determinants in Indian commercial banks performance. Performance of the Indian banks has been measured by Return on Assets (ROA), Return on Equity (ROE) and Net Interest Margin (NIM) and Pre-provision profit ratio. The study analyses impact of various bank-specific factors like bank size, capital ratio, risk, cost to income ratio, funding cost, revenue diversification, labour productivity and bank age on bank performance. It also tries to assess the relationship between various bank-specific and industry-specific variables like bank concentration, inflation rate and GDP growth rate with bank performance. Fixed effects estimation model and Generalized Method of Moments (GMM) have been used on a panel data of 19 years for 64 commercial banks of India. The findings reveal that private sector banks are more profitable than the public sector banks. Additionally, the results of the study show that bank size, non-performing loan ratio and revenue diversification are the major determinants of the commercial banks performance in India. Furthermore, the results reveal that during the crisis period the impact of bank size, bank age, labour productivity and revenue diversification on the performance of the Indian banks is robust. The higher non-government stake leads to the enhanced performance of the commercial banks in India. The higher capital adequacy leads to the increase in the performance of the banks. The larger banks are less profitable. The results provide better insights about the determinants of Indian banks profitability.
PUBLIC INTEREST STATEMENT
“This paper investigates the role of various bank-specific and macro-economic indicators in the profitability of Indian commercial banks. In India, the banking sector consists of public and private sector banks. The role of various factors may differ in the banks across different ownerships. Hence, it is imperative to know the factors that affect the banking sector profitability and is of utmost importance. This paper uses secondary data collected from the Reserve Bank of India (RBI) database, CMIE PROWESSIQ database and Bloomberg database. Fixed effect and GMM estimation methods have been used to analyse the impact of various factors on the profitability of Indian commercial banks. The results show that bank size, non-performing loan ratio and revenue diversification are the major determinants of the commercial banks performance in India measured by ROA, ROE, NIM and PPR. The study recommends that regulators and policymakers should consider extent of the non-government stake in such a way that may improve the profitability of the Indian public sector banks.”
1. Introduction
The early studies on the financial performance of commercial banks show that bank-specific factors like board size, bank size, capital ratio, funding cost, revenue diversification, and bank age are the major factors which determine the financial performance of the firms (Athanasoglou et al., Citation2006; Dietrich & Wanzenried, Citation2011; Molyneux & Thornton, Citation1992). In the same line, the subsequent studies have studied the influence of industry-specific and macro-economic factors on the bank performance (Athanasoglou et al., Citation2006; Kosmidou et al., Citation2005; Rachdi, Citation2013). We observe that the common determinants of the financial performance of commercial banks vary across samples and time period. There is no consensus about the specific factors which determine the financial performance and the nature of the relationship also vary across the samples. As we know, the structure of banking structure also varies across the countries i.e., the banking sector in the USA is dominated by the private banks, but in case of India, the public sector banks dominate the banking sector in terms of volume of transactions. In the eve of the liberalization, private banks also play a significant role in the economic growth process in India. In this context, it is very important to understand the behaviour of bank performance in terms of their ownership. Specifically, the studies on the determination of the financial performance of private sector banks are scant.
As the banking sector is prone to market failure, across the globe, this sector is highly regulated in accordance with Basel norms. Therefore, the regulatory capital ratio may also play a significant role in determining bank performance. It is assumed that banks having high capital adequacy ratio are more stable and less prone to liquidation, so that it can also be assumed that the performance of the banks with high regulatory capital adequacy ratio may be less sensitive to the common determinants of bank performance. Considering the importance of the size of the banks, some of the studies have tried to examine the relative importance of size on the determination of bank performance. But we find that most of the previous studies have largely concentrated on the developed markets, and the studies on the banks’ performance in the context of India are limited to the public sector banks. Most of the available studies in India have also not examined the relative importance of ownership, regulatory capital and size in determination of banks’ financial performance. Considering all these issues, the basic objectives of this study are to (i) to identify the common factors which affect the financial performance of commercial banks in India and (ii) to examine the relative importance of ownership, regulatory capital and size of the bank on the determination of financial performance of commercial banks.
This organization of the study is as follows. Section 2.2 presents the literature review, which includes the empirical evidences on the relationship between Bank-specific, Industry-specific and macro-economic factors and bank performance. Section 2.3 highlights the variables, data, and preliminary evidence. Section 2.4 specifies the models and methodology used in this chapter. Section 2.5 discusses the empirical results, and section 2.6 provides the summary and conclusions.
2. Literature review
Existing empirical studies examine the role of both internal and external factors on the determination of bank performance. The internal factors include the bank-specific, and external factors are represented by the industry-specific and macro-economic fundamentals. Following the earlier studies (Short, Citation1979; Bourke, Citation1989) some of the existing studies have focussed on determination of bank profitability in the individual country level (Angbazo, Citation1997; Badola & Verma, Citation2006; Barajas et al., Citation1999; Berger, Citation1995; Dietrich & Wanzenried, Citation2011; Goaied & Bennaceur, Citation2008; Guru et al., Citation2002; Mamatzakis & Remoundos, Citation2003; Pasiouras & Kosmidou, Citation2007; Perera & Wickramanayake, Citation2016; Sufian & Habibullah, Citation2010). Other studies access the bank profitability across the countries (Almaqtari et al., Citation2018; Athanasoglou et al., Citation2006; Bougatef, Citation2017; Demirguc-Kunt & Huizinga, Citation1999; Dietrich & Wanzenried, Citation2014; Goddard et al., Citation2004b; Micco et al., Citation2007; Molyneux & Thornton, Citation1992; Pasiouras & Kosmidou, Citation2007; Perera & Wickramanayake, Citation2016; Robin et al., Citation2018; Staikouras & Wood, Citation2004). Existing studies have identified some of the major factors such as the size of the bank, age, efficiency, labour productivity, capital ratio, deposit growth, etc. which determine the bank performance.
2.1. Bank-specific determinants
“Large Banks with larger size have an advantage of a large number of borrowers, economies of scale and diversification, leading to low funding cost and consequently higher profits (Akhavein et al., Citation1997; Bikker & Hu, Citation2002; Bourke, Citation1989; Elsas et al., Citation2010; Flamini et al., Citation2009; Goddard et al., Citation2004a, Citation2004b; Iannotta et al., Citation2007; Mercieca et al., Citation2007; Molyneux & Thornton, Citation1992; Smirlock, Citation1985). On the other hand, the opposing view is that an increase in bank size leads to higher levels of marketing, operational, asymmetric information and bureaucratic costs, and results in a negative link between profitability and size (Barros et al., Citation2007; Tan, Citation2016; Djalilov & Piesse, Citation2016). In the existing empirical literature, some of the studies find a positive relationship between bank size and profitability. AL-Omar and AL-Mutairi (Citation2008), Anbar and Alper (Citation2011), Masood and Ashraf (Citation2012), Acaravci and Çalim (Citation2013), Petria et al. (Citation2015), Singh and Sharma (Citation2016), Bougatef (Citation2017), and Chowdhury and Rasid (Citation2017) and other strand of literature find the evidence of negative effect of size on profitability (Gul et al., Citation2011; Kosak & Cok, Citation2008; Singh & Sharma, Citation2016). Thus, the size effect on profitability remains ambiguous.
The relationship between equity capital and profitability is also ambiguous. Some of the existing theoretical studies argue that more capital leads to less need for external funding and lower cost of capital, lower bankruptcy cost, and therefore, a positive relationship can be expected between equity capital ratio and profitability (Berger, Citation1995). On the other hand, higher equity capital declines the level of financial leverage, and risk which ultimately adversely affect the overall profitability of the banks. The empirical findings on the relationship between equity capital ratio and profitability are mixed in nature. Most of the studies find the positive association between equity capital and performance (Wall, Citation1985; Bourke, Citation1989; Molyneux & Thornton, Citation1992; Zimmerman, Citation1996; Demirguc-Kunt & Huizinga, Citation1999; P.P. Athanasoglou et al., Citation2005; Athanasoglou et al., Citation2006; Goaied & Bennaceur, Citation2008; Dietrich & Wanzenried, Citation2011; Wahidudin et al., Citation2013; Ayaydin & Karakaya, Citation2014; Jabbar, Citation2014; Saeed, Citation2014; Batten & Vo, Citation2019). On the other hand, Guru et al. (Citation2002), Goddard et al. (Citation2004a), Ali et al. (Citation2011) and Chronopoulos et al. (Citation2012) find a negative relationship between equity capital ratio and performance.
Problems with the bank’s asset quality are usually assumed to have an inverse relationship with profitability. Most of the studies have used non-performing loans ratio (Non-performing loans/Total loans) as an indicator of asset quality. The increase in NPLR implies the failure of credit policy and a decrease in bank’s earnings (Saba et al., Citation2012). The empirical studies have found a significant and negative association between NPLR and profitability (Aduda & Gitonga, Citation2011; Lee, Citation2012; Macit, Citation2012; Ongore & Kusa, Citation2013; Kaaya & Pastory, Citation2013; Poposka & Trpkoski, Citation2013; Trujillo-Ponce, Citation2013; Li & Zou, Citation2014; Ndoka & Islami, Citation2016). We also expect a negative relationship between NPLR and profitability.
Another factor that affects the bank’s profitability is its efficiency which, is generally measured by the cost to income ratio. It can be used to measure the operational efficiency of the bank. It is generally measured as the ratio of non-interest expenses to total income. The empirical studies find a negative relationship between cost to income ratio and profitability measures (Bourke, Citation1989; Kosmidou et al., Citation2005; Pasiouras & Kosmidou, Citation2007; Heffernan & Fu, Citation2008; Mathuva, Citation2009; Alexiou & Sofoklis, Citation2009; Liu & Wilson, Citation2010; Olson & Zoubi, Citation2011; Dietrich & Wanzenried, Citation2011; Van Ommeren, Citation2011; Bhatia et al., Citation2012; Cerci et al., Citation2012; Sastrosuwito & Suzuki, Citation2012; Almumani, Citation2013; Almazari, Citation2013; Ameur & Mhiri, Citation2013; Francis, Citation2013; Rachdi, Citation2013; Trujillo-Ponce, Citation2013; Turgutlu, Citation2014). Interest expenses of the bank is also considered as an important determinant of bank profitability, and the major factors which affect the interest expenses are the market interest rate, competition and composition of sources of funds (Dietrich & Wanzenried, Citation2011). Higher interest expenses reduce the net interest margin and also the overall profit of the bank. Thus, a negative relationship can be expected between interest expenses and profitability.
In line with the findings of Jiang et al. (Citation2003), it is assumed that more income can be generated when banks are engaged in a number of different businesses (Stiroh & Rumble, Citation2006). The banks with more diversified activities have the ability to reduce their costs from economies of scope (Tan & Floros, Citation2012). However, Demirguc-Kunt and Huizinga (Citation1999), and Tan (Citation2016) have argued that there is a negative relationship between diversification and bank profitability due to the fact that, compared to the traditional interest income activity, there is stronger competition in the area of fee-income generating business, which precedes a decrease in bank profitability. The empirical findings on the relationship between revenue diversification and bank profitability are mixed. Considering Italian banks, Chiorazzo et al. (Citation2008) find that income diversification improves the risk/return trade-off, and its effects are more pronounced on large banks. Similarly, Demirguc-Kunt and Huizinga (Citation2010) reported the improvement in banking performance through revenue diversification as its benefits are offset by the increased exposure to non-interest endeavours. DeYoung and Torna (Citation2013) reveal that a higher share of non-traditional activities reduces the probability of a healthy bank’s failure relative to financially distressed banks. Some studies have highlighted the negative relationship of revenue diversification with bank profitability (A. Berger et al., Citation2000; DeYoung & Roland, Citation2001; Stiroh, Citation2004). Lepetit et al. (Citation2008) also show that banks relying more on non-interest activities (commission and fee) show higher default risk relative to banks, mainly busy in lending activities, which is true for small banks. Analyzing, European data, De Jonghe (Citation2010) and Fiordelisi et al. (Citation2011) find that revenue diversification increases banks’ risk. Similarly, while studying Vietnamese commercial banks, Khanh Ngoc Nguyen (Citation2019) shows that diversification negatively affects profitability as higher diversification leads to higher risk.
It is argued that labor productivity also affects bank profitability. Higher labour productivity reflects efficient bank management as well as increases the bank’s efficiency and fosters the bank’s profitability. Labour productivity is measured through the profit contribution to the bank per employee. Most of the literature supports the view that it has a positive impact on profitability (Batten & Vo, Citation2019; Bhatia et al., Citation2012; P.P. Athanasoglou et al., Citation2005; Tan, Citation2016; Tan & Floros, Citation2012). We also expect a positive association between labour productivity and profitability of the bank. A firm’s age may affect its financial performance because a long presence in the market helps a firm to achieve a competitive advantage. Staikouras et al. (Citation2007) have examined the South Eastern European (SEE) banking industry over the period 1998–2003 and reveal a positive and significant relationship. Ahmed Mohsen Al-Baidhani (Citation2015) in his study on Islamic banks, in Yemen, along with six GCC countries, has revealed a positive and significant impact of age on ROE confirming the learning curve principle, which suggests that banks become proficient from their past experiences. Higher ROE of older banks may be the result of bank age and the market share, as well as the longer custom and good reputation enjoyed during the course of time. The new banks focus on capturing market share rather than profitability and hence are not profitable in initial years. Most of the empirical studies find a positive and significant association between bank age and profitability (Athanasoglou et al., Citation2008; Tan, Citation2016; Tan & Floros, Citation2012). However, it is also assumed that older firms may have a rigid administrative process, enhanced bureaucracy with limited investment opportunities in the later stage of their life cycle, which may adversely affect profitability. Therefore, the impact of age on profitability is not conclusive.”
2.2. Industry-specific and macroeconomic determinants
“The structure–conduct–performance hypothesis states that increased market power yields monopoly profits (Gilbert, Citation1984). In a highly concentrated banking market, customers have fewer choices, competition is less, and the market power of individual banks is greater, and therefore, the profitability of individual banks may be increased by the earning of monopolistic profits. Market concentration may not enhance the profit sometimes as the benefits are offset by the costs generated due to the pursuance of the quiet life of the management in the form of the relaxed environment and not utilizing the revenue-enhancing opportunities (Berger & Humphrey, Citation1994). In the empirical literature, bank concentration has been measured through either K ratio or Herfindahal-Hirschman Index. The empirical findings on positive impact of market concentration include Short (Citation1979), Molyneux and Thornton (Citation1992), Athanasoglou et al. (Citation2006), Pasiouras and Kosmidou (Citation2007), Ayaydin and Karakaya (Citation2014), Bourke (Citation1989), and Demirguc-Kunt and Huizinga (Citation1999), Goddard et al. (Citation2004a, Citation2004b), Kosmidou et al. (Citation2005), Shen et al. (Citation2009), Tregenna (Citation2009), Dietrich and Wanzenried (Citation2011), Sufian (Citation2011), Sastrosuwito and Suzuki (Citation2012), Karimzadeh et al. (Citation2013), C. C. Lee and Hsieh (Citation2013), Perera et al. (Citation2013), Rachdi (Citation2013), and Trujillo-Ponce (Citation2013). Some of the studies also find a negative association between bank concentration and profitability (Ameur & Mhiri, Citation2013; Batten & Vo, Citation2019; Chronopoulos et al., Citation2012; Kanas et al., Citation2012; Liu & Wilson, Citation2010; Ramadan et al., Citation2011; Tan & Floros, Citation2012).
The Inflation rate may have both direct and indirect impacts on bank profits (Staikouras and Wood (Citation2004). An increase in prices may affect the input prices, such as labour, equipment, and facilities, which ultimately affect the total cost and profit. Indirect effects of inflation on profitability come through changes in interest rates and asset values. It has been argued that, as banks lend money for longer periods than they borrow it for, inflation tends to decrease their margins and profits (Bordeleau & Graham, Citation2010). Most of the studies find a negative association between inflation and profitability (Ali et al., Citation2011; Ayaydin & Karakaya, Citation2014; Francis, Citation2013; Ongore & Kusa, Citation2013; Rachdi, Citation2013; Sufian & Chong, Citation2008). Some of the studies have shown a positive relationship also (Demirguc-Kunt & Huizinga, Citation1999; Guru et al., Citation2002; P.P. Athanasoglou et al., Citation2005; Flamini et al., Citation2009; Shen et al., Citation2009; Gul et al., Citation2011; Sufian, Citation2011; Tan & Floros, Citation2012; Trujillo-Ponce, Citation2013; Tan, Citation2016; Batten & Vo, Citation2019). Thus, the relationship between inflation and bank profitability is ambiguous.
Economic growth is assumed to have a positive impact on profitability due to higher demand for bank credit in the period of economic upswing, and lower probability of loan defaults. This is measured by the year’s real change in the gross domestic product (GDP) of the country. A large number of studies find a positive association between GDP growth rate and bank profitability (Goddard, et al., Citation2004a; Kosmidou et al., Citation2005; Shen et al., Citation2009; Ali et al., Citation2011; Dietrich & Wanzenried, Citation2011; Gul et al., Citation2011; Van Ommeren, Citation2011; Chronopoulos et al., Citation2012; Karimzadeh et al., Citation2013; Trujillo-Ponce, Citation2013; C. C. Lee & Hsieh, Citation2013; J. Y. Lee & Kim, Citation2013; Turgutlu, Citation2014; Vejzagic & Zarafat, Citation2014; Tan, Citation2016). Some of the studies have also reported a negative association between the growth rate of GDP and profitability (Al-Jafari & Alchami, Citation2014; Ayaydin & Karakaya, Citation2014; Liu & Wilson, Citation2010; Staikouras & Wood, Citation2004). The negative relationship may be attributed to the fact that good economic condition may increase the ease of entry and competition, which further reduce profitability. While reviewing the empirical literature on the relationship between bank-specific, industry-specific and macro-economic factors, and bank performance, we observe that the results vary across time and countries.”
3. Data and variables
3.1. Data
The bank-specific data is collected from the various publications of Reserve banks of India, Prowess database maintained by Centre for Monitoring Indian Economy (CMIE), and Bloomberg database. The macroeconomic data used in this study has been collected from the Reserve Bank of India and the World Bank database. The study period is 1998–99 to 2015–2016. “The main reasons to select this time period as the period of study are (i) this period refers to as the post liberalization period in India, (ii) banking sector reforms has been carried out after 1996–97, (iii) the target period for the implementation of the Basle-I norms with regard to the maintenance of minimum capital adequacy ratio of 8% was given up to 1997–98 by Reserve Bank of India (RBI), (iv) in the year 1996–97 RBI has changed the minimum regulatory capital adequacy ratio requirement to 9% and (v) during this time period maximum possible information is available for the sample banks in the data base.” Considering all these above-mentioned points we select this study period of 18 years (1997–1998 to 2015–2016) for study. The period of study varies from chapter to chapter due to the unavailability of data. The frequency of data is yearly. To construct a balanced panel data set, we have included those banks which have continuous data available throughout the time period. A total 146 commercial banks are operating in India. Out of the 146 commercial banks, 57 banks regional rural banks are not included in our study due to the data constraint. Then, out of 89 commercial banks, we have selected 64 banks, which include 26 public sectors, 18 domestic private and 20 foreign private banks, those have continuous data during the 18 years’ sample period. Further various subsamples have been formed on the basis of ownership, bank size, bank capitalization, and time period. The tercile approach has been used to divide the full sample into large size, and small size banks. Banks in the first tercile are considered as large size banks, and banks in the lower tercile are defined as small size banks. A similar approach is used to divide the sample into high capitalized and low capitalized banks. “Though, The Indian banking sector was resilient at the time of the Global financial crisis, but private banks and foreign banks experienced a slower deposit growth during the year 2007–08 (Eichengreen & Gupta, Citation2012). Again, public sector banks especially State Bank of India, experienced an increase in deposit growth because of Government guarantee at the time of crisis. Considering this fact, this study further tries to identify the significance of financial crisis in determining the commercial banks performance considering two different periods such as period which has not witnessed any major financial crisis (1997–98 to 2006–07) and period with crisis (2007–08 to 2015–16) which has embraced a series of crises, such as global financial crisis (2007), European sovereign debt crisis (2010) and Russian financial crisis (2014).”
3.2. Variables
“We use several proxies for measuring bank performance. Following previous studies (A.N. Berger et al., Citation2010; Andres & Vallelado, Citation2008; Erhardt et al., Citation2003; Lin & Zhang, Citation2009; Muth & Donaldson, Citation1998) we use four different proxies such as return on assets (ROA), return on equity (ROE), net interest margin (NIM) and pre-provision profitability ratio (PPR) for measuring the performance of the banks. ROA is calculated as the ratio of net income to total assets, which assess how efficiently a bank is using its assets for generating income. ROE measures the rate of return on resources provided by shareholders. It indicates the amount of earnings per rupee that equity shareholders have invested. A higher ratio is better for shareholders. NIM is measured as net interest income divided by the total assets. PPR is measured as the ratio of operating profit (operating income minus operating expenses) to total assets.”
Following the literature review (Athanasoglou et al., Citation2006; Demirguc-Kunt & Huizinga, Citation1999; Molyneux & Thornton, Citation1992; Staikouras & Wood, Citation2004) the explanatory variables used in this study include the bank-specific, industry-specific and macro-economic variables. The explanatory variables used in this chapter are bank size (BSIZE), capital ratio (ETA), risk (NPLR), cost to income ratio (CIR), funding cost (FC), revenue diversification (RD), labour productivity (LP), bank age (BAGE), bank concentration(BC), inflation rate (INF) and GDP Growth Rate (GDP). In accordance with the arguments provided in the literature review section, a brief discussion regarding the measurement and expected relationship of these variables with the bank performance has been given in Table .
Table 1. Measures of variables
Table shows that private banks are more profitable than the public sector banks for the whole period from 1998 to 2016. The performance of small banks is better than large banks, which indicates that the large banks are not able to derive the benefits of economies of scale. The well-capitalized banks are also more profitable than low-capitalized banks, which supports the fact that stability leads to profitability. We have not found much difference in terms of profitability measures across the periods defined on the basis of the financial crisis, which shows that the Indian banking sector remained intact in the global financial crisis.
Figure 1. Trends in ROA of all banks, public and private sector banks during 1998–2016.
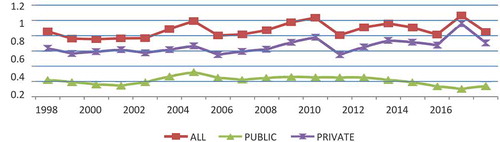
Figure 2. Trends in ROE of all banks, public and private sector banks during 1998–2016.
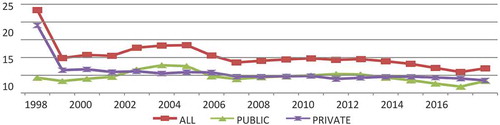
Figure 3. Trends in NIM of all banks, public and private sector banks during 1998–2016 Source: RBI, various publications.
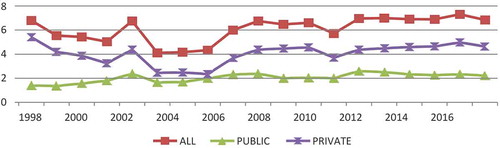
Figure 4. Trends in PPR of all banks, public and private sector banks during 1998–2016.
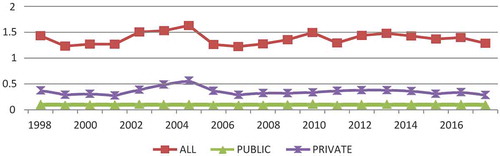
Table 2. Summary statistics of performance measures across the sub samples
Figures – show the trends of the ROA, ROE, NIM, and PPR of all banks, public and private sector banks, respectively, and reveal the higher performance of the private sector banks than the public sector banks. Private sector banks have managed to record better growth than their public sector counterparts, as the latter remain burdened with asset quality woes. “While the PSBs (public sector banks) continue to play a vital role in the Indian economy and financial system, they have been lagging their private sector counterparts on performance and efficiency indicators. Presently, the public sector banks with a predominantly high share in infrastructure financing are observed to be facing the highest amount of stress in their asset quality and profitability (Financial Stability Report released by the Reserve Bank of India). The growth of the Indian banking sector moderated further during 2013–14. Profitability declined on account of higher provisioning on banks’ delinquent loans and lackluster credit growth.” NIM is likely to increase due to the increasing number of resolutions of bad loans, improvement in CD (Credit–Deposit) ratio, and higher rates. But the increase in NIM is low since the Indian banks are shifting their focus to the non-interest activities like brokerage, commission, etc. Higher net interest income, credit to deposit ratio, and higher rates, among others, have been the key drivers of the increase in margins. The net interest margin has been positively affected by higher interest collection from non-performing loans.
Table reveals that public sector banks are larger in size, but they are not able to derive the benefits of economies of scale. Private sector banks are more capitalized than public sector banks, which imply that private sector banks are more stable than public sector banks. The credit risk or the percentage of non-performing assets is more for public sector banks. It could be due to the more government intervention in terms of providing loans to some of the non-performing sectors. The private sector banks are operating more efficiently, which is visible from the cost to income ratio (Private = 83.22%; Public = 88.62%). Due to diversification, the cost of funding has also been lower for private sector banks than public sector banks. The income earnings are more diversified in the private sector banks since their non-interest income over total income is higher than the public sector banks. The focus on alternative sources of income makes the private sector banks less risky. The private sector banks are more productive in terms of revenue per employee, which may contribute to their profitability. The public sector banks are older than private sector banks. The correlation matrix presented in Table rules out the problem of multicollinearity as the values of the correlation coefficient is very small. The negative correlation between labour productivity with size indicates that the larger size of the bank hampers the productivity of employees of the banks. The negative correlation of LP and RD with bank age shows that over the period of time, the labour productivity of the banks reduces as well as the banks focusses more on the alternative sources of income. The positive correlation of the funding cost with the cost to income ratio implies that higher funding cost contributes to the higher cost to income ratio and thus reduced efficiency.
Table 3. Averages of explanatory variables used in the study
Table 4. Correlation matrix of the explanatory variables
4. Models specification and methodology
4.1. Determinants of bank performance
We empirically investigate the effect of internal bank-specific and external factors i.e. industry-specific and macro-economic factors on bank performance with a model given by:
where, BANKPit = Bank performance indicators measured by ROA, ROE, NIM, and PPR. εit is the disturbance term, i is the bank from 1 to 64, and t is the values of years from 1998 to 2016. The β parameters capture the possible effect of explanatory variables on bank performance indicators. BSIZE: Log of Total Asset, ETA: Equity to Asset ratio, NPLR: Non Performing Loan Ratio, CIR: Cost to Income Ratio, FC: Funding Cost, RD: Revenue Diversification, LP: Labor Productivity, BAGE: Bank Age, BC: Bank Concentration, INF: Inflation, GDP: growth rate of Gross Domestic Product.
4.1.1. OwnershipFootnote1 and bank performance
Assuming that ownership is an important determinant of performance and to isolate its impact on bank performance, we incorporate ownership dummy in the model specified in EquationEquation (2.1)(2.1)
(2.1) and the model is specified as:
Here, OWN = ownership dummy i.e. 1 for the public sector and 0 for private sector banks. Further, assuming the importance of some of the bank-specific factors in determining bank performance varies across the different types of banks classified on the basis of ownership, we have included the interaction terms of ownership dummy with these bank-specific factors in the model. In this regard, it has been argued that as public sector banks are backed by the government and it is always easier and cheaper for these banks to raise capital, the relative importance of bank-specific variables like equity capital, bank risk, cost to income ratio, funding cost and revenue diversification has been lesser for these banks in comparison to private sector banks. Therefore, the coefficients of these interaction terms should hold the opposite sign in the model specified in equation (2.3).
4.1.2. Regulatory capital adequacy ratio and bank performance
As stability of the banks is also a significant determinant of bank performance, we have added one capitalization dummy in the equation specified in EquationEquation 2.4(2.4)
(2.4) , which takes the value 1 for well capitalized- banks and 0 for low-capitalized banks. Tercile approach has been used to define the well-capitalized and low-capitalized banks. Banks in the first tercile are considered as well-capitalized banks, and banks in the third tercile are considered as low-capitalized banks. Further, assuming that the relative importance of bank-specific factors across the stability of the banks, we have also added the interaction terms of the capital dummy with the bank-specific variables, and the model is specified in EquationEquation 2.5
(2.5)
(2.5) .
where, CARD is the dummy variable, which takes the value 1 for banks having high capital adequacy ratio and 0 for banks having low capital adequacy ratio.
4.1.3. SizeFootnote2 and bank performance
For large size banks, it is easy to raise capital due to their reputation and long-term existence in the market. The cost of raising funds is relatively low for them. Therefore, we may assume that role of bank-specific factors in determining bank performance varies across the size of the banks. To examine this, we specify the following two models in EquationEquations 2.6(2.6)
(2.6) and Equation2.7
(2.7)
(2.7) .
Here SD represents the size dummy, which takes the value 1 for large size and 0 for small size banks. The interaction terms in the EquationEquations 2.3(2.3)
(2.3) , Equation2.5
(2.5)
(2.5) and Equation2.7
(2.7)
(2.7) try to examine whether the role of equity capital, non-performing loans, cost to income ratio, funding cost and revenue diversification in determining bank performance vary across the bank ownership, size of the bank and capital adequacy ratio or not. Further, the lagged value of dependent variable (BANKPit−1) has been added in all the above EquationEquations (2.1
(2.1)
(2.1) to 2.7) to examine the dynamics specification of the models.
In the beginning, static panel data techniques have been used to estimate all these EquationEquations 2.1(2.1)
(2.1) through Equation2.7
(2.7)
(2.7) . As the unobservable heterogeneity and endogeneity cannot be captured through pooled regression estimation, we have used the panel data techniques to estimate the models. “Fixed effect and random effect models are the most commonly used static panel data models. The statistical tests like LM test and Hausman test have been carried out to find out a suitable panel data technique for estimating the bank performance equation.” All these tests ultimately preferred the use of fixed effect model over the random effect model. “The fixed effect model allows control for unobserved heterogeneity which describes individual-specific effects not captured by observed variables. The term ‘fixed effects’ is attributed to the idea that although the intercept may differ across individuals (banks), each individual’s intercept is time invariant. The correctness of the models is specified by the F-statistics.” Additionally, we conduct robustness tests to check the strengths of the models by dividing the sample based on different characteristics like ownership, bank size and capital adequacy ratio. “Further, according to López-Gutiérrez et al. (Citation2015), and Tran and Le (Citation2017), we have used the Generalized Method of Moments (GMM) technique to estimate the dynamic specification of the models, which are reliable in the presence of heteroscedasticity and autocorrelation (Arellano & Bover, Citation1995; Blundell & Bond, Citation1998). The panel data deals with heterogeneity by taking the first differences and hence eliminates the individual effect making the estimations unbiased. It also tackles the problem of endogeneity. Particularly, it includes the lagged independent variables as instruments, which allows for additional instruments by taking advantage of the conditions of orthogonality existing among the lags in explanatory variables (Arellano & Bond, Citation1991). We apply the Arellano–Bond test for autocorrelation of the disturbance term ϵi,t, sargan tests for over identifying restrictions and Wald test for the joint significance of the estimated coefficients for all the variables.”
5. Discussion of results
This section is divided into four subsections. The first subsection deals with the estimation results related to the determinants of bank performance for the whole as well as two different periods defined on the basis of the financial crisis. Second, third, and fourth subsections discuss the results on the impact of ownership, regulatory capital adequacy ratio, and size of the bank on bank performance behaviour.
5.1. Determinants of bank performance
Table shows the results for the whole sample. The significant F-Statistics shows that the model is correctly specified. The LM test, Hausman test results conclude that the fixed effect model is suitable for this analysis.
Table 5. Determinants of commercial bank performance (fixed effect estimation: whole sample))
The impact of bank size on profitability measures is negative and significant. Its effect is positive on the NIM of banks, which indicates that large banks are able to generate higher NIM through product diversification. The inverse relationship between BSIZE and profitability measures may imply that banks are not able to derive the benefits of the economies of scale due to their high operating costs. The increase in bank size may lead to higher levels of marketing, operational, asymmetric information and bureaucratic costs, and results in a negative link between profitability and size (Barros et al., Citation2007; Tan, Citation2016; Djalilov & Piesse, Citation2016). Small banks may form durable contacts with local clients compared to large banks which may allow them access to information beneficial in formulating contract terms which may offset any loss of economies of scale. Our results support the findings of Sufian (Citation2011) and Goddard et al. (Citation2004a, Citation2004b). The regression coefficient of ETA (measured as the ratio of total equity to total assets) is statistically significant bears a positive sign for ROE and PPR. The positive impact of the leverage ratio on bank profitability supports the fact that a higher level of capitalization leads to higher stability and safety in banks and subsequently a higher level of return or performance. Banks having higher level of equity may result in reduced cost of capital (Molyneux & Thornton, Citation1992), which may ultimately have a positive impact on bank profitability. The impact of credit risk measured through NPLR is negative and highly significant, indicating that the higher NPA leads to an increase in the level of risk, which ultimately adversely affects the profitability of the Indian banks. The poor credit appraisal skills of lenders might be responsible for high level of stress over leading to higher NPA (RBI). Additionally, the diversion of resources to unconnected business or fraud by borrowers due to the lack of due diligence and incompetence in monitoring process may also add to bad loans in the banks resulting in reduced profitability (Li & Zou, Citation2014; Ndoka & Islami, Citation2016; Trujillo-Ponce, Citation2013).
The impact of cost to income ratio is negative and significant for ROA and PPR. This implies that cost inefficiency declines the financial performance of the banks. This finding supports the studies of Bourke (Citation1989), Kosmidou et al. (Citation2005), Heffernan and Fu (Citation2008), Athanasoglou et al. (Citation2008), and Dietrich and Wanzenried (Citation2011). The regression coefficient of funding cost bears a negative relationship with all the performance measures, but it is statistically significant for ROA and PPR only. This implies that a higher cost of raising funds from the market may lead the banks to increase the lending rates, which ultimately reduces the demand for loans and also increases the probability of default, which in turn adversely affects the financial performance. Our findings support the study of Dietrich and Wanzenried (Citation2011). Revenue diversification measured as the ratio of the non-interest income to the total income has a positive impact on ROA, ROE, and PPR, and it is negatively related to NIM. It could be due to the fact that after liberalization, Indian banks have shifted from interest income activities to the non-interest income activities and enhanced their income, in the forms of fees and commissions, which has reduced their NIM but increased their overall profitability. It is consistent with the earlier findings of Anbar and Alper (Citation2011), Van Ommeren (Citation2011), Chiorazzo et al. (Citation2008), Demirguc-Kunt and Huizinga (Citation2010), and Elsas et al. (Citation2010) who have revealed that banks’ performance may possibly be enhanced through diversification of revenues. Diversification benefits are offset by the increased exposure to non-interest activities (Stiroh & Rumble, Citation2006). We find the labour productivity has a positive and significant impact on some of the profitability measures like ROA and NIM. It infers that enhanced employee productivity improves bank performance. It could be due to the use of better technology, expansion of new branches, and adoption of voluntary retirement scheme since 2000. Our results support the findings of Athanasoglou et al. (Citation2008) and Goaied and Bennaceur (Citation2001). We find that the relationship between bank age and performance measures is negative. The negative coefficient indicates that the older banks are not able to get the advantage of their brand image created over a long period of time and vice versa. The newer banks are more profitable and are able to exploit new profit avenues. Younger banks may be more sophisticated in IT infrastructure and managerial supervision, which is being reflected in the performance indicator as well. This finding supports the studies of Dietrich and Wanzenried (Citation2011).
The association between bank concentration ratio and profitability is negative and statistically significant for ROA and PPR. This result is not consistent with the structure-conduct-performance paradigm, which states that banks have the ability to extract monopoly profit in a concentrated market. This result is consistent with the findings of Berger (Citation1995) and Batten and Vo (Citation2019). We have not found any significant influence of the inflation rate on the profitability of commercial banks. We find a significant and positive impact of the growth rate of GDP on the financial performance of banks. This is consistent with a number of previous studies (Athanasoglou et al., Citation2008; Bolt et al., Citation2012; P. P. Athanasoglou et al., Citation2014). In consistence with the argument of Kanas et al. (Citation2012), the positive relationship between growth rate of GDP and bank profitability can be attributable to the fact that in the growing phase of business cycle, availability of higher growth opportunity increases the demand for bank credit and also reduces the probability of default, which in turn helps to increase the performance of the banks.
Table shows the results estimated from the GMM estimation technique. The Wald-test indicates the goodness of fit of the model, the Sargan test for the validity of the over-identifying restrictions in the GMM estimation is accepted for all specifications, and the second-order autocorrelation is rejected by the test for AR (2). The significant coefficient of the lagged dependent variable revealed from the GMM estimation presented in Table confirms the dynamic specification of the model. The value of the coefficients varies across the measures of profitability, which implies that the profitability of Indian banks does not persist. The nature of the relationship and significance level of the other factors are more or less consistent with the fixed-effect model estimation results. Further, we assess how the interrelationships among bank performance and other bank and industry-specific factors and macroeconomic characteristics vary across the sub-periods formed on the basis of the financial crisis. The first part of the sample period (1998 to 2007) has not seen any major market crisis events.
Table 6. Determinants of commercial bank performance (gmm estimation: whole sample)
On the other hand, the second part (2008 to 2016) has embraced a series of crises, such as the global financial crisis (2007), the European sovereign debt crisis (2010), Russian financial crisis (2014). Table shows the results of the determinants of bank performance across the two different periods classified on the basis of financial crisis. We find that cost to income ratio, funding cost, revenue diversification, and labour productivity are important to explain the banks’ performance across the periods. While analyzing the results, we observe some differences with respect to the significance level and value of the coefficients of the variables like BSIZE, equity to asset ratio, non-performing loan ratio, bank concentration, and GDP growth rate across the two different periods. This implies that the financial crisis does matter for the determination of bank performance also. It can also be assumed that the role of bank-specific factors like cost to income ratio, funding cost, revenue diversification, and labour productivity in determining the bank performance are robust across the periods. Table shows the GMM estimation results of the determinants of the bank performance across the two different periods classified on the basis of the financial crisis. We find that the impact of the lagged value of financial performance measure has been positive and significant across the periods. The results of other factors on the determination of bank performance are more or less consistent with the fixed effect results. This confirms that results are robust across the methods used for the estimation.
Table 7. Determinants of bank performance (financial crisis effect) (fixed effect results)
Table 8. Determinants of bank performance (financial crisis effect) (GMM estimation)
5.1.1. Ownership and bank performance
Table presents the results of the role of independent as well as the relative importance of ownership on commercial bank performance determination. LM test and Hausman test results infer the suitability of the fixed-effect model for the estimation of EquationEquations 2.2(2.2)
(2.2) and Equation2.3
(2.3)
(2.3) . The significant negative coefficient of the ownership dummy indicates that the higher non-government stake leads to the enhanced performance of the commercial banks in India. Other bank-specific variables have retained their expected signs and significance levels after the inclusion of ownership dummy.
Table 9. Determinants of bank performance (ownership effect) (fixed effect results)
The results also reveal that the regression coefficients of interaction term of ownership dummy with certain bank-specific variables such as NPLR, the cost to income ratio, and revenue diversification have changed for all the performance variables. This implies that the performance of public sector banks in India is less sensitive to all these bank-specific variables. The GMM estimation results presented in Table are consistent with the fixed-effect model results.
Table 10. Determinants of bank performance (ownership effect) (GMM estimation)
5.1.2. Regulatory capital ratio and bank performance
“Capital adequacy ratio measures the stability of the commercial banks. The performance of the stable banks is always better than relatively unstable banks due to better risk management, and loss-absorbing capacity. Therefore, capitalization of the banks may have a link with the lending activities and also the profitability. It can also be hypothesized that the stability of the banks has different implications for the role of other bank-specific variables in determining bank performance as the probability of failure is less for the stable banks.” In this context, we try to examine the independent role of capitalization as well as the impact of capitalization of the banks on the relationship between bank performance and other bank-specific variables such as non-performing loans to total loans, cost to income ratio, funding cost and revenue diversification. It is assumed that the significance of all these bank-specific variables are less for the highly capitalized banks as these banks are more stable, and it is easy for them to reduce their cost due to their better risk management ability, market representation, and less regulatory cost. For this, we have divided the banks between the well-capitalized and low-capitalized banks on the basis of the tercile approach. We have used dummy variable 1 for highly capitalized banks and otherwise 0. Table presents the fixed effect estimation results of the impact of capitalization on bank performance. The significant positive coefficient of the capital adequacy ratio dummy shows that higher capital adequacy leads to increase in the performance of the banks. This supports the argument that the higher capital adequacy ratio represents the bank’s financial strength and is used to protect depositors and promote the stability, efficiency, and profitability of banks. We also find that the regression coefficient of interaction terms of capitalization dummy with cost to income ratio has changed for all the performance variables. This implies that the performance of banks having a high capital adequacy ratio in India is less sensitive to cost to income ratio of the commercial bank.
Table 11. Determinants of bank performance (capitalization effect) (fixed effect)
Table presents the GMM results of the impact of capitalization on bank performance. It also shows the significant positive coefficient of the capital adequacy ratio dummy, which confirms that higher capital adequacy leads to an increase in the performance of the banks. We also find that the regression coefficient of interaction terms of capitalization dummy with cost to income ratio has changed for all the performance variables, which are consistent with the findings of the fixed effect estimation results. This implies that the financial performance of well-capitalized banks is less sensitive to cost to income ratio of the bank and other bank-specific variables like NPLR, FC, and RD do play an important role for determination of bank performance for well-capitalized as well as low-capitalized banks.
Table 12. Determinants of bank performance (capitalization effect) (GMM estimation)
5.1.3. Bank size and profitability
This section examines the role of bank-specific determinants of bank profitability across the size of the bank. The tercile approach is used to divide the full sample into a small size and large size banks. Banks in the first tercile are considered as large size banks, and banks in the third tercile are termed as small size banks. We take the value of 1 for large size banks and 0 for small size. Results reported in Table reveal that the regression coefficient of size dummy is negative, which implies that size has a negative impact on performance of banks. We also observe that the interaction terms of the size dummy with the explanatory variables like equity to capital ratio, the cost to income ratio, and revenue diversification bear the opposite signs of those on the original explanatory variables.
Table 13. Determinants of bank performance (size effect) (fixed effect)
These results indicate that the performance of large banks is less sensitive to variables like capital ratio, the cost to income ratio, and revenue diversification than the small size banks. The results estimated from GMM techniques presented in Table also provide similar results as found from fixed effect estimation. This implies that the impact of bank size on the determination of financial performance of commercial banks is robust across the methods of estimation.
Table 14. Determinants of bank performance (size effect) (GMM estimation)
6. Summary and conclusions
This study tries to identify the common determinants of the profitability of commercial banks operating in India. Private sector banks are more profitable than public sector banks. Similarly, small banks and well-capitalized banks are performing better. Public sector banks are larger in size and have more non-performing assets. The private sector banks are more capitalized and operate more efficiently than public sector banks. The cost of funding has also been lower for private sector banks than public sector banks. RD is higher in private sector banks relative to public sector banks. The private sector banks are more productive (higher revenue per employee). The empirical results reveal that bank size, non-performing loans ratio, and revenue diversifications are the major determinants of the financial performance of the Indian banks. Bank size has an adverse effect on bank profitability. The impact of credit risk measured through NPLR is negative and highly significant, indicating that the higher NPA leads to an increase in the level of risk, which ultimately adversely affects the profitability of the Indian banks. Revenue diversification bears a positive relationship with bank profitability but inverse on NIM. This may be because, after liberalization, banks shifted to non-interest income activities, which enhanced their income in the forms of fees and commissions. It leads to decline in NIM but increased their overall profitability. We also find that the results vary across the periods defined on the basis of the occurrence of the financial crisis. During the crisis period, the impact of bank size, bank age, NPLR and revenue diversification on the performance of the Indian banks are robust. Equity to capital ratio and bank risk does not have a significant impact on any of the performance measures in the period without crisis. A higher non-government stake leads to an increase in performance. The performance of public sector banks in India is less sensitive to NPLR, cost to income ratio, funding cost, and revenue diversification in comparison with private sector banks. Higher capital adequacy leads to an increase in the performance of the banks. The performance of commercial banks having high capital adequacy ratio in India is less sensitive to cost to income ratio. The performance of small banks is more sensitive and influenced by the variables like capital ratio, the cost to income ratio, and revenue diversification than the large size banks. The study has some implications like the Indian commercial banks should be encouraged to diversify their income portfolio apart from the conventional sources of interest income. The regulators and policymakers should consider the extent of the non- government stake in such a way that may improve the profitability of the Indian public sector banks. Further, the bankers should be more attentive towards the bank-specific determinants for efficient utilization of banks’ funds in order to improve the Indian commercial banks’ financial performance. The current study tries to fill an important gap in the existing body of literature of banks on bank-specific and macroeconomic determinants of Indian commercial banks’ profitability by providing a fresh empirical confirmation. The findings have substantial influences on the prevailing body of literature by broadly describing and critically examining the present situation of Indian commercial banks’ profitability. More precisely, this study evidences the factors that may impact Indian banks’ profitability during 1999–2016. During this period, Indian commercial banks faced a lot of challenges like, financial crisis, mounting NPA and scams that hit some Indian commercial banks and thus provide empirical evidence for bankers and policymakers. The study could not consider other types of banks such as regional rural banks and co-operative banks operating in India due to the unavailability of suitable and adequate data. The present study can be extended to the non-banking sector of the Indian economy. Finally, we conclude that the interrelationship among bank-specific, industry-specific, macro-economic factors and bank performance is robust across the sub samples formed on the basis of ownership, bank size, capitalization and time period. But the degree of the relationship varies across the subsamples.
Additional information
Funding
Notes on contributors
Neeraj Gupta
Neeraj Gupta has completed Ph.D. fromDepartment of Humanities and Social Sciences, Indian Institute of Technology Kharagpur, India. His areas of interest include security analysis, derivatives, corporate finance and business laws. Currently, he is working as Assistant Professor in the area of finance at Jaipuria Institute of Management, Indore, India. (Email- [email protected])
Jitendra Mahakud
Jitendra Mahakud is the Professor of Economics and Finance at the Indian Institute of Technology, Kharagpur, India. His areas of research and teaching include financial market and institution, financial management, corporate finance, financial econometrics, macroeconomics, and monetary economics. He has published more than 50 papers in leading national and international journals and co-authored a book entitled Financial Institutions and Markets: Structure, Growth and Innovations published by McGraw-Hill Education. (E-mail— [email protected])
Notes
1. “We have divided the banks into two categories, such as public sector and private sector banks, which include both domestic-owned private banks and foreign-owned private banks.”
2. ” The tercile approach is used to divide the full sample into large size and small size banks. Banks in the first tercile are considered as large size banks and banks in the third tercile are defined as small size banks.”
References
- Acaravci, S. K., & Çalim, A. E. (2013). Turkish banking sector’ s profitability factors. International Journal of Economics and Financial Issues, 3(1), 27–39. http://www.econjournals.com/index.php/ijefi/article/download/343/pdf
- Aduda, J., & Gitonga, J. (2011). The relationship between profitability and commercial banks in Kenya. Journal of Modern Accounting and Auditing, 7(9), 934–946.
- Akhavein, J. D., Berger, A. N., & Humphrey, D. B. (1997). The effects of megamergers on efficiency and prices: Evidence from a bank profit function. Finance and Economics Discussion Series 1997-9. Board of Governors of the Federal Reserve System (US).
- Al-Baidhani, A. M. (2015). Review of corporate governance bundle. Corporate Ownership & Control, 11(4), 236–241. https://doi.org/10.22495/cocv11i4c2p1
- Alexiou, C., & Sofoklis, V. (2009). Determinants of bank profitability: Evidence from the greek banking sector. Economic Annals, 54(182), 93–118. https://doi.org/10.2298/EKA0982093A
- Ali, K., Akhtar, M. F., & Ahmed, H. Z. (2011). Bank-specific and macroeconomic indicators of profitability - Empirical evidence from the commercial banks of Pakistan. International Journal of Business and Social Science, 2(6), 235–242.
- Al-Jafari, M. K., & Alchami, M. (2014). Determinants of bank profitability: Evidence from Syria. Journal of Applied Finance & Banking, 4(1), 17–45. http://www.scienpress.com/Upload/JAFB%2fVol%204_1_2.pdf
- Almaqtari, F. A., Al-Homaidi, E. A., Tabash, M. I., & Farhan, N. H. (2018). The determinants of profitability of Indian commercial banks: A panel data approach. International Journal of Finance and Economics, 24(1), 168–185. https://doi.org/10.1002/ijfe.1655
- Almazari, A. A. (2013). Capital adequacy, cost income ratio and the performance of Saudi Banks (2007–2011). International Journal of Academic Research in Accounting, Finance and Management Sciences, 3(4), 284–293. http://hrmars.com/hrmars_papers/Article_30_Capital_Adequacy,_Cost_Income_Ratio.pdf
- Almumani, M. A. (2013). Impact of managerial factors on commercial bank profitability: Empirical evidence from Jordan. International Journal of Academic Research in Accounting, Finance and Management Sciences, 3(3), 298–310. https://doi.org/10.6007/IJARAFMS/v3-i3/203
- AL-Omar, H., & AL-Mutairi, A. (2008). Bank-specific determinants of profitability: The case of Kuwait. Journal of Economic and Administrative Sciences, 24(2), 20–34. https://doi.org/10.1108/10264116200800006
- Ameur, I. G. B., & Mhiri, S. M. (2013). Explanatory factors of bank performance: Evidence from Tunisia. International Journal of Economics, Finance and Management, 2(1), 143–152.
- Anbar, A., & Alper, D. (2011). Bank specific and macroeconomic determinants of commercial bank profitability: Empirical evidence from Turkey. Business and Economics Research Journal, 2(2), 139–152.
- Andres, A. P., & Vallelado, E. (2008). Corporate governance in banking: The role of the board of directors. Journal of Banking and Finance, 32(12), 2570–2580. https://doi.org/10.1016/j.jbankfin.2008.05.008
- Angbazo, L. (1997). Commercial bank interest margins, default banking sector. International Journal of Banking and Finance, 21(1), 55–87. https://doi.org/10.1016/S0378-4266(96)00025-8
- Arellano, M., & Bond, S. (1991). Some tests of specification for panel data: Monte Carlo evidence and an application to employment equations. The Review of Economic Studies, 58(2), 277–297. https://doi.org/10.2307/2297968
- Arellano, M., & Bover, O. (1995). Another look at the instrumental variable estimation of error-components models. Journal of Econometrics, 68(1), 29–51. https://doi.org/10.1016/0304-4076(94)01642-D
- Athanasoglou, P., Brissimis, S., & Delis, M. (2008). Bank-specific, industry-specific and macroeconomic determinants of bank profitability. Journal of International Financial Markets, Institutions and Money, 18(2), 121–136. https://doi.org/10.1016/j.intfin.2006.07.001
- Athanasoglou, P., Delis, M., & Staikouras, C. (2006). Determinants in the bank profitability in the South Eastern European Region. Journal of Financial Decision Making, 2(1), 1–17. http://www.bankofgreece.gr/BogEkdoseis/Paper200647.pdf
- Athanasoglou, P. P., Brissimis, S. N., & Delis, M. D. (2005). Bank-specific, industry specific and macroeconomic determinants of bank profitability. Bank of Greece Working Paper No. 25.
- Athanasoglou, P. P., Daniilidis, I., & Delis, M. D. (2014). Bank procyclicality and output: Issues and policies. Journal of Economics and Business, 72(1), 58–83. https://doi.org/10.1016/j.jeconbus.2013.10.003
- Ayaydin, H., & Karakaya, A. (2014). The effect of bank capital on profitability and risk in Turkish banking. International Journal of Social Science, 5(1), 252–271.
- Badola, B. S., & Verma, R. (2006). Determinants of profitability of banks in Indian: A Multivariate Analysis. Delhi Business Review, 7(2), 79–88.
- Barajas, A., Steiner, R., & Salazar, N. (1999). Interest spreads in banking in Colombia 1974-96. IMF Staff Papers, 46(2), 196–224. https://doi.org/10.2307/3867667
- Barros, C. P., Ferreira, C., & Williams, J. (2007). Analysing the determinants of performance of best and worst European banks: A mixed logit approach. Journal of Banking and Finance, 31(7), 2189–2203. https://doi.org/10.1016/j.jbankfin.2006.11.010
- Batten, J., & Vo, X. V. (2019). Determinants of bank profitability-Evidence from Vietnam. Emerging Markets Finance and Trade, 55(6), 1417–1428. https://doi.org/10.1080/1540496X.2018.1524326
- Berger, A. (1995). The profit-structure relationship in banking-tests of market-power and efficient-structure hypotheses. Journal of Money, Credit & Banking, 27(2), 404–431. https://doi.org/10.2307/2077876
- Berger, A., DeYoung, R., Genay, H., & Udell, G. (2000). Globalisation of financial institutions: Evidence From cross-border banking performance. Brookings-Wharton Papers on Financial Services, 2000(1), 23–120. https://doi.org/10.1353/pfs.2000.0001
- Berger, A., & Humphrey, D. (1994), Bank scale economies, mergers, concentration, and efficiency: The U.S. experience, Center for Financial Institutions Working Papers 94-25, Wharton School Center for Financial Institutions, University of Pennsylvania.
- Berger, A. N., Hasan, I., & Zhou, M. (2010). The effects of focus versus diversification on bank performance: Evidence from Chinese banks. Journal of Banking & Finance, 34(7), 1417–1435. https://doi.org/10.1016/j.jbankfin.2010.01.010
- Bhatia, A., Mahajan, P., & Chander, S. (2012). Determinants of profitability of private sector banks in India. Indian Journal of Accounting, 42(2), 39–51.
- Bikker, J., & Hu, H. (2002). Cyclical patterns in profits, provisioning and lending of banks and pro-cyclicality of the new Basel capital requirements. BNL Quarterly Review, 55(221), 143–175. http://ojs.uniroma1.it/index.php/PSLQuarterlyReview/article/view/9907/9789
- Blundell, R., & Bond, S. (1998). Initial conditions and moment restrictions in dynamic panel data models. Journal of Econometrics, 87(1), 115–143. https://doi.org/10.1016/S0304-4076(98)00009-8
- Bolt, W., De Haan, L., Hoeberichts, M., Van Oordt, M. R., & Swank, J. (2012). Bank profitability during recessions. Journal of Banking & Finance, 36(9), 2552–2564. https://doi.org/10.1016/j.jbankfin.2012.05.011
- Bordeleau, E., & Graham, C. (2010), The impact of liquidity on bank profitability, Bank of Canada Working Paper No. 38.
- Bougatef, K. (2017). Determinants of bank profitability in Tunisia: Does corruption matter? Journal of Money Laundering Control, 20(1), 70–78. https://doi.org/10.1108/JMLC10-2015-0044
- Bourke, P. (1989). Concentration and other determinants of bank profitability in Europe, North America, & Australia. Journal of Banking and Finance, 13(1), 65–79. https://doi.org/10.1016/0378-4266(89)90020-4
- Cerci, G., Kandir, S. Y., & Onal, Y. (2012). Profitability analysis of banks: An Application on the Turkish banking industry. ISE Review, 13(1), 29–44. http://www.borsaistanbul.com/datum/imkbdergi/EN/ISE_Review_50.pdf
- Chiorazzo, V., Milani, C., & Salvini, F. (2008). Income diversification and bank performance: Evidence from Italian banks. Journal of Financial Services Research, 33(3), 181–203. https://doi.org/10.1007/s10693-008-0029-4
- Chowdhury, M. A. F., & Rasid, M. E. S. M. (2017). Determinants of performance of Islamic banks in GCC countries: Dynamic GMM approach. Advances in Islamic Finance, Marketing, and Management, 1(1), 49–80. https://doi.org/10.1108/978-1-78635-899-820161005
- Chronopoulos, D., Liu, H., McMillan, F., & Wilson, J. (2012). The dynamics of US Bank profitability. The European Journal of Finance, 21(5), 426–443. https://doi.org/10.1080/1351847X.2013.838184
- De Jonghe, O. (2010). Back to the basics in banking? A micro-analysis of banking system stability. Journal of Financial Intermediation, 19(3), 387–417. https://doi.org/10.1016/j.jfi.2009.04.001
- Demirguc-Kunt, A., & Huizinga, H. (1999). Determinants of commercial bank interest margins and profitability: Some international evidence. The World Bank Economic Review, 13(2), 379–408. https://doi.org/10.1093/wber/13.2.379
- Demirguc-Kunt, A., & Huizinga, H. (2010). Bank activity and funding strategies: The impact on risk and returns. Journal of Financial Economics, 98(3), 626–650. https://doi.org/10.1016/j.jfineco.2010.06.004
- DeYoung, R., & Roland, K. P. (2001). Product mix and earnings volatility at commercial banks: Evidence from a degree of total leverage model. Journal of Financial Intermediation, 10(1), 54–84. https://doi.org/10.1006/jfin.2000.0305
- DeYoung, R., & Torna, G. (2013). Non-traditional banking activities and bank failures during the financial crisis. Journal of Financial Intermediation, 22(3), 397–421. https://doi.org/10.1016/j.jfi.2013.01.001
- Dietrich, A., & Wanzenried, G. (2011). Determinants of bank profitability before and during the crisis: Evidence from Switzerland. Journal of International Financial Markets, Institutions and Money, 21(3), 307–327. https://doi.org/10.1016/j.intfin.2010.11.002
- Dietrich, A., & Wanzenried, G. (2014). The determinants of commercial banking profitability in low-, middle-, and high-income countries. The Quarterly Review of Economics and Finance, 54(3), 337–354. https://doi.org/10.1016/j.qref.2014.03.001
- Djalilov, K., & Piesse, J. (2016). Determinants of bank profitability in transition countries: What matters most? Research in International Business and Finance, 38(3), 69–82. https://doi.org/10.1016/j.ribaf.2016.03.015
- Eichengreen, B., & Gupta, P. (2012). The global financial crisis and Indian banks: Survival of the fittest? Working Papers 12/113. National Institute of Public Finance and Policy.
- Elsas, R., Hackethal, A., & Holzhäuser, M. (2010). The anatomy of bank diversification. Journal of Banking and Finance, 34(6), 1274–1287. https://doi.org/10.1016/j.jbankfin.2009.11.024
- Erhardt, L. N., Werbel, J. D., & Shrader, C. B. (2003). Board of director diversity and firm financial performance. Corporate Governance: An International Review, 11(2), 102–110. https://doi.org/10.1111/1467-8683.00011
- Fiordelisi, F., Marques-Ibanez, D., & Molyneux, P. (2011). Efficiency and risk in European banking. Journal of Banking and Finance, 35(5), 1315–1326. https://doi.org/10.1016/j.jbankfin.2010.10.005
- Flamini, V., Schumacher, M. L., & McDonald, M. C. A. (2009). The determinants of commercial bank profitability in Sub-Saharan Africa (No. 9-15). International Monetary Fund.
- Francis, M. E. (2013). Determinants of commercial bank profitability in Sub-Saharan Africa. International Journal of Economics and Finance, 5(9), 134–147. https://doi.org/10.5539/ijef.v5n9p134
- Gilbert, R. (1984). Bank market structure and competition. Journal of Money, Credit and Banking, 16(4), 617–660. https://doi.org/10.2307/1992096
- Goaied, M., & Bennaceur, S. (2001). The determinants of the Tunisian deposit banks’ performance. Applied Financial Economics, 11(3), 317–319. https://doi.org/10.1080/096031001300138717
- Goaied, M., & Bennaceur, S. (2008). The determinant of commercial bank interest margin and profitability: Evidence from Tunisia. Frontiers in Finance and Economics, 5(1), 106–130. http://www.ffe.esc-lille.com/papers/Vol5-1ms50Bennaceur.pdf
- Goddard, J., Molyneux, P., & Wilson, J. (2004a). Dynamics of growth and profitability in banking. Journal of Money, Credit and Banking, 36(6), 1069–1090. https://doi.org/10.1353/mcb.2005.0015
- Goddard, J., Molyneux, P., & Wilson, J. (2004b). The profitability of European banks: A cross-sectional and dynamic panel analysis. The Manchester School, 72(3), 363–381. https://doi.org/10.1111/j.1467-9957.2004.00397.x
- Gul, S., Irshad, F., & Zaman, K. (2011). Factors affecting bank profitability in Pakistan. The Romanian Economic Journal, 14(39), 61–87. http://www.rejournal.eu/sites/rejournal.versatech....101/guletal-je39.pdf
- Guru, B. K., Staunton, J., & Shanmugam, B. (2002). Determinants of commercial bank profitability in Malaysia. Journal of Money, Credit, and Banking, 17(1), 69–82.
- Heffernan, S., & Fu, M. (2008). The determinants of bank performance in China. Working Paper Series, WP-EMG-03-2008. Cass Business School, City University.
- Iannotta, G., Nocera, G., & Sironi, A. (2007). Ownership structure, risk and performance in the European banking industry. Journal of Banking and Finance, 31(7), 2127–2149. https://doi.org/10.1016/j.jbankfin.2006.07.013
- Jabbar, H. (2014). Determinants of banks profitability. IOSR Journal of Business and Management, 16(1), 109–113. https://doi.org/10.9790/487X-1614109113
- Jiang, G., Tang, N., Law, E., & Sze, A. (2003). Determinants of bank profitability in Hong Kong. Memorandum, Hong Kong Monetary Authority Research.
- Kaaya, I., & Pastory, D. (2013). Credit risk and commercial banks performance in Tanzania: A panel data analysis. Research Journal of Finance and Accounting, 4(16), 55–62. https://www.iiste.org/Journals/index.php/RJFA/article/view/8284/8645
- Kanas, A., Vasiliou, D., & Eriotis, N. (2012). Revisiting bank profitability: A semi-parametric approach. Journal of International Financial Markets, Institutions and Money, 22(4), 990–1005. https://doi.org/10.1016/j.intfin.2011.10.003
- Karimzadeh, M., Akhtar, S. J., & Karimzadeh, B. (2013). Determinants of profitability of banking sector in India. Transition Studies Review, 20(2), 211–219. https://doi.org/10.1007/s11300-013-0284-4
- Kosak, M., & Cok, M. (2008). Ownership structure and profitability of the banking sector: The evidence from the SEE region. Journal of Economics and Business, 26(1), 93–122. https://core.ac.uk/download/pdf/14397356.pdf
- Kosmidou, K., Pasiouras, F., & Tsaklanganos, A. (2005). Factors influencing the profits and size of Greek banks operating abroad: A pooled time-series study. Applied Financial Economics, 15(10), 731–738. https://doi.org/10.1080/09603100500107677
- Lee, C. C., & Hsieh, M. F. (2013). Beyond bank competition and profitability: Can moral hazard tell us more? Journal of Financial Services Research, 44(1), 87–109. https://doi.org/10.1007/s10693-012-0151-1
- Lee, J. Y., & Kim, D. (2013). Bank performance and its determinants in Korea. Japan and the World Economy, 27(3), 83–94. https://doi.org/10.1016/j.japwor.2013.05.001
- Lee, S. W. (2012). Profitability determinants of Korean banks. Economics and Finance Review, 2(9), 6–18.
- Lepetit, L., Nys, E., Rous, P., & TaraziBank, A. (2008). Bank income structure and risk: An empirical analysis of European banks.Journal of Banking & Finance.2007 2007 32.12 8.002 doi:10.1016/j.jbankfin.2007.12.002
- Li, F., & Zou, Y. (2014). The Impact of credit risk management on profitability of commercial banks: A study of Europe. Umea School of Business and Economics. http://www.diva-portal.org
- Lin, X., & Zhang, Y. (2009). Bank ownership reform and bank performance in China. Journal of Banking and Finance, 33(1), 20–29. https://doi.org/10.1016/j.jbankfin.2006.11.022
- Liu, H., & Wilson, J. O. S. (2010). The profitability of banks in Japan. Applied Financial Economics, 20(24), 1851–1866. https://doi.org/10.1080/09603107.2010.526577
- López-Gutiérrez, C., Sanfilippo-Azofra, S., & Torre-Olmo, B. (2015). Investment decisions of companies in financial distress. Business Research Quarterly, 18(3), 174–187. https://doi.org/10.1016/j.brq.2014.09.001
- Macit, F. (2012). Bank specific and macroeconomic determinants of profitability: Evidence from participation banks in Turkey. Economics Bulletin, 32(1), 586–595. http://www.accessecon.com/Pubs/EB/2012/Volume32/EB-12-V32-I1-P55.pdf
- Mamatzakis, E. C., & Remoundos, P. C. (2003). Determinants of Greek commercial banks profitability 1989-2000. Spoudai, 53(1), 84–94. http://sro.sussex.ac.uk/id/eprint/40071/
- Masood, O., & Ashraf, M. (2012). Bank-specific and macroeconomic profitability determinants of Islamic banks: The case of different countries. Qualitative Research in Financial Markets, 4(2/3), 255–268. https://doi.org/10.1108/17554171211252565
- Mathuva, D. M. (2009). The influence of working capital management components on corporate profitability: A survey on Kenyan listed firms. Research Journal of Business Management, 4(1), 1–11. doi: 10.3923/rjbm.2010.1.11
- Mercieca, S., Schaeck, K., & Wolfe, S. (2007). Small European banks: Benefits from diversification and the regulatory environment. Journal of Banking and Finance, 31(7), 1975–1998. https://doi.org/10.1016/j.jbankfin.2007.01.004
- Micco, A., Panizza, U., & Yanez, M. (2007). Bank ownership and performance. Does politics matter? Journal of Banking and Finance, 31(1), 219–241. https://doi.org/10.1016/j.jbankfin.2006.02.007
- Molyneux, P., & Thornton, J. (1992). Determinants of European bank profitability: A note. Journal of Banking and Finance, 16(6), 1173–1178. https://doi.org/10.1016/0378-4266(92)90065-8
- Muth, M., & Donaldson, L. (1998). Stewardship theory and board structure: A contingency approach. Corporate Governance: An International Review, 6(1), 5–28. https://doi.org/10.1111/1467-8683.00076
- Ndoka, S., & Islami, M. (2016). The impact of credit risk management in the profitability of Albanian commercial banks during the period 2005–2015. European Journal of Sustainable Development, 5(3), 445–452. doi: 10.14207/ejsd.2016.v5n3p445
- Nguyen, K. N. (2019). Revenue diversification, risk and bank performance of Vietnamese commercial banks. Journal of Risk and Financial Management, 12(3), 1–21 https://www.mdpi.com/1911-8074/12/3/138/pdf.
- Olson, D., & Zoubi, T. A. (2011). Efficiency and bank profitability in MENA countries. Emerging Markets Review, 12(2), 94–110. https://doi.org/10.1016/j.ememar.2011.02.003
- Ongore, V. O., & Kusa, G. B. (2013). Determinants of financial performance of commercial banks in Kenya. International Journal of Economics and Financial Issues, 3(1), 237–252. https://www.econjournals.com/index.php/ijefi/article/view/334
- Pasiouras, F., & Kosmidou, K. (2007). Factors influencing the profitability of domestic and foreign commercial banks in the European Union. Research in International Business and Finance, 21(2), 222–237. https://doi.org/10.1016/j.ribaf.2006.03.007
- Perera, A., & Wickramanayake, J. (2016). Determinants of commercial bank retail interest rate adjustments: Evidence from a panel data model. Journal of International Financial Markets, Institutions and Money, 45(3), 1–20. https://doi.org/10.1016/j.intfin.2016.05.006
- Perera, S., Skully, M., & Chaudhry, Z. (2013). Determinants of commercial bank profitability: South Asian evidence. Asian Journal of Finance & Accounting, 5(1), 365–380. https://doi.org/10.5296/ajfa.v5i1.3012
- Petria, N., Capraru, B., & Ihnatov, I. (2015). Determinants of banks’ profitability: Evidence from EU 27 banking systems. Procedia Economics and Finance, 20(15), 518–524. https://doi.org/10.1016/S2212-5671(15)00104-5
- Poposka, K., & Trpkoski, M. (2013). Secondary model for bank profitability management-test on the case of Macedonian banking sector. Research Journal of Finance and Accounting, 4(6), 216–225. https://www.iiste.org/Journals/index.php/RJFA/article/view/5666/5778
- Rachdi, H. (2013). What determines the profitability of banks during and before the international financial Crisis? Evidence from Tunisia. International Journal of Economics, Finance and Management, 2(4), 330–337.
- Ramadan, I. Z., Kilani, Q. A., & Kaddumi, T. A. (2011). Determinants of bank profitability: Evidence from Jordan. International Journal of Academic Research, 3(4), 180–191.
- Robin, I., Salim, R., & Bloch, H. (2018). Financial performance of commercial banks in the post-reform era: Further evidence from Bangladesh. Economic Analysis and Policy, 58(C), 43–54. https://doi.org/10.1016/j.eap.2018.01.001
- Saba, I., Kouser, R., & Azeem, M. (2012). Determinants of non-performing loans: Case of US banking sector. Romanian Economic Journal, 15(44), 125–136. http://www.rejournal.eu/sites/rejournal.versatech.ro/files/issues/2012-06-02/556/15-determinantsofnon-performingloanscaseofusbankingsector.pdf
- Saeed, M. S. (2014). Bank-related, industry-related and macroeconomic factors affecting bank profitability: A case of the United Kingdom. Research Journal of Finance and Accounting, 5(2), 42–50. https://www.iiste.org/Journals/index.php/RJFA/article/view/10678/10883
- Sastrosuwito, S., & Suzuki, Y. (2012). The determinants of post-crisis Indonesian banking system profitability. Economics & Finance Review, 1(11), 48–57.
- Shen, C. H., Chen, Y. K., Kao, L. F., & Yeh, C. Y. (2009). Bank liquidity risk and performance. Working Paper, Department of Finance, National University of Kaohsiung, 1–37.
- Short, B. K. (1979). The relation between commercial bank profit rates and banking concentration in Canada, Western Europe, and Japan. Journal of Banking and Finance, 3(3), 209–219. https://doi.org/10.1016/0378-4266(79)90016-5
- Singh, A., & Sharma, A. K. (2016). An empirical analysis of macroeconomic and bank-specific factors affecting liquidity of Indian banks. Future Business Journal, 2(1), 40–53. https://doi.org/10.1016/j.fbj.2016.01.001
- Smirlock, M. (1985). Evidence on the (non) relationship between concentration and profitability in banking. Journal of Money, Credit and Banking, 17(1), 69–83. https://doi.org/10.2307/1992507
- Staikouras, C., Mamatzakis, E., & Koutsomanoli, A. (2007). Operating performance of the banking industry: An empirical investigation of the south-eastern European region. South-Eastern Europe Journal of Economics, 5(2), 245–266. http://www.asecu.gr/Seeje/issue09/staikouras.pdf
- Staikouras, C. K., & Wood, G. E. (2004). The determinants of European bank profitability. International Business and Economics Research Journal, 3(6), 57–68. https://doi.org/10.19030/iber.v3i6.3699
- Stiroh, K. (2004). Diversification in banking: Is noninterest income the answer? Journal of Money, Credit and Banking, 36(5), 853–882. https://doi.org/10.1353/mcb.2004.0076
- Stiroh, K. J., & Rumble, A. (2006). The dark side of diversification: The case of US financial holding companies. Journal of Banking and Finance, 30(8), 2131–2161. https://doi.org/10.1016/j.jbankfin.2005.04.030
- Sufian, F. (2011). Profitability of the Korean banking sector: Panel evidence on bank-specific and macroeconomic determinants. Journal of Economics and Management, 7(1), 43–72. http://www.jem.org.tw/content/pdf/Vol.7No.1/03.pdf
- Sufian, F., & Chong, R. R. (2008). Determinants of bank profitability in a developing economy: Empirical evidence from Philippines. Asian Academy of Management Journal of Accounting and Finance, 4(2), 91–112. http://web.usm.my/journal/aamjaf/vol4-2-2008/4-2-5.pdf
- Sufian, F., & Habibullah, M. S. (2010). Determinants of bank profitability in a developing economy: Empirical evidence from Bangladesh. Journal of Business Economics and Management, 10(3), 207–217. https://doi.org/10.3846/1611-1699.2009.10.207-217
- Tan, Y. (2016). The impacts of risk and competition on bank profitability in China. Journal of International Financial Markets, Institutions & Money, 40(1), 85–110. https://doi.org/10.1016/j.intfin.2015.09.003
- Tan, Y., & Floros, C. (2012). Bank profitability and inflation: The case of China. Journal of Economic Studies, 39(6), 675–696. https://doi.org/10.1108/01443581211274610
- Tran, N. H., & Le, C. D. (2017). Financial conditions and corporate investment: Evidence from Vietnam. Pacific Accounting Review, 29(2), 183–203. https://doi.org/10.1108/PAR-07-2016-0066
- Tregenna, F. (2009). The fat years: The structure and profitability of the US banking sector in the pre-crisis period. Cambridge Journal of Economics, 33(4), 609–632. https://doi.org/10.1093/cje/bep025
- Trujillo-Ponce, A. (2013). What determines the profitability of banks? Evidence from Spain. Accounting and Finance, 53(2), 561–586. https://doi.org/10.1111/j.1467-629X.2011.00466.x
- Turgutlu, E. (2014). Dynamics of profitability in the Turkish banking industry. Ege Academic Review, 14(1), 43–52. http://www.onlinedergi.com/makaledosyalari/51/pdf2014_1_5.pdf
- Van Ommeren, S. (2011). An examination of the determinants of banks’ profitability in the European banking sector. Unpublished Master’s Thesis, Erasmus University Rotterdam.
- Vejzagic, M., & Zarafat, H. (2014). An analysis of macroeconomic determinants of commercial banks profitability in Malaysia for the period 1995–2011. Asian Economic and Financial Review, 4(1), 41–57. http://www.aessweb.com/download.php?id=2296
- Wahidudin, A., Subramanian, U., & Kamaluddin, P. (2013). Determinants of profitability - A comparative analysis of Islamic banks and conventional banks in ASEAN countries. 1–2. http://ssrn.com/abstract=2251602
- Wall, L. (1985). Why are some banks more profitable than others? Journal of Bank Research, 15(4), 240–256.
- Zimmerman, G. C. (1996). Factors influencing community bank performance in California. Economic Review-Federal Reserve Bank of San Francisco, 1(1), 26–40. http://www.frbsf.org/econrsrch/econrev/96-1/26-42.pdf