
 ?Mathematical formulae have been encoded as MathML and are displayed in this HTML version using MathJax in order to improve their display. Uncheck the box to turn MathJax off. This feature requires Javascript. Click on a formula to zoom.
Abstract
This study attempted to estimate degree of fiscal dominance by econometrically analysing degree of fiscal and monetary policies interdependence in Nigeria and South Africa. This is done to define the extent at which fiscal authority actions confine the monetary policy actions. The empirical confirmation offered in the study on the basis empirical findings showed that the degree of fiscal and monetary policies interdependence for both Nigeria and South Africa are 0.84 and 0.67. This shows that degrees of fiscal dominance in both economies are 0.16 and 0.33 respectively. The evidence shows that both economies are under low fiscal dominance, though Nigerian economy is seen to be under a lower fiscal dominance hypothesis when compared with South African economy. Therefore, the Nigerian monetary authority has greater freedom to fight inflation. However, the Nigerian economy still has a higher inflation than South Africa. The study concludes based on the empirical findings, that monetary policy authorities in Nigeria and South Africa should strive more to maintain the current level of their autonomy given their higher degree of fiscal and monetary policies interdependence. Current level of autonomy can be maintained by ensuring that the fiscal authority plans its intertemporal budget constraints such that current level of government outstanding debt and its interest would always be offset by future primary surpluses rather than seigniorage.
PUBLIC INTEREST STATEMENT
Understanding the extent of interdependence between fiscal and monetary policies is germane for efficient functioning of the monetary authority. This study investigated the extent to which the monetary policy authority’s actions are confined by those of the fiscal policy authority in Africa’s two largest economies. The findings showed South African monetary policy authority enjoys greater freedom than her Nigerian counterpart.
1. Introduction
The relationship between monetary and fiscal policies has been an important issue widely discussed in the macroeconomic literature (Fahr & Frank, Citation2010; Togo, Citation2007; Belke & Dreger, Citation2011; Arby & Hanif, Citation2010). Economists have come up with possible passages in which fiscal and monetary policies relate to each other and have come up with a measure of interdependence. It is worthy of note that the measure of the degree of interdependence between fiscal and monetary authorities in any economy ranges between zero and one (De Resende, Citation2007). Conventional studies on monetary policy have supposed a restricted influence for fiscal policy in affecting monetary policy effectiveness. It is often assumed that the duty of fiscal authority is to determine government’s budget, while the monetary authority is free to determine the nominal money supply or nominal interest rate (Barro, Citation1987; Sims, Citation1994; Creel & Le Bihan, Citation2006). The intrinsic connotation by such an assumption is that the monetary authority can manage inflation by means of its control on money supply. In other words, it is the monetary authority that determines seigniorage revenue delivered to the fiscal authority. Thus, monetary policy defines the level of prices, while fiscal policy ensures that the issued bonds are supported by the tax revenue. This scenario has been described as a monetary dominance (Leeper, Citation1991; Sargent & Wallace, Citation1981). Monetary policy that operates in this framework is much more effective because it has the backing of fiscal policy for its monetary targets. In such a situation, inter-temporal government budget constraint is such that current fiscal deficit is equal to discounted value of future surpluses (Keen & Wang, Citation2013). Hence, there is no connection between fiscal deficits and monetary growth and subsequently inflation. Consequently, the degree of monetary-fiscal policies interdependence, often denoted as in the literature, would be
and hence fiscal dominance degree is 0. The fiscal authority could be said to back all debt through the control of current and future surpluses to satisfy the government’s intertemporal budget constraints (Sanusi & Akinlo, Citation2016).
Similarly, another means by which fiscal and monetary policies relate deals with the condition in which fiscal policy is active and a monetary policy is inactive (Sims, Citation1994). A commonly described situation in the literature is when fiscal authority is completely irresponsive to monetary policy. As a result, fiscal authority does not adjust taxes nor expenditure (both at current period and in future) to variations in the outstanding debt, and as such monetary authority has to back fully all the government’s debt. This position has been widely described as fiscal dominance (Aiyagari & Gertler, Citation1985, p. 22; Favero & Monacelli, Citation2003, p. 45; Nawaz et al., Citation2012, p. 154; Xiong, Citation2012, p. 515; Sargent & Wallace, Citation1981; De Resende, Citation2007:2; Sanusi & Akinlo, Citation2016). In this situation, the measure of degree of interdependence between fiscal and monetary authority, would be 0, and as such fiscal dominance is 1. An amazing characteristic of fiscal dominance is that monetary policy is made subject to fiscal policy. This implies that if monetary policy is subordinate to fiscal policy, a fiscal deficit would be positively correlated with increase in money supply, in other words, monetary growth (Gallo & Otranto, Citation1998; Us, Citation2004; Tanner & Ramos, Citation2002). In other words, positive long-run inflationary impact of money supply can be attributed to fiscal dominance (Jalil et al., Citation2013). However, in reality, the measure of degree of fiscal policy and monetary policy interdependence is hardly
nor
. Put differently, the real-life possibilities lie between the two values. By implication, fiscal authority in reality does not fully back all the government debt as monetary authority is made to be subject to a fraction of the debt. In other word, every economy experiences fiscal dominance. It is however the extent or degree of fiscal dominance that undermines the efficiency and effectiveness of monetary study.
Most of the available studies in the literature have either investigated the presence of fiscal dominance or monetary dominance (Trenovski & Tashevska, Citation2015; Sanusi & Akinlo, Citation2016). Existing studies in the literature have focused mainly on determination of incidence and or-else of fiscal dominance. Studies conducted to determine the quantitative measure of degree of fiscal dominance are quite scanty and unavailable in Nigeria and South Africa. It was De Resende and Rebei (Citation2008) that first carried out the quantitative measure of degree of fiscal dominance in a full fledge specified structural models using Dynamic Stochastic General Equilibrium (DSGE). Existing literature have been accused of lacking adequate empirical tests and merely estimate reduced form restrictions from non-micro founded models or just estimation of single equation (De Resende & Rebei, 2008). Studies on the quantitative measure of degree of fiscal dominance are not available in Nigeria and South Africa as most studies have mainly examined the interactions among monetary and fiscal variables. This study would be contributing to scarce empirical studies on the analysis of the measure of degree of fiscal dominance in the literature at large.
Meanwhile, empirical research efforts on estimation of degree of fiscal dominance which measure the independence of central bank was stirred by traditional economic argument that, if apex bank is free from political pressure interference, the attainment of a lower and more stable inflation would be possible. In other words, an economy with high degree of fiscal and monetary policies interdependence would experience a lower inflation rate. Bade and Parkin (Citation1985) came up with the first empirical study to examine the association between the degree of fiscal and monetary policies interdependence. They employ annual data for 12 Organization for Economic Cooperation and Development (OECD). Bade and Parkin (Citation1985) submits that the degree of fiscal and monetary policies interdependence was a noteworthy cause of inflation in the selected countries. Consequently, other studies were motivated in the literature to define the validity or otherwise of the argument that high degree of fiscal and monetary policies interdependence is connected with lower inflation. Alesina (Citation1988) and Alesina and Summers (Citation1993) used the method of Bade and Parkin (Citation1982) and included more countries. They established that an opposite relationship between average inflation rates and the level of the degree of fiscal and monetary policies interdependence.
Recent empirical efforts have been largely divergent on the validity of the hypothesis of lower degree of fiscal dominance being associated with lower inflation. For instance, Ornellas and Portugal (Citation2011) found lower degree of fiscal domiance in the Brazilian economy than US and Canadian economies but inflation was found to be higher in Brazil during the period under consideration. In other words, Ornellas and Portugal (Citation2011) could not find evidence of low degree of fiscal dominance being associated with low inflation rate. Investigation of the validity or otherwise of the proposition that low degree of fiscal dominance being associated with lower inflation rate has not received considerable research efforts from Africa. As a matter of fact, no empirical efforts could be found on this subject matter for Nigerian and South African economies.
This study also contribute to discussion on this proposition by examining the average inflation rates in both Nigeria and South African economies in the light of the degree of fiscal dominance. The remaining discussion is organized as follows: section two presents the overview of fiscal policy indicators in both Nigeria and South Africa. Section three presents the research method while section four presents and discusses the results. The last section concludes the results.
2. Overview of fiscal policy indicators
2.1. Nigeria
Nigeria’s economy has remained perpetually undiversified from the oil boom days. The greater share of exports and government revenue has consistently depended on oil (Okonjo-Iweala, Citation2011). Expenditure of government in Nigeria has been fluctuating and highly unstable. The volatility in government expenditure could be associated to the fact that spending of government has been increasing with increase in oil prices and revenue, until 2014 and 2015 declines in oil prices. Succeeding administrations in Nigeria have continuously recorded high expenditure during oil boom. The country’s loose fiscal policy and fiscal indiscipline aggravated the volatility in prices and revenue. Government revenues from oil and spending increased as oil prices increased (Okonjo-Iweala, Citation2011).
As a result of the fluctuation of expenditure, the fiscal stance of government of Nigeria have been largely in deficits with the exception of 1970s when fiscal positions were surpluses (Sanusi & Akinlo, Citation2016). The total budget surplus as a percentage of GDP fluctuated from only 1.5 percent in 1973 to 9.8 percent in 1974 (Okonjo-Iweala, Citation2011; Sanusi & Akinlo, Citation2016). The recorded surpluses of the early 1970s were truncated by decrease in oil prices at the global market. The total deficit-GDP ratio rose to 7.8 percent in 1978 from 2.0 percent in 1975 because of the inability of the government to adjust its expenditure in response to the declining oil revenue (National Bureau of Statistics, Citation2015).
Capital and recurrent of the federal government were further spiked in the 1980s by the execution of programmes like creation of state and increase in wage (Oko, Citation2001). The newly created institutions required grants and important infrastructures to kick off their operational activities. The resultant effect of this is increase in deficit by up to 5.7 percent of GDP in 1986, and 1993 as well (Ayodele & Falokun, Citation2003). As a result of the falling oil revenue, the gap between declining oil revenues and rising expenditures were financed by means of foreign borrowing and central bank’s interventions. Pressures were mounted on the government to cut expenditure because of the unpleasant effects of both sources of financing deficits (Sanusi & Akinlo, Citation2016). Financing of the most of the capital expenditures and other infrastructures were halted due to paucity of funds (KPMG Reports, Citation2015).
The return of democratic system in 1999 marked the beginning of another period high expenditures commonly characterised democratic system of government. The oil sector of the economy was faced with other challenges in 2014 with average daily production falling to 2.2mbpd as against the budget bench mark of 2.38 mbpd. On the average, the sector grew only in the first quarter by 5.14% while decline of 6.6 percent and 3.6 percent were recorded in the second and third quarters respectively (DMO, Citation2015).
The GDP growth rate was projected to be 0.5 percent for 2015 because of the falling prices of oil and challenges of production. An aggregate expenditure of N4.358 trillion was specified in the 2015 budget. This was 8 percent less than the amount for 2014 (DMO, 2015). The more worrisome situation was that recurrent expenditure rose by 6.5 percent while capital expenditure declined by 43 percent. Dejectedly enough, amount expected to expend on debt servicing was proposed to increase. More specifically, debt servicing was proposed to increase by 32.4 percent as against the 20.3 percent in the 2014 budget estimate.
Conclusively, the deficits’ profile of Nigeria has got to an alarming level. The government of Nigeria has been incurring deficits since 1967. The deficits have persistently been increasing and the instant effects are damnable. For example, the external debt size as at 2015 was put at USD60billion. Nigeria’s external debt rose by 11.77 USDbn between mid-2015 and the mid-2018, (DMO, Citation2018). Unfortunately, an assurance that it might decline in subsequent years is quite dim given the manner the current (President Buhari led government) administration is borrowing.
2.2. South Africa
At the inception of democracy in 1994, the economy performance and indicators were frail and crisis dominated (South African Act of Parliament, Citation1994). The budget deficit was said to be historically high in 1994 though with limited exposure to foreign debt (Department of Finance, Citation1996). The limited exposure to foreign debt was as a result of restricted access to international capital markets prior 1994 (Department of Finance, 1996). The overriding goal of fiscal policy has been to attain and sustain a progressive decline in the budget deficit, reduced government expenses (Department of Finance, 1996). Investment spending was also projected to increase.
Budget deficit that could not be sustained implied cost of borrowing would increase with paucity of funding for essential government programs. However, the budget balance became better as deficit fell 4.8 percent of GDP in 1994 to 0.5 percent by 2005 (IMF, Citation2010). The aftermath of budget deficits of the subsequent years made it possible for government to raise her spending without resulting to borrowing. This was partly sequel to improved tax revenue collection. During the worsening economic crisis of 2009, the debt of government increased seriously (Industrial Development Corporation, Citation2013). Government had to borrow more in order to finance the increased fiscal deficit.
The economy incurred another huge deficit after 2008/09 and the ratio of debt and GDP was 36.3 percent by 2012/13 (Industrial Development Corporation, Citation2013). After 2000s, government had adopted a counter-cyclical stance. Within the framework of counter-cyclical stance, infrastructural investments, human capital investments, discouragement of importation were seen as important factor for accelerating growth (International Budget Partnership, Citation2012). The cyclical stance includes stabilization of expenditures in order to stimulate growth and development (International Budget Partnership, 2012). The level of debt was believed to be viable with various measures being adopted. Consequent upon steady and good budgetary policies, South Africa was able to explore global bond markets with minimum sovereign risk spreads. South Africa was rated second among about 90 countries surveyed in 2012 in terms of transparency and accountability of budget processes (International Budget Partnership, 2012). Nevertheless, recent rating has not been impressive due to slow growth, increased debt, current account problem and associated economic drawback of Covid-19 pandemic.
3. Model specification
In order to estimate the degree of fiscal dominance in the Nigerian and South African economies, the following model procedures consist of the private and the government sectors.
3.1. Private sector
The economy is characterized by homogeneous consumers with infinite horizon and perfect foresight about the future. The representative consumer aims at:
where ∈ [0,1] is the subjective discount factor and
is firmly increasing and concave in all arguments. It satisfies the Inada conditions and twice differentiable. Note that in every period, consumer chooses consumption
, labour,
and the immediate next- period holdings of capital
, money
and nominal one government debt
. The aggregate price is denoted by
.
The real money balances are included to show that the utility function depicts the ease of using money in implementing transactions. Because this model is made up of government liabilities, the study follows Woodford (Citation1995) in understanding as the holding of the monetary base by the consumer. The model assumes instantaneous utility function that is both logarithmic and inseparable:
Where and
are parameters that capture the proportional importance of real money holdings and leisure. The consumer’s maximising constraint is subject to a no-Ponzi game condition and to the sequence of budget constraint in
Where is the lump-sum tax,
is the gross inflation denoted by
,
is the nominal interest rate on debt which is determined in previous period
and paid in period in
,
is the wage rate, and
is the return on capital between periods
and
. In equilibrium, the absence of arbitrage profits will require
to equal the real gross interest rate
. The first-order conditions for the representative of the consumer’s constraints function:
EquationEquation (4)(4)
(4) represents the Euler equations for consumption and EquationEquation (5)
(5)
(5) specifies demand for money as a function of consumption and the money’s return. These two conditions are the essential requirements to derive the study model’s implications for the total price level.
3.1.1. Government
Government spends an exogenous amount of resources, in every fiscal period. Government expenditures could be financed by imposition of lump-sum tax
, or by issuing money
, and by increasing total debt
. The government is also faced with a no-Ponzi- game situation and to a active budget constraints.
If EquationEquation (4.12)(4)
(4) is iterated forward, assuming that government’s no—Ponzi game condition denotes the intertemporal budget constraints, then:
Where =
is the
periods—ahead discount factor, and
,
and
are the present value of receipts from tax, seigniorage revenue, and expenditure of government respectively. It is assumed that present value of government’s budget constraint holds with equality. The government follows a long run fiscal rule that requires itself to generate large adequate primary surpluses
backing of fiscal policy) to back or finance a constant proportion of the currently outstanding debt. Assuming a sequence of prices
and primary stock of nominal debt
,
backing of fiscal policy is a sequence
so that for all
:
Where ∈ [0,1]. In other words, the fiscal rule of government is planned such that a constant fraction of
of the outstanding debt of government, including the interest payments, is financed or backed by the present discounted value of current and future primary surpluses. Consequent upon the fulfilling the government intertemporal budget constraints, then EquationEquation (8)
(8)
(8) is written as:
By implication, since ∈ [0,1], EquationEquation (8)
(8)
(8) connotes that a constant fraction
of the current outstanding debt is backed or financed by both present discounted value of current and future seigniorage revenue. The likely fiscal regimes are connoted by the fraction of
of the debt that is backed by the primary surplus. Since
∈ [0,1], a set that is continuum and restricted by two polar cases is obtained as follows:
Case (1): where all the debt of government is financed by the current value of the primary surplus. Under this situation, the fiscal controller is completely dedicated to varying its flow of surplus so that it is in total agreement with the current value of the issued bonds. As earlier stated, this situation refers to a monetary dominance (De Resende, Citation2007).
Case (2): where it is evident that the total debt is paid by the monetary authority. Under this arrangement, the principal and interests of a newly issued bond is paid by means of seigniorage. By implication, the fiscal authority is insensitive to monetary policy such that government taxes and expenditures do neither react nor respond to changes in the government’s debt stock. This is known as fiscal dominance (Aiyagari & Gertler, Citation1985; De Resende, Citation2007).
It is possible to see that parameter shows the preferences of the government as regards the finance of the debt. Thus, the fiscal strategy in is a rule that can parameterise the conduct of the government. The parameter
to be estimated in this study is the degree of fiscal and monetary policy interaction or interdependence. The value of the parameter
is the value that arises from the interaction between fiscal and monetary authorities in a steady organized set up.
3.2. Equilibrium
The equilibrium for this economy is defined in such a way that it corresponds to a price system that allocate resources amongst a representative consumer, firm and government policy. Both consumer and firm representative aim at maximizing their constraints given the specific government policy. Meanwhile, government budget is constrained by the price system and the choices of firms and consumers. The equilibrium systems also mean the market clearing system (De Resende, Citation2007).
The price level is determined by the equilibrium in the money market as:
From EquationEquation (4.12)(4)
(4) , money supply can be written as:
Following the equilibrium condition in EquationEquation (9)(9)
(9) and money demand EquationEquation (10)
(10)
(10) , EquationEquation (11)
(12)
(12) yields
By means of the recursive nature of the Euler EquationEquation (4.10)(4)
(4) to find expression for the infinite sum,
, in terms of current consumption and algebra process yields:
EquationEquation (4.17)(4)
(4) defines the total price level as being influenced by consumption and of the beginning lag one period stocks of money and debt. Aiyagari and Gertler (Citation1985) used a similar expression for the price level. Alternatively, since
, the price level can be written as a function of end of period stocks of money and debt:
EquationEquations (12)(12)
(12) and (Equation13
(13)
(13) ) are somewhat similar, but empirical analysis of EquationEquation (13)
(13)
(13) does not need interest rate data. Irrespective of either of the two equation, either of the models imply that price level depends not only on stock of money, but rather the proportion of outstanding debt that is financed by printing of money which is the degree of interdependence between monetary policy and fiscal policy denoted as
Consequently, in order to obtain the estimate of the degree of fiscal dominance , EquationEquation (13)
(13)
(13) can be written as:
Where denotes the nominal private consumption. The empirical equivalent of EquationEquation (15)
(15)
(15) can then be written as:
Where is an intercept,
=
,
=
It should be noted that is recognised from the coefficient on the stock of debt. Since all the variables
and
are endogenous in this model, the OLS estimation of EquationEquation (15)
(15)
(15) produce biased and inconsistent parameter estimates under condition of covariance-stationary. However, if the measures of
and
are I(1), EquationEquation (15)
(15)
(15) presents co-integrating relationship, consequently, EquationEquation (15)
(15)
(15) produces super-consistent estimates (Phillips & Durlauf, Citation1986).
This approach is superior to the other two approaches that can be used in obtaining the degree of fiscal and monetary policies interdependence because it does not require the computation of the present discounted values of and
that require the infinite future values for taxes and government expenditure. In order to estimate the EquationEquation (15)
(15)
(15) , the study makes use of the DOLS method proposed by Stock and Watson (Citation1993). The dynamic OLS (DOLS) version of EquationEquation (15)
(15)
(15) is given as:
Where for
and
are constants coefficients.
3.3. Technique of analysis and data sources
Both descriptive statistics and econometric techniques of data analysis were employed. Dynamic Least Square (DOLS) technique suggested by Stock and Watson (Citation1993) is adopted to estimate EquationEquation (16)(16)
(16) . Data on consumption, inflation and outstanding government debt were employed. The data were obtained from World Development Indicator. Time series data from the first quarter of 1981 to the last quarter of 2018 were sourced from World Development Indicators.
4. Empirical results
4.1. Descriptive statistics
It is customary to carry out descriptive statistics of the variables before the econometrics analysis are done. Variables under investigation are nominal consumption expenditure (CONS), money supply (MS) and inflation rate (INF).
Table indicate that the variables used in estimation process for Nigeria and South Africa respectively display a high level of internal consistency within the maximum and the minimum values of these variables. In addition, the variables have a relatively low standard deviation which indicates that the variances of the variables are not unnecessarily large. The statistics of skewness and kurtosis offer important information on the symmetry of the probability distribution of time series and the thickness of the tails of these distributions, respectively. The skewness and kurtosis also show that the variances of the variables are minimal.
Table 1. Summary statistics
The Jarque–Bera statistics measures the normality properties of the data. At one percent level of significance, the Jarque–Bera statistics of each variable accepts the null hypothesis of the normality. This is further confirmed by the nearness of the mean and median values of each of the two series. The closer the mean and the median of the two variables, the greater the probability that such series will be normally distributed. This is the case in Table .
4.2. Unit root test results
The unit root results considered at both levels and 1st difference are presented in Tables and for Nigerian and South African economies respectively. By means of ADF and PP techniques, all the variables were non-stationary at levels, because the t-statistic for each of the variables is less than the critical values at 5% level of significance as suggested by insignificance of the variables at their levels. The variables were then examined at first difference. This means the null hypothesis that the variables are I (1) was investigated. The results showed that first differencing would make the variables to be stationary at 5% significance level.
Table 2. Unit root test for the variables in level and 1st difference (Nigeria)
Table 3. Unit root test for the variables in level and 1st difference (South Africa)
4.3. Co-integration test results
The results of Johansen co-integration test for Nigeria and South Africa are presented respectively in Tables and . From Tables and , there exists a co-integration relationship between monetary base, government debt and consumption in Nigeria and South Africa. The presence of co-integration relationship was also established using Philips & Ouliaris co-integration technique which is available in the software R, in package Urca. The results of Philips & Ouliaris are presented for Nigeria and South Africa in Tables and respectively. Because the test statistic values are greater than critical values as can be seen in Tables and , the null hypothesis of no co-integration is not accepted. Thus, it is concluded that there is occurrence of co-integration relationship.
Table 4. Co-integration test results (Nigeria)
Table 5. Co-integration test results (South Africa)
Table 6. Philips and Ouliaris co-integration test results
Table 7. Philips and Ouliaris co-integration test results
The results of co-integration are particularly important and of high significance because it enables the equilibrium money market to be empirically characterised as a co-integrating relation. In other words, if the individual series can be said to be nonstationary processes, the behavioural pattern and model constraints means that the combination of these variables should be stationary. Consequently, dynamic least square (DOLS) produces a super-consistent estimate of the parameter that gives the degree of the interdependence between fiscal and monetary policies interactions.
4.4. Estimate of structural parameters using DOLS
The degree of fiscal and monetary policies interdependence which is otherwise a measure of central bank independence is obtained by estimating EquationEquation (15)(15)
(15) using dynamic OLS (DOLS). The DOLS version of EquationEquation (15)
(15)
(15) is expressed in EquationEquation (16)
(16)
(16) . The econometric strategy of the DOLS requires that the variables in the estimated model be I(1) and have a co-integrating relationship. Having used the necessary unit root tests and co-integration tests to establish and confirm both conditions, the results of structural parameters estimates are presented in Table . The results show that the degree of fiscal and monetary interdependence in Nigeria is 0.84 while it is found to be 0.67 in South African economy. This implies that degree of fiscal dominance is 0.16 in Nigeria while it is estimated to be 0.33 in South Africa. Recall that when the degree of fiscal and monetary policies interdependence,
is 1, all the government debt is backed or financed by the current value of the primary surplus (degree of fiscal dominance will be 0) and when it is found to be 0 (degree of fiscal dominance will be 1), the whole debt is paid by the monetary authority.
Table 8. Degree of fiscal and monetary policies interdependence in Nigeria & South Africa (DOLS MODEL)
Since the degree of fiscal and monetary policies in both Nigeria and South Africa is greater than 0.5 and closer to one, it implies that in coordination of fiscal and monetary policies in both countries, the central bank is more active and a first mover. It connotes that monetary authorities in both countries fixed their policies ahead and enforce discipline on fiscal authorities. This discipline connotes that fiscal authority would follow a sequence of primary surpluses and debt that is steady or consistent with the sequence of monetary aggregates supplied in both economies by the monetary authority. This submission conforms to the findings by Castro et al. (Citation2003) and Fischer et al. (Citation2002). Also, since the degree of fiscal and monetary policies interdependence in both Nigeria and South Africa is closer to one than zero, this implies that hypothesis of fiscal dominance would be quite low or near complete absence in both economies. This is consistent with empirical findings by Sanusi and Akinlo (Citation2016).
On the other hand, the results show that, on average, about 84% and 67% of government debt is backed up by fiscal authority in Nigeria and South Africa while the remaining percentage is accommodated by monetary authority. Put differently, the empirical findings show that, on average, greater percentage of government debt is backed up by fiscal authority in the Nigerian and South African economy, while the lower percentage is accommodated by monetary authority. From the analysis, the extent to which monetary authority activities are influenced by fiscal authority is found to be higher in the South African economy than in Nigeria. This implies that fiscal authority responds more to current levels of debt in Nigeria through raising of revenue to increase the future primary surplus than in the case of South African economy.
However, Sargent and Wallace (Citation1981) and Aiyagari and Gertler (Citation1985) argued that the degree of fiscal and monetary policies interdependence should be higher in developed economies than developing economies. Consequently, it would be naturally expected that the degree of fiscal and monetary policies interdependence would be higher in South Africa than Nigeria given the higher level of development in South Africa. The empirical findings from this study did not substantiate the position of Sargent and Wallace (Citation1981) and Aiyagari and Gertler (Citation1985). Nevertheless, the empirical findings are consistent with Castro et al. (Citation2003) who reported higher degrees of fiscal and monetary policies interdependence in Austria than France and Germany.
4.5. Analysis of trend of inflation in respect to degree of fiscal dominance
Having determined the degree of fiscal and monetary policies interdependence, the next task is to analyse the trend of inflation in Nigeria and South Africa in the light of the estimated degree of fiscal and monetary policies interdependence. This becomes pertinent following some theoretical and empirical arguments on the degree of fiscal and monetary policies interdependence and inflationary trend. Kydland and Prescott (Citation1977), Barro and Gordon (Citation1983), and Rogoff (Citation1985) articulated this theoretical position, while some empirical evidence is provided by Bade and Parkin (1982), Grilli et al. (Citation1991) Alesina and Summers (Citation1993). They argued that a higher degree of fiscal and monetary policies interdependence is associated with lower levels of inflation. Put differently, a lower degree of fiscal dominance is associated with lower level of inflation.
The trends of inflation in both Nigeria and South African economies are contained in Figures and respectively. By looking at the vertical-axis of both Figures 5.1 and 5.2, it is clear that inflation has higher frequency in Nigeria than South Africa. This simply suggests higher inflation trends in Nigeria compared to South Africa under the study period.
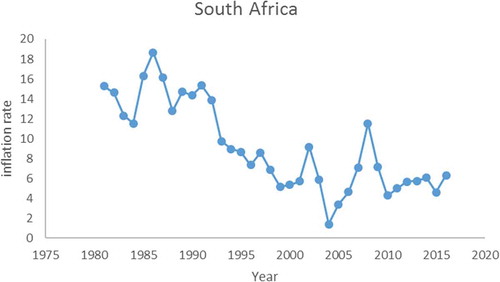
It is clear from the graphs that the inflation rate has been consistently higher in the Nigerian economy than in the South African economy. Nigeria recorded more double-digit inflation rates than South Africa. South Africa recorded double-digit inflation rate from 1981 until 1992. From 1993, South Africa began to record annual single-digit inflation rate and the annual inflation was mostly falling except for a few years such as 1997, 2002, 2007 and 2008 in which the country experienced a sharp rise in annual inflation rate. The rise in annual inflation rate in 2007 and 2008 could be largely attributed to global financial crisis which affected most of the emerging economies.
On the other hand, annual inflation rate in Nigeria under the study period has been largely double-digits. Nigeria recorded several episodes of double-digit inflation and few of these episodes of double-digit inflation were exceptionally high such as 50% between 1993 and 1994. However, this is an outlier as it could be mainly attributed to unstable and unfavourable macroeconomic environment created by political and governance crisis experienced during the military era, which plunged the economy into serious and deep crisis. Taking average of inflation rates under the study period, average inflation rate in Nigeria is 19.6% while it is 9.1% in South Africa. This means that on average, inflation rate in Nigeria is higher than South Africa.
Turning to theoretical and empirical arguments that higher degrees of fiscal and monetary policies interdependence are associated with lower levels of inflation, this position is consistent with the evidence from the South African economy. It can be seen that the degree of fiscal and monetary policies interdependence is 0.67, which is closer to one than zero. It shows that the South African economy is not injected into a fiscal dominance environment. This suggests that the central bank in South Africa enjoys a measure of independence, which in turns translates to a moderate inflation rate in the country, as the annual inflation rate in South Africa has been largely single digit since the end of the apartheid era. This is consistent with several other empirical findings in the literature such as Alesina and Summers (Citation1993), Fratianni and Spinelli (Citation2001), and Leeper (Citation1991) Sargent & Wallace (981) and Xiong (Citation2012).
However, empirical findings suggest that though Nigeria has higher degree of fiscal and monetary policies interdependence than South African economy, average inflation rate in Nigeria is high. This empirical finding does not support the position of Alesina and Summers (Citation1993) among others. This result does not find evidence of low inflation being associated with higher degrees of fiscal and monetary policies interdependence. The empirical results corroborate the findings by Ornellas and Portugal (Citation2011). Ornellas and Portugal (Citation2011) found higher degree of fiscal and monetary policies in Brazilian economy than US and Canadian economies but inflation was found to be higher in Brazil during the period under consideration.
One possible deduction from high levels of inflation in Nigeria during the study period, despite lower level fiscal dominance as implied by a higher degree of fiscal and monetary policy interdependence is that inflation in Nigeria is largely non- monetary. In other words, inflation in Nigeria during the study period has been driven by factors other than increased money supply. Factors such as weak productive base, low export, high levels of importation of already inflated commodities from overseas, political instability and structural rigidities among others could be responsible for high level of inflation in Nigeria despite a low-level fiscal dominance.
Figure 1. Inflationary trend in Nigeria.
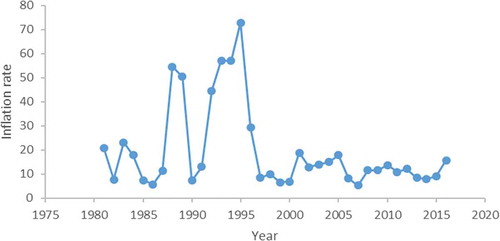
Figure 2. Inflationary trend in South Africa.
5. Conclusion
This study attempted to analyse econometrically the fiscal and monetary policies interdependence in Nigeria and South Africa in order to define the extent at which fiscal authority actions confines the monetary authority. The empirical confirmation offered in the study on the basis empirical findings showed that the degree of fiscal and monetary policy is high for both Nigeria and South Africa. The evidence shows that both economies are under low fiscal dominance though Nigerian economy is seen to be under a lower fiscal dominance hypothesis when compared with South African economy as degree of fiscal and monetary policy interdependence is higher in Nigeria than South Africa. Therefore, the Nigerian monetary authority has greater freedom to fight inflation. However, the Nigerian economy still has a higher inflation than South Africa. The study finds that the hypothesis of higher degree fiscal and monetary policies interdependence being associated with lower inflation could not be substantiated.
The study concludes based on the empirical findings, that monetary policy authorities in Nigeria and South Africa should strive more to maintain the current level of their autonomy given their higher degree of fiscal and monetary policies interdependence. Current level of autonomy can be maintained by ensuring that the fiscal authority plans its intertemporal budget constraints such that current level of government outstanding debt and its interest would always be offset by future primary surpluses rather than seigniorage. The productive base of Nigeria needs to be awakened as is almost moribound in terms of performance. This can be done through elimination of various structural rigidities in Nigerian economy, provision of adequate and modern infrastructure such as good roads, power supply which aid productive activities, discouragement of importation of already inflated products into the country and tax concessions to producers of essential commodities. Meanwhile, though the average level of inflation in South Africa is lower than that of Nigeria, South African inflation rate can still be brought lower given the degree of fiscal and monetary policies interdependence by also further strengthening the productive base of the economy.
Additional information
Funding
Notes on contributors
Kazeem Abimbola Sanusi
Kazeem Abimbola Sanusi is at present a research fellow at University of Johannesburg, South Africa. His research interests include nonlinear models, financial economics, and fiscal and monetary policies.
References
- Aiyagari, R., & Gertler, M. (1985). The backing of government bonds and monetarism. Journal of Monetary Economics, 16(1), 19–17. https://doi.org/10.1016/0304-3932(85)90004-2
- Alesina, A. (1988). Macroeconomics and politics. NBER Macroeconomics Annual, 3, 13–52. https://doi.org/10.1086/654070
- Alesina, A., & Summers, L. H. (1993). Central bank independence and macroeconomic performance: Some comparative evidence. Journal of Money, Credit, and Banking, 25(2), 151–162. https://doi.org/10.2307/2077833
- Arby, M. F., & Hanif, M. N. (2010). Monetary and fiscal policies coordination: Pakistan’s experience. Munich Personal RePEc Archive. https://mpra.ub.uni-muenchen.de/24160/1/MPRA_paper_24160.pdf
- Ayodele, A., & Falokun, G. (2003). The Nigerian economy: Structure and pattern. Lagos University Printoteque Press.
- Bade, R., & Parkin, M. (1982). Central bank laws and inflation-A comparative analysis. University of Western Ontario https://www.aeaweb.org/conference/2013/retrieve.php?pdfid=211
- Bade, R., & Parkin, M. (1985). Central bank laws and monetary policy (Unpublished manuscript). University of Western Ontario.
- Barro, R. J. (1987). Government spending, interest rates, prices, and budget deficits in the United Kingdom, 1701–1918. Journal of Monetary Economics, 20(2), 221–247. https://doi.org/10.1016/0304-3932(87)90015-8
- Barro, R. J., & Gordon, D. B. (1983). Rules, discretion and reputation in a model of monetary policy. Journal of Monetary Economics, 12(1), 101–121. https://doi.org/10.1016/0304-3932(83)90051-X
- Belke, A., & Dreger, C. (2011). Ramifications of debt restructuring on the euro area. Intereconomics, 46(4), 188–196. https://doi.org/10.1007/s10272-011-0382-7
- Castro, R., De Resende, C., & Ruge-Murcia, F. (2003). The backing of government debt and the price level. http://www.sceco.umontreal.ca SCECO-information@UMontreal
- Creel, J., & Le Bihan, H. (2006). Using structural balance data to test the fiscal theory of the price level: Some international evidence. Journal of Macroeconomics, 28(2), 338–360. https://doi.org/10.1016/j.jmacro.2004.07.009
- De Resende, C. (2007). Cross-country estimates of the degree of fiscal dominance and central bank independence. Working Papers of Bank of Canada, 7(36), 1–36.
- De Resende, C., & Rebei, N. (2008). Estimating the Degree of Fiscal Dominance in a DSGE Model with Sticky Prices and Non-Zero Trend Inflation. http://www.webmeets.com
- Department of Finance. (1996). Growth, employment and redistribution. A Macroeconomic Strategy. www.numsa.org.za
- DMO. (2015). Annual report. https://dmo.gov.ng/publications/reports/dmo-annual-report-statement-of-accounts/1021-dmo-2015-annual-report?format=html
- DMO. (2018). Annual reports. https://dmo.gov.ng/publications/reports/dmo-annual-report-statement-of-accounts/3060-2018-annual-report?format=html
- Fahr, S., & Frank, S. (2010). Downward wage rigidities and optimal monetary policy in a monetary Union. The Scandinavian Journal of Economics, 112(4), 812–840. https://doi.org/10.1111/j.1467-9442.2010.01627.x
- Favero, C., & Monacelli, T. (2003). Monetary-fiscal mix and inflation performance: Evidence from the U.S. Working Papers, (Vol. 234, pp. 1–28). IGIER (Innocenzo Gasparini Institute for Economic Research), Bocconi University.
- Fischer, S., Sahay, R., & Végh, C. A. (2002). Modern hyper-and high inflations. Journal of Economic Literature, 40(3), 837–880. https://doi.org/10.1257/jel.40.3.837
- Fratianni, M., & Spinelli, F. (2001). Fiscal dominance and money growth in Italy: The long record. Explorations in Economic History, 38(2), 252–272. https://doi.org/10.1006/exeh.2000.0753
- Gallo, G. M., & Otranto, E. (1998). Inflation in Italia (1863–1994): Nonlinearita è cambiamentidi regime. Universita diFirenze, Dipartimento Di Statistical, 38(2), 252–272.
- Grilli, V., Masciandaro, D., & Tabellini, G. (1991). Political and monetary institutions and public financial policies in the industrial countries. Economic Policy, 6(13), 341–392. https://doi.org/10.2307/1344630
- IMF. (2007). Country report: South Africa: Article IV consultation -staff report. Series: Country Report, 274(7).
- IMF. (2008). (Country report). Selected issues.
- IMF. (2010). Country and regional perspectives. World Economic Outlook, 2, 1-32. https://www.imf.org/~/media/Websites/IMF/imported-flagship-issues/external/pubs/ft/weo/2010/02/pdf/_c2pdf.ashx.
- Industrial Development Corporation. (2013). Industrial development organisation. http//www.idc.co.za
- Jalil, A., Tariq, R., & Bibi, N. (2013). Fiscal deficit and inflation: New evidences from Pakistan using a bounds testing approach. Economic Modelling, 37(1), 120–126. https://doi.org/10.1016/j.econmod.2013.10.029
- Keen, B. & Wang, Y. (2013). What is a realistic value for price adjustment costs in new keynesian models? Applied Economics Letters, 14(11), 789–793 doi:10.1080/13504850600592739
- KPMG. (2015). CFO outlook survey. https://assets.kpmg/content/dam/kpmg/ng/pdf/audit/cfo-survey-outlook.pdf
- Kydland, F. E., & Prescott, E. C. (1977). Rules rather than discretion: The inconsistency of optimal plans. Journal of Political Economy, 85(3), 473–491. https://doi.org/10.1086/260580
- Leeper, E. (1991). Equilibrium under ‘active’ and ‘passive’ monetary and fiscal policies. Journal of Monetary Economics, 27(1), 129–147. https://doi.org/10.1016/0304-3932(91)90007-B
- National Bureau of Statistics. (2015). (Annual reports and statement of accounts). NBS. (various issues).
- Nawaz, M., Iqbal, M. M., Ali, A., & Zaman, K. (2012). Fiscal theory of price level: A panel data analysis for selected SAARC countries. Romania Journal of Economic Forecast, 3, 152–170. https://www.researchgate.net/profile/Muhammad_Iqbal195/publication/287523260pdf
- Oko, O. (2001). Subverting the scourge of corruption in Nigeria: A reform prospectus. NYUJ Int’l L. & Pol, 34, 397–410. https://heinonline.org/HOL/LandingPage?handle=hein.journals/nyuilp34&div=18&id=&page=
- Okonjo-Iweala, N. (2011). Securing a diversified economic future for Nigeria. In C. C. Ikokwu (Ed.), Half a century of progress and challenges (pp. 1–17). True Expressions.
- Ornellas, R., & Portugal, M. (2011). Fiscal and monetary interaction in Brazil. In Meeting of the Brazillian Econometric Society, 33, 1–31. http://bibliotecadigital.fgv.br/ocs/index.php/sbe/EBE11/paper/download/2829/1289
- Phillips, P. C., & Durlauf, S. N. (1986). Multiple time series regression with integrated processes. The Review of Economic Studies, 53(4), 473–495. https://doi.org/10.2307/2297602
- Republic of South Africa. Budget review (Department of Finance). (Various issues).
- Republic of South Africa. (1994). Growth, employment and redistribution. A Macroeconomic Strategy. www.numsa.org.za
- Rogoff, K. (1985). The optimal degree of commitment to an intermediate monetary target. The Quarterly Journal of Economics, 100(4), 1169–1189. https://doi.org/10.2307/1885679
- Sanusi, K. A., & Akinlo, A. E. (2016). Investigating fiscal dominance in Nigeria. European Journal of Sustainable Development, 8(1), 125–131. https://doi.org/10.5539/jsd.v9n1p125
- Sargent, T. J., & Wallace, N. (1981). Some unpleasant monetarist arithmetic. Federal Reserve Bank of Minneapolis Quarterly Review, 5(3), 1–17. https://www.minneapolisfed.org/research/qr/qr531.pdf
- Sims, C. A. (1994). A simple model for study of the price level and the interaction of monetary and fiscal policy. Economic Theory, 4(3), 381–399. https://doi.org/10.1007/BF01215378
- Stock, J. H., & Watson, M. W. (1993). A simple estimator of cointegrating vectors in higher order integrated systems. Econometrica: Journal of the Econometric Society, 61(4), 783–820. https://doi.org/10.2307/2951763
- Tanner, E., & Ramos, A. (2002). Fiscal sustainability and monetary versus fiscal dominance: Evidence from Brazil, 1991-2000. IMF Working Papers, 2(5), 1–21. https://www.elibrary.imf.org/doc/IMF001/02541-9781451842197/02541-9781451842197/Other_formats/Source_PDF/02541-9781451890464.pdf
- Taylor, J. B. (1993). Discretion versus policy rules in practice. Carnegie Rochester Conference Series on Public Policy, 39, 195–214. https://doi.org/10.1016/0167-2231(93)90009-L
- Togo, E. (2007). Coordinating public debt management with fiscal and monetary policies: An analytical framework. World Bank Policy Research Working Paper Series. p. 4369.
- Trenovski, B., & Tashevska, B. (2015). Fiscal or monetary dominance in a small, open economy with fixed exchange rate: The case of the Republic of Macedonia. Zbornik Radova Ekonomskog Fakulteta U Rijeci: Casopis Za Ekonomsku Teoriju I Praksu, 33(1), 125–145.
- Us, V. (2004). Inflation dynamics and monetary policy strategy: Some prospects for the Turkish economy. Journal of Policy Modelling, 26(8–9), 1003–1013. https://doi.org/10.1016/j.jpolmod.2004.07.001
- Woodford, M. (1995). Price-level determinacy without control of a monetary aggregate. Carnegie-Rochester Conference Series on Public Policy, 43(1), 1–46. https://doi.org/10.1016/0167-2231(95)00038-0
- Xiong, W. (2012). Measuring the monetary policy stance of People Bank of China: An ordered Probit analysis. China Economic Review, 23(3), 512–533. https://doi.org/10.1016/j.chieco.2011.04.002
- International Budget Partnership. (2012). Open budget survey. https://www.internationalbudget.org/wp-content/uploads/OBI2012-Report-English.pdf