
 ?Mathematical formulae have been encoded as MathML and are displayed in this HTML version using MathJax in order to improve their display. Uncheck the box to turn MathJax off. This feature requires Javascript. Click on a formula to zoom.
Abstract
Even though there is a growing interest to empower rural women in all economic activities. Works of literature are scant to evaluate the role of small-scale irrigation technology on women empowerment. This study evaluates the impact of the adoption of small-scale irrigation technologies on women empowerment, where empowerment is measured by Women Empowerment in the Agricultural index. The propensity Score Matching (PSM) method was employed to identify comparable technology adopting and non-adopting sample households. Results of the average treatment effect on treated suggest adoption of small-scale irrigation technologies exacerbate the disempowerment of women. Hence, we suggest Policy and development interventions should give due emphasis on improving women’s capacity to own and control resources and should be decision-makers.
PUBLIC INTEREST STATEMENT
This is a study to examine the empowerment status of rural women and evaluate the impacts of small-scale irrigation technology on rural women empowerment. The major highlights of the findings are:
•Rural women are disempowered, which is inadequate in three domains out of the five empowerment domains.
•The disempowerment of women is highly influenced by two domains (income and time) and three indicators (such as income control, leisure, and speaking in public) of empowerment.
•Disempowerment of women is more severe in small-scale irrigation technology adopter households than non-adopter households.
1. Introduction
Agricultural intensive economic activities, mainly agriculture are the mainstay of the livelihood and the main source of the well-being of Ethiopians (Yami & Snyder, Citation2012). Although agriculture is the main source of Ethiopian households’ welfare; it is undermined by erratic climate change like drought (Ayele, Citation2011; Hagos et al., Citation2009). This climate change is a threat to agricultural production and productivity, which rendering households to a high degree of risk and misfortune (Domenech & Ringler, Citation2014; Foltz et al., Citation2013).
In areas where rainfall is inconsistent and resources are under-employed, irrigation systems are imperative for improving productivity and reducing vulnerability to climatic instability (Awulachew et al., Citation2006). Adoption of efficient irrigation technology allows farmers to acclimatize and build up their resilience, and induces farmers to apply modern inputs, harvest all over the year, and creates employment opportunity to household members (Ayele, Citation2011; Hagos et al., Citation2009; Namara et al., Citation2005).
Recent studies of Hagos et al. (Citation2009) and Wehabrebi (Citation2014) point out that adopting irrigation technology to improve agricultural efficiency is a stake for improving rural household welfare in Ethiopia. Likewise, the application of appropriate irrigation technology enables Indian farmers to produce high-value crops, which enables them to improve their welfare status (Namara et al., Citation2005). Increasing agricultural production and productivity, institutional development, and technology diffusion are a means of improving the wellbeing of people. However, technology adoption is challenged by technical, economic, and institutional factors (Kulkarni, Citation2011).Footnote1
In most developing countries like Ethiopia irrigation infrastructure/technology investment is mostly funded by the government (Kulkarni, Citation2011; Getacher et al, 2014). Involvement and investment of private sectors, projects, and non-government organizations are crucial for scaling up irrigation technology and irrigation.
Interventions in agriculture lead to a shift in food production, production variability, dietary variety, labor productivity, a change in the role of women and living standards of the households (Domenech & Ringler, Citation2014; FAO (Food and Agriculture Organization of the United Nations), Citation2011; Hagos et al., Citation2009; Namara et al., Citation2005). Women’s access and participation in irrigation have a multiplier effect on improving household wellbeing both in the short and long run since women mainly invest more in nutrition, health, and education of the household than men.
Recent studies demonstrated that gender empowerment in agriculture adversely affects the nutritional status of children. Kabeer (Citation2012) found that those children whose mothers actively participated in agricultural and other activities out of home have low nutritional status.
The broad consensus women spend more of their income on investment in their household welfare through education, health, and nutrition is also supported by evidence of Domenech and Ringler (Citation2014) and Van den Bold et al., Citation2013) which suggests women’s involvement in income-generating activities has a greater impact on increasing welfare and child nutritional status of the household. Women protect household welfare by drawing down assets hence greater economic empowerment of women enhances the welfare of the household.
If women spent much more time on irrigation activity and control income from irrigation, it is highly probable to increase the nutritional status of their child and household. The empirical investigation in Nepal by Malapit et al. (Citation2013) shows that the nutritional status of a child under 5 years old is determined by women empowerment in agriculture. Likewise, the study by Peiris and Wijesinghe (Citation2010); Van den Bold et al. (Citation2013) also show that mother’s time allocation to breastfeeding and introducing supplementary food, resource control of mothers are the main determinants of household nutritional status in general and nutritional status of the child in particular. Women in South Asian have low status and low decision-making power, as a result, malnutrition (being underweight, stunted, and wasted) of their child is higher (Domenech & Ringler, Citation2014).
Women’s relative power to men determines the power to control income, resources, time, and overall household decision-making which has a direct implication on their own and child nutritional status.
Small-scale irrigation technology adoption/interventions impact women empowerment in different ways. The study by Namara et al. (Citation2005) found that drip irrigation technology reduces the time spent to collect water but increase women’s workload which improves women’s empowerment in agricultural activates such as rights in household resource and control over income, income use, and control, decision-making role in the household, membership in groups (self-help group) and participate in the meeting. Irrigation technologies reduce the time spent by women on water collection responsibilities which enable women to engage in productive activities; improve productivity and income (Domenech & Ringler, Citation2014) which intern improves women’s status on income control and use. Moreover, if women have control over the income generated from small-scale irrigation, they will become beneficiaries of the technology and thus become more empowered (Koppen, Citation2002; Koppen et al., Citation2012). Contrary, access to new technologies and intervention can unintentionally create a burden for women and thus they become more disempowered (Theis, Citation2018). Studies by (Upadhyay et al., Citation2005) revealed that small-scale irrigation technologies increase women’s workload and thus they become more disempowered following the adaption of irrigation technologies. Furthermore, Malapit et al., (2013) found that in Nepal Workload of women in both paid and unpaid working activities disempowering women.
A closer look at the literature on the impacts of small-scale irrigation technology reveals many gaps and shortcomings. That is, the evidence on the subject is quite limited and the findings from the existing studies also tend to be highly inconsistent. Further, most gender and technology adoption research to date has focused on gender constraints to acquiring technology rather than the women empowerment outcome of the technology (Lambrecht et al., Citation2014). In general, existing literature on the subject is not sufficient to draw strong inferences. Some have applied a qualitative approach which findings cannot be tested empirically, and others produced an inconsistent result using a unidimensional measure of empowerment. Therefore, the current study is crucial to understand more completely the women empowerment outcome of small-scale irrigation technologies.
Hence, this study attempts to provide empirical evidence on the impact of small-scale irrigation technology (Pulley, and Rope-and-Washer) on women empowerment of farm households in the Amhara regional state of Ethiopia using a multidimensional measure of women empowerment.
The overall objective of this study is to explore the impacts of small-scale irrigation technology on women empowerment in the study area. Specifically, it attempts to examine women empowerment status.
2. Methodology
2.1. Data
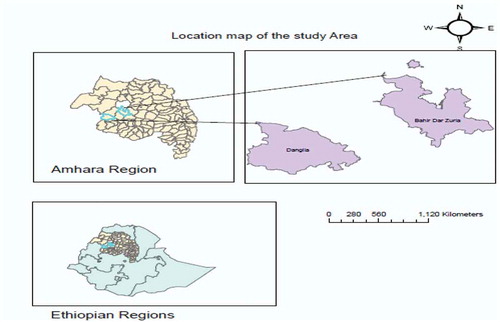
In this study, we used data from a household survey collected from mid-May to early June 2016 farm households selected from two woredas (Dangila and Bahir Dar Zuria) OF Amhara national region of Ethiopia (Figure ). Primary data were collected from 201 randomly selected farm households, using a multistage stratified random sampling technique. In the first stage, Dangla and Bahir Dar zuria woreda were selected purposely based on the existence of irrigation technology as pilot woredas (intervention sites) of the Innovative Lab for Small-Scale Irrigation (ILSSI) project.Footnote2
In the second stage, information from the agricultural offices of the selected Woreda was used to select one Keble (the smallest unit of administration in the government structure under a woreda), with a high concentration of smallholder technology such as a pulley, and rope-and-washer, in each woreda using a purposive sampling technique. In the third stage, the list of farm households in the selected communities was used to disaggregate them into adoptersFootnote3 and non-adopterFootnote4 households. Finally, we used the proportional random sampling technique to select our sample farm households. Of the total sample households, 79 were classified as adopters of small-scale irrigation technology. Treated households (adopters) were selected by the ILSSI project at the time of intervention, which distributed either of the two irrigation technologies to the households (rope-and-washer and pulley) to produce the same crop (elephant grass and tomato in Robit, onion in Dengeshita, and pepper in all sites).
Women’s empowerment in agriculture was measured by administering the WEAI questionnaire developed by Alkire et al. (Citation2013) and piloted in Bangladesh, Uganda, and Guatemala. Self-identified primary male and primary female decision-makers were chosen as respondents to the WEAI module and were administered by professionals of BA degree holders in statistics with more than 3 years of experience in the Central statistics Agency and other NGOs.
Figure 1. Study area map
2.2. Measurement of women empowerment
In this study empowerment of women was measured by Women Empowerment in Agricultural Index (WEAI). WEAI is the latest index developed in 2012 by OPHI as a direct indicator of economic empowerment and gender parity at household and individual level (Alkire et al., Citation2013; and Yang & Stanley, Citation2012). Since empowerment is a dynamic and complex concept hence one indicator alone is not adequate to measure, in this research the (Alkire et al., Citation2013) multidimensional measure of empowerment was adopted. The Alkier-Foster multidimensional measure of empowerment helps to show women’s achievement in 10 indicators and five domains of empowerment.Footnote5 WEAI helps to measure empowerment in a multidimensional way by using the weighted five domains and 10 indicators, which allows decomposition and comparison across different domains. WEAI combines two sub-indexes such as five domains of empowerment (5DE) and gender parity index (GPI) with the arbitrary weights of 90 and 10% respectively.
The five domains of empowerment sub-index evaluate whether women are empowered across the five (production, resource, income, leadership, and time) domains. By using the negative notionFootnote6 of measuring empowerment, the disempowerment index in each of the five domains is constructed from the weighted 10 indicators, which was constructed as a weighted aggregate of the variables that contribute to the status of women in each indicator. Hence, in each indicator, the adequacy situation of an individual is determined through the multiplication of the variable with their defined weight and compare with the inadequacy cutoff. Once, adequacy score of an individual and inadequacy cutoff is determined, the overall disempowerment index (M0) is constructed using the weighted indicatorsFootnote7 (Alkire et al., 2012; and Alkire et al., Citation2013). The disempowerment of women is decomposed by indicators and domains to show the contribution of each indicator and domain for disempowerment. Empowerment in five domains is a counterpart of disempowerment which is computed as
where 5DE is measured using 10 indicators with their corresponding weights (see Appendix 1), and (M0) is the overall disempowerment index. Each indicator shows whether each individual has adequate achievement in that area or not.
Another innovative feature of WEAI is Gender Party Index (GPI), which reflects gender differentials in the empowerment women with men across the 5DEs in the same household.
Mathematically:
where index of gender empowerment,
is the degree of empowered women and GPI is the relative empowerment of women in the household. 0.9, 0.1 are the weight given to the indexes. The
interpreted as the percentage of the domains, of women empowerment in agriculture index, in which women enjoy adequacy. All indexes were generating by STATA with respective sub-indexes (See appendix 1 and 2 for details of the computation).
2.3. Analytical model
In this study, descriptive statistics and econometric analyses were employed to analyze the impact of the intervention on women empowerment of the treated group.
Women empowerment impact evaluation was conducted by employing the Propensity Score Matching (PSM) method to answer the question: “What if a household has not adopted small scale irrigation technology?” To do so, propensity score P(x) is calculated based on all observed covariates X that jointly affect participation in small-scale irrigation technology adoption and outcomes of interest (Khandker et al., Citation2010).
The adoption decision of small-scale irrigation technology is a dichotomous variable with a value of 1 if the household adopts the technology and 0 otherwise. The probability of small-scale irrigation technology (Pulley, and Rope-and-Washer) adoption is estimated by binary logistic regression. The econometric estimation is specified as:
The latent (index) model:
where y* is latent variable, xβ is index function and u is the error term; u ~ l(0,π2/3)
If
where the probability of adoption of small-scale irrigation technology and
is the linear combination of covariates the probability of non-adoption of small-scale irrigation technology can be specified as:
Odis ratio (L) is obtained by dividing (3) by (4)
Finally,
where log of logit model odds ratio is,
is cumulative distribution function,
are the coefficient of the regression estimated by maximum likely hood estimation technique and
vector of covariates that determine the dependent variable (participation in irrigation).
So, the treated model of estimating the propensity score is
where x is the vector of covariates including sex (=1 for female and = 0 otherwise), age of the household head in a year (age_h), the number of adult household member (Add_hh), education level of the head (Educ_h), landholding size of the household in hectare (Land_size), extension service in the frequency of farmers visited by extension workers per year (Ext_service), distance to the nearest market (Mkt_dista) and access to credit (Credit_acces) = 1 has access and = 0 otherwise.
The impact of the technology as measured by the difference in outcomes of the control and treatment group through the Average treatment effect on treated.
Where: φ is an indicator of treatment with a value of φ=1 if the household participates in the adoption of irrigation technology and φ=0 if the household did not participate in the adoption of technology. is an average outcome of household who are treated,
is an average outcome of treated households if they were not using the technology. In this study, the outcome variable is the empowerment of women in activities they run as defined and measured above.
3. Results
3.1. Empowerment analysis
A summary statistics result in Table shows WEAI for women in the study area is 0.713, the weighted average of 5DEs = 0.692, and GPI = 0.902. The headcount ratio shows overall, 79% of women are disempowered. The proportion of disempowered women in the area is much higher than Bangladesh (61%), Guatemala (71.3%), and Uganda (56.7%) (Alkire et al., Citation2013), but lower than what rural Pakistan women experienced (83%) (Ahmad & Khan, Citation2016).
Table 1. Women empowerment in agricultural index and its sub-index in the study area
Overall 30.81% of women were disempowered in five domains of empowerment, which is higher than the comparable measure of disempowerment in Bangladesh (25.4%) and Uganda (21.1%) but lower than women’s disempowerment index of Guatemala (31%)(Alkire, et al., Citation2013) (See Table ).
On average, women who are not yet empowered have inadequacy achievement in 39.0% of the domains. In the same way, the average inadequacy of disempowered men in the study area is 33.5%. And the men’s disempowerment index is 22.8%.
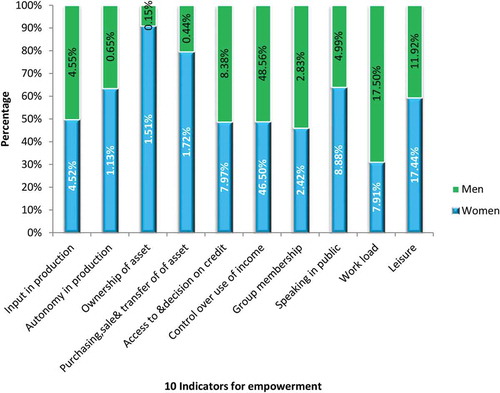
The censored headcount ratio (in Table and Figure ) shows that women are more disempowered in terms of indicators like control over the use of income (71%), leisure (36%), and access to and credit decision (53%). Compared to other indicators fewer women are disempowered in terms of ownership of an asset (6.97%) and group membership (7.43%) indicators. Comparatively, the result infers that women are empowered in terms of autonomy in production (only 3.5% of women are disempowered). The result is consistent with the pilot empirical finding in southern Bangladesh (Alkire et al., Citation2013).
Table 2. Women’s and men’s disempowerment decomposed by domains and indicators
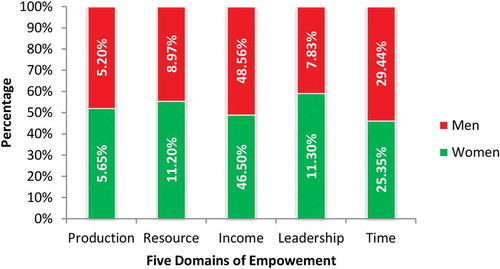
Decomposition of disempowerment measure in Table and Figure shows that control over the use of income and time dimension contribute most (more than their respective share of 20%) for the disempowerment of women. Hence, women are mainly derived in the use of income and time domain.
The result also shows about 71.3% of women are disempowered and lack power to sole or joint control over the use of income and expenditure, and 53.3% of women do not have a manageable workload. This finding is in line with the pilot result in Uganda (Alkire et al., Citation2013). Despite women involved in all agricultural activities, their power over control and decision on income is lower in these study areas.
The remaining domain like the production domain contributes to the disempowerment of women bellow their share in calculation of the overall disempowerment index.
This result is contrasting with the finding in other developing countries such as Pakistan (Ahmad & Khan, Citation2016) and Bangladesh (Malapit et al., Citation2015) but is consistent with the finding in Southern Bangladesh (Alkire et al., Citation2013).
Figure 2. Contribution of domains to the disempowerment of women and men in the study area
The result shows that the disempowerment headcount of women and men reflects a huge disparity in the level of disempowerment among women and men and it indicates that 79% of women and 68% of men are disempowered. The result helps to deduce that, the average disempowerment score of disempowered women (39%) is higher than men (33.5%). The gender parity indexFootnote9 (GPI) 0.902 reflects the prevalence of higher inequality between the empowerment level of males and females within the same household compared with other countries like Pakistan (Ahmad & Khan, Citation2016).
The headcount result (Table ) shows that 49% of the households have no gender parity and women have higher disempowerment scores than men in their household. For those women, without parity, the empowerment gap between women and their men counterparts in their households is 20.11%.
In the comparison of headcounts across domains and indicators (Table , figures &) women have a higher headcount in all indicators and all domains except income and time domain. A comparison of disempowered headcount depicts that the highest disempowerment headcount for both women and men is control over the use of income. Likewise, the lowest headcount for women is autonomy in production; while for men ownership of asset contribute more to their disempowerment level (Table & Figure ).
Figure 3. Contributions of indicators for disempowerment of men and women. Sources: survey data
Income and time domains are the only domains that contribute more to the disempowerment of men than women (48.56% Vs 46.5%) and (29.44% Vs 25.35%) respectively. The contributions of all other domains are substantially higher for women than men.
3.2. Econometric analysis
Before estimating the econometric model, model specification and other diagnostic tests were checked. For matching treated households with control household propensity score matching were estimated by the binary logistic regression. Jointly, all estimated coefficients are statistically significant since the LR statistic has a p-value of less than 1% (Table ). The estimated result revealed that covariates such as sex of the household head, education level of the head, adult household member, landholding size, distance to the nearest market, and access to credit are significant predictors of small-scale irrigation technology adoption probability.
Table 3. Logistic regression result for propensity score estimation
Accordingly, those households with female household heads have a 42.1% greater chance of being technology adopter than the household with a male head, other things remain constant.
More educated farm households have a better knowledge of the importance of technologies since literacy enhances the capacity for adapting and understanding the technology. The estimation result shows, additional years of schooling of the household head increases the probability of adopting small-scale irrigation technology by 5.6%.
Since small-scale irrigation technology is labor-intensive, which needs labor to assist the irrigation technology and the household with more members requires more production to sustain their life, which requires augmentation of their productivity through technology. Other things remain constant; a unit increases in adult family members of the household results in an increase in the likelihood of technology adoption by 11.3%. The result is intuitive because more adult members in the household imply cheap labor availability in the household, who can assist the technology.
The result also shows that households with large landholding have a higher likelihood of adopting the technology, which is statistically significant at 1%. This might be since irrigation is the activity in the dry season and land for irrigation is prepared at the end of the summer season where rain-fed crops are not yet harvested. Thus, the household should leave the land waiting for irrigation. Therefore, having large landholding may permit households to allocate part of their land for irrigation and adopt technology to lift water and irrigate in the appropriate season.
Farm households far from the market center are highly likely adopted technology than households near to the market center. This might be because the nearest household to the market may access products in the market; have better market information (regarding risk, price, and value of time), and higher opportunities of market-sensitive income-generating activities (such as trade) within a short period even a day than households far apart from the market center. Thus, one more kilometer distance of household’s home from the market center increases the likelihood of farm households adopting small-scale irrigation technology by 1.8%, other things remain constant.
Finally, investment in irrigation technology requires an investment fund (liquid asset), which is the main constraint for most rural farm households. Thus, the provision of either cash credit for technology or technology in kind encourages farmers to adopt the technology. The econometric result of this study revealed that the probability of adopting irrigation technology for households with credit access is higher than households without credit access by 42.3%.
On the contrary, the result shows that the age of the household head and extension service (number of days visited by extension worker per year) has no significant impact on the probability of adopting irrigation technology. To sum up, landholding and access to credit are variables that strongly induce the probability of technology adoption.
The common support region (Table ) lies between 0.0688023 and 0.960054. This implies that observations with the propensity score matching below 0 .0688023 and above 0.960054 were discarded out of the matching sample. Based on the min-max criterion of determining the common support region, out of 201 households, 55 households (35 control and 20 treated households) fall out of the common region (support region) and were discarded from the analysis.
Table 4. Distribution of estimated propensity scores
In choosing the best matching algorithm in this study equal mean test, low pseudo-R2 value, and large matched sample were considered as the criteria. By such criteria, caliper matching with 0.02 distance fits the three criteria and hence the best matching algorithm for this study. Hence, the estimation result of this study is based on a caliper matching algorithm with 0.02 distances from the propensity score of the individual household.
Matching quality is checked through standardized bias; t-test, Joint significance, and Pseudo-R2. In line with this after matching, a partial and joint test of covariate and propensity score balance indicates that there is no significant mean difference between adopters and non-adopters. Therefore, it is trustworthy to estimate treatment effects based on the available data and the chosen matching algorithm (caliper with 0.02 distances from propensity score).
3.2.1. Impacts of small-scale irrigation technology
The PSM (Table ) shows that the empowerment status of women in adopter and non-adopter households is significantly different. Women in technology adopter households are more disempowered than non-adopter households by about 12% of the empowerment domain (about 1 domain out of 5 domains). The possible explanation for this might be the empowerment of women as a result of irrigation technology treatment depends on the situation whether women in the household are farm decision-makers or simply family laborers. As provided in the descriptive statistics result women in the study area are inadequate in decision-making, so adoption of technology did not offer the enjoyment of empowerment for women in technology adopter households as compared to women in non-technology adopter households. Moreover, the empowerment of women might be determined by environmental and social factors like religion and culture. The result is consistent with the descriptive statistics and the empirical finding of (Bryan, Citation2015) for comparison of Ethiopian irrigator and non-irrigator women.
Table 5. Impacts of small-scale irrigation technology adoption on households
Thus, the upper bound significance level (p-value) is significant (i.e. p < 0.05) at different sensitivity parameter Γ. This lower significant level shows the impact of small-scale irrigation technology adoption on the empowerment of women is insensitive to hidden biases (unobservable character).
4. Conclusion and policy implication
The definitive aim of this study was to evaluate the impact of small-scale irrigation technology on the empowerment of women in the study area. Women empowerment impact evaluation was undertaken on 201 households (122 control and79 treated) in the Amhara national region of Ethiopia. To analyze the impact of small-scale technology adoption on the intended treatment outcome econometric (PSM) analysis was employed.
The empowerment analysis showed women in the study area were disempowered (empowered only in 71.3%) of the empowerment domains. The headcount ratio implies 79% of women are disempowered in five domains of empowerment. Moreover, women who are not yet empowered are inadequate in 39% of the domain (which is in 2 out of the 5 empowerment domains). The disempowerment of women is highly influenced by two domains (income and time) and three indicators (such as income control, leisure, and speaking in public) of empowerment.
The Propensity score matching estimation result also shows a significant difference between adopters and non-adopters in terms of women empowerment in the household. The effect of small-scale irrigation technology on women empowerment shows that on average women in small-scale irrigation technology adopter households enjoy empowerment only in 66.8% of the empowerment domain, which is lower than the empowerment enjoyment of women in non-technology adopter households by 12%. This might be women in technology adopter households has no role other than family labor. Besides, all women in the study area were disempowered in the domain (less than 80% of the empowerment domain). This treatment effect is insensitive to the hidden biases.
Disempowerment of women in control over income, leadership, and time is directly associated with poor child and maternal malnutrition. So, policymakers and development intervention should aim to empower women by closing the gender gap, ensuring access to productive resource use and control of income. Finally, we recommend that intervention in small-scale irrigation should work to make women a decision-maker in agriculture rather than sole family labor, promote labor-saving irrigation technology, and ease of time burden of women in the household.
Additional information
Funding
Notes on contributors

Belainew Belete
Belainew Belete is a lecturer and researcher at Bahir Dar University. His research interests include welfare, poverty, efficiency analysis, impact evaluation; effectiveness of policy, macroeconomics, and microeconomics. He has published two papers in pre-reviewed international journals.
Surafel Melak (Ph.D.) is an Assistant Professor and researcher at Bahir Dar University. His research interests include poverty, welfare, impact evaluation, Macroeconomics, and Microeconomics. He has published 5 papers in pre-reviewed international journals.
Notes
1. (1). Technical factors: gap between prevailing technology and local need, application and spare part. (2). Economic factors include high cost of technology, low investment capability of farmers, low and slow return of farm investment. (3). Institutional factors include poor infrastructure and incapable extension services.
2. Feed the Future Innovative Lab for Small-Scale Irrigation (ILSSI) is a five-year project launched in 2013, aiming to increase food production;, improve nutrition and livelihoods of farm household; accelerate economic development; and protect the environment through improved access to small-scale irrigation technologies. The technical intervention (irrigation technology provision) of the project is aimed to expanding irrigable land, using optimum irrigation techniques in order to battle poverty and malnutrition problems, and improve the livelihoods of farm households in Tanzania, Ethiopia and Ghana.
3. Adopter (treated) households are farm households who adopt either of the two irrigation technologies, i.e., rope-and-washer or pulley.
4. Non-adopter (control) households are farm households who rely on rain-fed agriculture.
5. See Appendix 1.
6. According to (Alkire et al., Citation2013) there are two notions of constructing 5DE. The positive notion concentrate on percentage of empowered and adequacies among disempowered women. But, the negative notion evolves on measuring the percentage of disempowered women and the percentage of women who have inadequate achievement.
7. See Appendix 2.
8. This is the average score of disempowered women.
9. See Appendix 2 for methodology of calculation).
References
- Ahmad, N., & Khan, H. (2016). Measuring women’s disempowerment in agriculture in Pakistan. IFPRI Discussion Paper (No. 01512).International food policy research institute.
- Alkire, S., Meinzen-Dick, R., Peterman, A., Quisumbing, A., Seymour, G., & Vaz, A. (2013). The women’s empowerment in agriculture index. World Development, 52(1), 71–17. https://doi.org/10.1016/j.worlddev.2013.06.007
- Awulachew, S. B., Menker, M., Abesha, D., Atnafe, T., & Wondimkun, Y. (2006). Best practices and technologies for small scale agricultural water management in Ethiopia. iwimi.
- Ayele, G. K. (2011, July). the impact of selected small-scale irrigation schemes on household income and the likelihood of poverty in the lake tana basin of Ethiopia.
- Bryan, E. (2015). Linkages between irrigation, nutrition, health, and gender influences nutrition and health outcomes and.
- Domenech, L., & Ringler, C. (2014, April). The impact of irrigation on nutrition, health, and gender: A review paper with insights for Africa South of the Sahara. IFPRI Discussion paper 01259. SSRN. https://doi.org/10.2139/ssrn.2249812
- FAO (Food and Agriculture Organization of the United Nations). (2011). The State of Food Insecurity in the World 2011: How does international price volatility affect domestic economies and food security?
- Foltz, J., Gars, J., & Zaitchik, B. (2013). Weather and welfare in Ethiopia weather and welfare in Ethiopia.
- Hagos, F., Makombe, G., Namara, R. E., & Awulachew, S. B. (2009). Importance of irrigated agriculture to the ethiopian economy: Capturing the direct net benefits of irrigation (No. 128; IWMI Research Report).
- Kabeer, N. (2012). Women ’ s economic empowerment and inclusive growth : Labor markets and enterprise development (2012/1). https://doi.org/org/2012
- Khandker, S. R., Koolwal, G. B., & Samad, H. A. (2010). Handbook on impact evaluation: Quantitative methods and practices. World Bank. https://doi.org/10.1596/978-0-8213-8028-4
- Koppen, B. V. (2002). A gender performance indicator for irrigation: Concepts, tools, and applications. Colombo, Sri Lanka: International Water Management Institute (IWMI). 42p. IWMI Research Report, 59(5), 15-72. http://www.iwmi.cgiar.org/Publications/IWMI_Research_Reports
- Koppen, B. V., Hope, L., & Colenbrander, W. (2012). Gender aspects of small-scale private irrigation in Africa (No. 153; (IWMI Working Paper).
- Kulkarni, S. A. (2011, January). Innovative technologies for water saving in irrigated agriculture.
- Lambrecht, I., Vanlauwe, B., & Maertens, M. (2014). Understanding the process of agricultural technology adoption : Mineral fertilizer in Eastern DR Congo. World Development, 59(2), 132–146. https://doi.org/10.1016/j.worlddev.2014.01.024
- Malapit, H., Kovarik, C., Sproule, K., Meinzen-dick, R., & Quisumbing, A. (2015). Instructional guide on the abbreviated women s empowerment in agriculture index (A-WEAI) 1 (Issue October).
- Malapit, H. J. L., Sraboni, E., Quisumbing, A. R., & Ahmed, A. (2013). Is women ’ s empowerment in agriculture associated with better nutrition and education outcomes for children ? Evidence from Bangladesh.
- Malapit, H., Kadiyala, H. J., Tyagi, L. M. S., Quisumbing, A. R., Cunningham, K., & Tyagi, P. (2013). Women ’ s empowerment in agriculture, production diversity, and nutrition evidence from Nepal (IFPRI Discussion Paper 01313; Issue December).
- Namara, R. E., Upadhyay, B., & Nagar, R. K. (2005). Empirical Results from Selected Localities of Maharashtra and Gujarat States of India ( No. 93).
- Peiris, T. D. R., & Wijesinghe, D. G. N. G. (2010). Nutritional Status of under 5-year-old children and its relationship with maternal nutrition knowledge in Weeraketiya DS division of Sri Lanka. Tropical Agricultural Research, 21(4), 330–339. https://doi.org/10.4038/tar.v21i4.3309
- Theis, S. (2018). Can irrigation both empower and exclude women? IFPRI Blog.
- Upadhyay, B., Samad, M., & Giordano, M. (2005). Livelihoods and gender roles in drip-irrigation technology: A case of Nepal. Working Paper 87, 18. http://www.iwmi.cgiar.org/Publications/Working_Papers/working/WOR87.pdf
- van den Bold, M., Quisumbing, A. R., & Gillespie, S. (2013, October). Women’s empowerment and nutrition: An evidence review. IFPRI Dscussion Paper 01294. SSRN Electronic Journal. https://doi.org/10.2139/ssrn.2343160
- Wehabrebi, A. A. (2014). Impact of small scale irrigation on household welfare . Mekelle University.
- Yami, M., & Snyder, K. (2012). Improving the sustainability of impacts of agricultural water management interventions in challenging contexts. (Research Work).
- Yang, M., & Stanley, T. D. (2012). Micro-credit and income: A literature review and meta-analysis. Bulletin of Economics and Meta-Analysis,18(2). http://www.hendrix.edu/maer-network/default.aspx?id=15206
Appendix 1.
Ten Indicators of Women Empowerment in Agricultural Index and Their Weights
Appendix 2.
Methodology for calculating the Disempowerment index and Gender parity
To compute the WEAI and its sub-indices identification of indicators that contributes to empowerment is the preliminary activity. To do so, the computation of the disempowerment index across the five domains (M0) helps to compute 5DEs (1-M0).
Coding the disempowerment indicators
The inadequacy score () of disempowerment indicators are coded value of 1 for an individual who is inadequate in all 10 indicators and 0 for an individual who has no inadequacy on any indicator. The inadequacy score (
) is computed by:
where = inadequacy achievement of a person in the indicator “i”;
for inadequacy and 0 otherwise.
is the weight attached to the indicator “i”
Identification of the disempowered
A cutoff 0.20 is used to identify the disempowered (Alkier et al., 2013). This cutoff is the share pf weighted disempowerment an individual must have to be considered as disempowered, which is denoted by (k). Hence, it is a way to compute the censored score. (k) Denotes censored score and
is a non censored score. If
, the
=
and if
, then
= 0 where
is the disempowerment score of the disempowered.
Computing five domains of empowerment (5DE)
Steeps of computing 5DE:
Computation of 5DE has two components:
1st steep: Disempowered headcount ratio (H): it is the incidence of the individuals (within a given population) whose share of weighted inadequacies is more than the cutoff k.
Where
number of disempowered individuals and
is the total population.
2nd steep: Intensity of empowerment (A): it is the average inadequacy score of the disempowered individual.
Where = the censored inadequacy score and
is the number of disempowered individuals.
3rd steep: Computing five domains of disempowerment
The disempowerment of and individual in five domains of empowerment is the product of disempowerment headcount and the average inadequacy score. Symbolically:
Finally, empowerment in five domains:
It is the empowerment score of an individual in a weighted five domains of empowerment.
Equivalently,
Where:) is empowered headcount ratio and
is the average adequacy score.
Breaking of disempowerment index by domain and indicators:
This is important to see the disempowerment of women in different context via decomposing M0 into its component-censored indicators. The censored headcount in each of the indicators is calculated by adding up the number of disempowered people who are deprived of the indicator and dividing by the total population. The censored headcount ratio for an indicator implies the proportion of deprived people in that indicator.
The overall M0 can be computed as:
Where is the censored headcount ratio of the indicator “i” and
is the weight attached to the indicator “i”, the sum of each weight is equal to one.
The percentage contribution of each indicator for the overall disempowerment is computed as:
The contributions of all indicators will sum up to 100%. And the percentage contribution of each domain to the overall disempowerment of women is the sum of the percentage contribution of each indicator in their respective domain.
Calculating Gender Parity in Empowerment Index
The gender parity index indicates the inequality in the five domains of empowerment between primary male and female adults in each dual household. A household enjoys parity if the woman is empowered or not, her adequacy score is greater than or equal to her male counterpart in her household. The GPI has two pillars of information:
(i)The percentage of women without gender parity (H_GPI): is the proportion of women who lack gender parity relative to their male counterparts in their household.
Where h = number of households classified as without gender parity and = total population of dual-adult household in the population.
(ii)Average Empowerment Gap (I_GPI): is the extent of the inequality in empowerment between women without gender parity and men in the household. In other words, it is the average percentage gap between the censored inadequacy scores of women and men living in the household that lack gender parity.
Where are the censored inadequacies scores of the primary women and men, respectively, live in household
, and h is the number of households with gender parity.
Therefore,
Finally,