
 ?Mathematical formulae have been encoded as MathML and are displayed in this HTML version using MathJax in order to improve their display. Uncheck the box to turn MathJax off. This feature requires Javascript. Click on a formula to zoom.
Abstract
Individual investment decision-making theory revolves around the logical choices an investor is expected to make to achieve the maximum return on investments. The investor life cycle theory is often used as a guideline to determine how investors will invest based on their predicted life cycle phase. However, the question remains whether lifecycle investing is still relevant today. The main purpose of the paper is to analyse how demographic factors influence investment product selection for South African banking clients using Big Data. The analysis found that the investment patterns of South African investors strongly contradict the foundational literature of the investor life cycle. South African investors are skewed more towards low-risk investment options like cash, across all age ranges, only investing in higher-risk instruments much later than what the investor life cycle theory suggests. Female investors are especially risk-averse, however, the effect becomes less prominent as income level rises. The risk-averse investment style seen in the findings for all South African investors can be explained by the slow economic growth experienced in South Africa, with investors having less disposable income to invest.
PUBLIC INTEREST STATEMENT
Banks have large volumes of data on their clients with which they can perform extensive analytics. Big Data can be used to change investment behaviour and is a pivotal part of any marketing campaign, aiming to promote healthy financial decision-making habits. Banks can no longer rely on traditional banking solutions only, and with the world as interconnected as it currently is, the moral obligation exists to change their clients’ behaviour for the better. By improving the well-being of their clients, banks can play an important role in ensuring their clients can retire comfortably, which will also result in improved economic activity and increased profits.
1. Introduction
Matthews and Thompson (Citation2005) found that the line between commercial banking and investment banking has become unclear, as numerous commercial banks offer investment banking solutions and some investment banks have extended loans and other forms of credit. The key to success for banks in the South African investment industry is to fully understand the unique investment needs of their clients (Seetharaman et al., Citation2017). An important factor to remember is that investor needs change over time. A product that was suitable for specific investment needs at a certain point in time might not be what is needed right now (Jagongo & Mutswenje, Citation2014). Banks group investors into different risk profiles based on the investors’ willingness to tolerate risk. Risk tolerance can be defined as the amount of -volatility an investor is willing to tolerate with the anticipation of greater returns, individual investment objectives and investment considerations (Harlow & Brown, Citation1990).
The traditional banking industry focussed on safekeeping funds and extending credit (Goddard & Wilson, Citation2016). This has been a very lucrative endeavour with interest rates on credit products being higher than interest on the funds kept on behalf of their clients. With the changing technology and modern clients becoming accustomed to quick and easy solutions, more clients would like to see all their financial assets and obligations on one single platform (Saleem & Rasheed, Citation2011). This is causing a shift towards banks launching their unique investment products and solutions. Banks also have a moral obligation to provide clients with products they need instead of only pushing the most profitable option like extending credit (Mostert & Lotz, Citation2010). South Africans are over-indebted and studies have estimated that a large portion of the population will not have enough savings at retirement age (Nogantshi, Citation2015). South African over-indebtedness highlights the importance for banks to understand the needs of their clients and promote relevant investment opportunities.
Research conducted by Hofacker et al. (Citation2016) found that Big Data can provide insight into each different stage of the investor decision-making process. According to Lee (Citation2017), Big Data is the availability and interpretation of large quantities of data by using technological advances. The concept has had profound implications on the ability of firms analyse their clients’ behaviour and utilise the data to improve everyday operations and marketing. Banks have large volumes of client data at their disposal which can be used to gain client insights. The data can be used to model client investment portfolios to gain a view of the overall bank’s investor behaviours and the differences between clients of different demographics and income levels (Kitchens et al., Citation2018). This allows the bank to promote investment products suitable for their investments based on their predicted stage on the investor life cycle. Data and analytics have become so sophisticated that banks can see when their clients have funds flowing to competing firms. With this information, banks can determine which products the competing firms have that could be attracting their clients and lure them back by providing similar products, with the added benefit that all their products would be available on a single platform (Hao, Citation2000). The use of historic data to visualize trends and make assumptions on how clients will react is a vital part to determine how clients will react in the future. The use of Big Data and sophisticated statistical analysis tools allow for more accurate predictions (CitationEY (Ernst & Young), 2014).
Figure 1. Stages of Big Data analysis (Source: CitationEY (Ernst & Young), 2014)

Mostert and Lotz (Citation2010) emphasise that changing technological environment, had a profound impact on the method every institution operates. Banks have access to large volumes of client- and financial data. To retain a competitive advantage, it is essential to have the best technology to process and derive value from the data (Berger, Citation2003). Banking clients have grown accustomed to convenient solutions with the prominence of online banking and other digital solutions have increased exponentially. As a result, banks are relying more heavily on automated systems that allow clients to transact in real-time (Ziady, Citation2017). As clients have more control over when and how they transact, they tend to gravitate toward the bank that offers the most efficient and convenient solutions (Achmed, Citation2011). An example of this is the “selfie” feature First National Bank launched in 2018, where potential new clients can open an account by simply taking a selfie on their banking app (Mavundza, Citation2018).
Another development in the banking environment where South African banks need to increase their focus is within the realm of artificial intelligence (AI) and machine learning (Figure ). AI is already present in everyday banking, with complex algorithms predicting which products to market to specific clients, early fraud detection analytics and chatbots that can free up client services teams to respond to more complex queries already being widely utilised (Daks, Citation2018). From an investment side, banks are also investigating the possibility of using digital advisory services, where the investor completes a questionnaire online. An algorithm will then process the data and provide the investor with a full range of portfolio constructs, based on their unique needs and risk profile (Rodionov, Citation2017).
Acquiring new clients should always be an enormous drive for banks, however, more focus should be placed on retaining existing clients. Since the introduction of mass marketing strategies, based on readily available client information, banks have managed to sell massive amounts of products. Clients that previously would have been unaware of products available suddenly had an abundance of choices. This led to an increase client numbers, with the drawback that banks started losing the personal touch (Achmed, Citation2011). Linking back to the importance of Big Data, banks can get a better understanding of the types of clients they are dealing with and personalise communications sent to these clients (Kitchens et al., Citation2018).
Research conducted by Ernst & Young (CitationEY (Ernst & Young), 2010) found that clients look at the best product for their needs and not necessarily using one individual banking institution. This trend seems to be less prevalent with clients with more than one product at one bank, which suggests that loyalty towards a bank increases with the number of products held at the institution. With more products at one bank, it is also more difficult to move all of them to a competing bank, which increases client retention. This highlights the importance of offering investment products, even if they are less profitable than traditional credit products (Chen & Popovich, Citation2003). By analysing the amount being invested based on demographic factors like age, gender, race, and income level by using Big Data it is possible to determine which groups are saving enough, and which groups are not (Kitchens et al., Citation2018). Marketing campaigns can thus focus on promoting investment opportunities to individuals who are not saving enough and be personalised based on the findings. The use of historic data to visualise trends and make assumptions on how clients will react is a vital part to determine how clients will react in the future.
2. Literature review
There are several factors a bank needs to take into consideration when profiling investors into different risk categories. The main driving forces for individual investment needs come from demographic and socioeconomic influences. Banks generally have enough customer information from account opening to determine in which risk category a customer would fall based on prior studies focussing on how demographics like age, sex and race influence risk-taking behaviours (Sulaiman, Citation2012). This is not the only information a bank will need to accurately profile their investment customers, as every individual would have their specific investment considerations and goals. Several constraints need to be considered when choosing the perfect asset mix (Figure ). Each investor perceives risk differently and can handle different levels of risk given the expected return (Barclays Plc, Citation2018).
Different levels of sophistication exist under investors. Some investors monitor the market and use complicated Technical or Fundamental Analysis techniques to identify and exploit profit-making opportunities. The average individual will, however, choose investments based on limited information and allow them to move up and down with market forces with the hope of making future profits. The base of their assumption is fundamental analysis as they would consider investments that are perceived to be performing well but no further research will be done (Kumar et al., Citation2015). Understanding what type of investor a bank is dealing with will assist in selecting the correct investment products (Barclays Plc, Citation2018).
The investor life cycle theory can be defined as the behaviour of investors given their investment horizon. The theory’s main assumption is that investors will behave differently in different stages of their lives and that the amount of time an investment is expected to be kept influences the amount of risk an investor takes. According to Brown and Reilly (Citation2012), the theory comprises out of four different life stages, being accumulation, consolidation, spending, and gifting. Bodie and Treussard (Citation2007) found that target-date funds, also known as life-cycle funds have the potential of earning greater returns when compared to some of the investment choices made by uninformed fund participants that lack investment knowledge. This highlights the importance of the life-cycle as this simplifies the concept of investing to the average person.
Figure 2. Risk vs. return per asset class
The importance of determining the willingness and ability of investors to take on risk is an essential component in the financial and investment planning process for investment banks (Larkin et al., Citation2013). The influence of an individuals’ risk tolerance and the association it has with the amount individuals are willing to risk when investing can have a tremendous contribution to how banks aim their investment products at their clients (Kellerman, Citation2019). The process of establishing how much money an individual is willing to risk when investing is not an easy or straight forward process but rather entails the vigorous multidimensional evaluation of the number of predisposing factors that can influence this decision (Grable & Joo, Citation2004; Trone et al., Citation1996).
Each individual will have a different level of risk willing to take on which will vary across the investor life cycle concerning investment goals and objectives (Old Mutual, Citation2014). The current investor life cycle focuses mainly on the current age group of the investors and their risk tolerance levels based on limited demographics and assumptions. It is believed that investors in their twenties have different investment needs than that of investors in their forties, while several factors like race, gender, affluence, family size, and more could affect what an investor’s actual needs are (Bodie, Citation2015). Sung and Hanna (Citation1996) highlight from previous research that demographic factors such as education levels, race, employment status, gender, other income and age can influence financial risk tolerance. Previous researchers such as Wang and Hanna (Citation1997) found that there is a relationship between age and risk tolerance; whereas, Grable and Lytton (Citation1998) found that the two most influential variables on risk tolerance are age and gender. Grable and Lytton continued with research in the field of financial risk tolerance and found that other factors such as marital status, education level, financial knowledge, income level, occupation and economic expectations also have an impact on the level of risk investors are willing to tolerate. In contradiction to the previous findings, Grable and Joo (Citation2000) emphasise in their research that gender, marital status and age are not considered important influences.
Income and wealth according to Massol and Molines (Citation2015) are considered to be interconnected components which have a positive relationship with risk tolerance. It is concluded by a study of Kannadhasan (Citation2015) that individuals tend to save some portion of their income with the aim of increased wealth. It is believed that individuals with higher income levels will be able to meet financial obligations due to having sufficient resources (O’Neil, Citation1996). In the study of Irwin (Citation1993) confirmed that individuals with stable and predictable income tend to be more risk-tolerant than individuals with unstable and unpredictable income. These results were confirmed in the South African context by Van Schalkwyk (Citation2012); Mabalane (Citation2015); Dickason (Citation2017); Van den Bergh (Citation2018); Ferreira and Dickason-Koekemoer (Citation2018c). The accumulation phase is one of the most important stages as investors can make use of a longer investment horizon as it can be expected that they still have time to recover investment amounts lost in risky investments (Brown & Reilly, Citation2012). The potential earnings on the smallest investment amounts in risky high return assets over the long investment period have the potential of generating massive returns when considering the effects of compounding interest (Mpofu et al., Citation2010).
Irwin (Citation1993) states that young people are more risk-tolerant than older people. It is believed that older people have time constraints to recover from financial losses due to making inaccurate investment decisions (Grable, Citation1997). Therefore, young people are willing to take on more financial risk as they have more time to recover from financial losses experienced due to inaccurate investment decisions (CitationDickason & Ferreira, 2018a; Gibson et al., Citation2013; Grable & Roszkowski, Citation2008). Coco et al. (Citation2005) found supporting evidence for the investor life cycle which shows that investors tend to move away from riskier investments like equities as they age. The researchers developed a quantitative model to determine how an investor with uncertain labour income would react. The investor has the choice to invest in either a risky, or a riskless asset, and from the results, labour income which represents an implicit risk-free asset becomes less important as the investor aged. The investor adjusts by investing more in the risk-free asset (Coco et al., Citation2005). Another study supporting the notions of the investor life cycle was conducted by Schooling and Worden (Citation1999) who confirmed that investors base their investment decisions on individual time-horizons and the amount of risk they are willing to tolerate. In contrary to the above, researchers such as Botwinick (Citation1966), Vroom and Pahl (Citation1971), Baker and Haslem (Citation1974), Okun and DiVesta (Citation1976), Morin and Suarez (Citation1983), Hawley and Fuji (Citation1993), Wang and Hanna (Citation1997), Grable (Citation2000), and Van de Venter et al. (Citation2012) found in their research that older investors are willing to tolerate more risk. Findings from a study conducted by Gomes and Michaelides (Citation2005) investigated the low numbers of stock investments in America. The findings suggest that contrary to the theory, not all younger investors had the majority of their portfolios invested in equities. Households that are risk-averse and the elasticity of intertemporal substitution (EIS) is low, do not accumulate enough wealth to enter the equities market during the accumulation phase and only young investors that can overcome the entry barrier would invest in equities (Gomes & Michaelides, Citation2005).
No universal agreement is established as to whether gender, as a demographic factor, influences the level of risk an individual is willing to tolerate. Research done by Higbee and Lafferty (Citation1972), Blume (Citation1978), Coet and McDermott (Citation1979), Rubin and Paul (Citation1979), and Yip (Citation2000) indicates that gender is an important influential factor of risk tolerance. Slovic (Citation1966), Roszkwoski et al. (Citation1993), Hawley and Fuji (Citation1993), Sung and Hanna (Citation1996), Sharma (Citation2006), Rahmawati et al. (Citation2015), Van den Bergh (Citation2018), Dickason and Ferreira (Citation2019), and Lawrenson (Citation2020) all reached a consensus that females take fewer risks than males, thus males are more risk-tolerant than females. Prior studies on gender such as Dickason et al. (Citation2017) found that there are significant differences between how males and females perceive investment. As a result, it was found that male participants are more confident when it comes to investment when compared to female investors. Results from a study conducted by Bayyurt et al. (Citation2013) found that males are more likely to invest in risky investment options compared to females who gravitate towards less risky alternatives.
Cultural differences in terms of values, tastes and preferences can affect risk tolerance levels. The general norm is that White people are willing to tolerate more risk than non-Whites (Sung & Hanna, Citation1996). This norm is based on the accessibility White people have to banks and financial institutions and they are more future-oriented and have more investment opportunities than non-White people. White people, therefore, will portray an attitude of confidence in decision-making skills and their abilities to analyse (MacCrimmon & Wehrung, Citation1986; Zhong & Xiao, Citation1995). In South Africa, a study was conducted between risk tolerance and race. Metherell (Citation2011) found, based on research done, that a significant difference exists between the White and Indian population groups. However, Van Schalkwyk (Citation2012) concludes in his study that African people tend to take higher risks than White people do, thus making African people are more risk-tolerant. These results were once again confirmed by Dickason and Ferreira Citation(2018b).
A study conducted by Bodie et al. (Citation2007) advised that the purpose of the investor life cycle theory should not be to make the investment decision for an individual, but rather to assist with a structure that can be followed by an investor or advisor. Bodie and Treussard (Citation2007) further concluded that life cycle funds, structured around the concepts of the life cycle theory, provide investors with limited investment knowledge with a simpler alternative to conventional investing. The portfolio will be diversified based on the theoretical life cycle phase the investor is in (Bodie & Treussard, Citation2007). Therefore, the objective of this research paper was to analyse the product choice of investors per the risk level considering the investor lifecycle. This research aims to test the general notions of the investor lifecycle and whether it holds firm in the South African banking context.
3. Methodology
The study made use of secondary data provided by a bank that agreed to participate in the study. The bank’s investor data are stored on a relational database and were extracted using a domain-specific data extraction language namely Structured Query Language (SQL). Demographic data like age, race and gender are directly supplied to the bank on account opening by the investors. The bank also keeps a record of the value and types of investment each investor holds and funds flowing through the accounts that the researcher used to determine income levels. The researcher used secondary data as the data reflect actual investment types and values held by the investors of the bank. This eliminates the risk of investors misrepresenting the investments they hold and demographic information when conducting surveys and other primary data collection methods (Kothari, Citation2004). The sample data serves as a snapshot of the investors’ profiles as from the 31st of July 2018. The quantitative research approach and positivism paradigm was selected as the analysis comprised actual numeric and demographic data obtained from the bank.
The population for this study was selected based on convenience as a reputable universal bank in South Africa was chosen based on their willingness to participate. The sample was obtained randomly from the bank’s population to ensure the chosen investors share similar characteristics to the entire population of the bank. The sample was made up of 19 911 investors (n = 19 911). The calculated sample size was determined by the bank to be 20 000 and the stratified random sampling technique was applied. The population data were divided into different strata to ensure the distribution percentages of age, race, gender and income level reflect the distribution per stratum seen in the entire population.
A big part of scientific research is hypothesis testing. By testing a hypothesis, the researcher can determine if the data used or collected support the claim or hypothesis (Kumar Sahu et al., Citation2015). Myatt (Citation2007) mentions two concepts that need to be defined by the researcher before a hypothesis can be tested, namely the null hypothesis (H0) and alternative hypothesis (Ha). The null hypothesis (H0) usually constitutes the opposite claim to what the researcher is trying to proof. If the researcher is trying to proof that there is a correlation, the null hypothesis would be that there is no correlation between the variables (Myatt, Citation2007).The alternative hypothesis (Ha) represents the idea the researcher attempts to proof, or the concept that needs to be tested (Lind et al., Citation2006). A third concept that needs to be understood in order to choose which hypothesis to conclude and which one to reject is the level of significance. The most popular and accepted significance levels are 1 percent, 5 percent and 10 percent (Woodbury, Citation2002). The significance level represents the level of uncertainty the researcher is willing to take if the wrong hypothesis is accepted (Lind et al., Citation2006). The following hypotheses were formulated to achieve the primary objective:
Null hypothesis (): The demographic factors have no significant impact on investment product selection.
Alternative hypothesis (): The demographic factors have a significant impact on investment product selection.
4. Statistical analysis
Linear and multiple regression analysis were used to determine if there is a relationship between the different demographic factors used in the analysis set to a confidence level of 95 percent. Linear regression attempts to model the relationship between a dependent variable and an independent variable on a straight line (Woodbury, Citation2002). Apart from being useful to explain relationships between dependent and independent variables, linear regression is often used in research to predict and forecast the effects changes in the independent variable has on the dependent variable (Gujarati & Porter, Citation2010). Salvatore and Reagle (Citation2002) provide the linear regression formula as:
Where represents the dependent variable.
represents the intercept of the sample dependent variable while
is the sample scope coefficient. The symbol
represents the independent variable and
is the error term. When conducting a regression analysis, there are a number of outputs received from the statistics tool used. One of the most useful measures is the R-square of the model that measures the goodness of fit. It provides the percentage of variance that can be explained by the model (Gujarati & Porter, Citation2010). The researcher used linear regression on four different occasions with age as the independent variable and total investment value, cash value, equities value and unit trust value as the dependent variables. The null hypothesis was formulated as:
If the null hypothesis is concluded it indicates that there is no linear relationship between the dependent and independent variables. The alternative hypothesis was formulated as:
If the alternative hypothesis is concluded it indicates that there is a linear relationship between the dependent and independent variables.
Multiple regression is based on the same underlying principles as linear regression. The difference is that there is now more than one independent variable that is used to determine which of the variables have an impact on the dependent variable (Lind et al., Citation2006). By using elimination techniques, the variables that do not have an impact can be excluded and the only factor influencing the predictive capabilities of the model is included. Variables can be significant on their own, or a combination of variables that are not necessarily significant on their own are significant when used together (Keith, Citation2015). Kothari (Citation2004) gives the basic formula for multiple regression shown as:
Where represents the dependent variable.
represents the intercept of the sample dependent variable while
is the sample scope coefficient for the
th observation.
represents the independent variable for the
th observation and
is the error term (Kothari, Citation2004). Gujarati and Porter (Citation2010) found that unlike a linear regression where the R-square is used to explain how predictive the model is, the adjusted R-square measure is more accurate for multiple regression analysis. Multiple regression was used in the study to establish which of the demographics including age, race, gender and income level are predictive in nature. The model was processed four different times with the aforementioned demographics as independent variables and total investment value, cash value, equities value and unit trust value as the dependent variables. The null hypothesis was formulated as:
Where represents the exclusion restrictions on the model. If the null hypothesis is concluded it indicates that there is no linear relationship between the dependent and independent variables. The alternative hypothesis was formulated as:
If the alternative hypothesis is concluded it indicates that there is a linear relationship between the dependent and independent variables.
4.1. Empirical results
It is essential to understand the behaviour of South African investors to formulate theories on how to market investment products. Therefore, this section analyses the relationship between different demographic factors, the amount being invested, as well as the product types being invested in. The first step in the process was to use descriptive statistics to gain insights into how the total investment amount is distributed among the different products.
From Table , the mean investment amount for the total invested amount is 55 826.70, while the median is only 2 224.90. This is an indication that more investors invest smaller amounts compared to high investment amounts. This is also evident when analysing the skewness of 13.71, which indicates that the distribution is positively skewed to the right. The high kurtosis of 260.66 results in a leptokurtic distribution shape as a normal distribution has a kurtosis of 3. The high variance of 71 115 500 000.00 and a standard deviation of 266 674.86 indicates that the investment amounts fluctuate quite dramatically from the mean value of 55 826.70 (Gujarati & Porter, Citation2010). Similar patterns emerge when analysing individual products. With all three products, the mean invested amounts are much higher than the median, however, the effects are less prevalent with unit trusts. For all three products, the distribution is positively skewed to the right with high kurtosis indicating leptokurtic distribution shapes. Variance and standard deviation are high, especially with unit trusts, indicating the values fluctuate dramatically from the mean value (Gujarati & Porter, Citation2010). The section below place focuses on how each demographic factor influences the total investment amount. The demographic factors include age, gender, race and income level. The first demographic factor analysed was the age of the investors.
Figure 3. Logarithmic scale representation of investors per product type
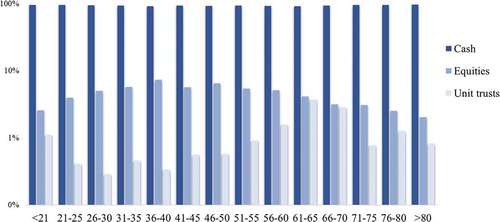
Table 1. Distribution of amounts invested
The researcher found that the amounts invested in cash are much higher than the other two product types being investigated. From Figure a logarithmic scale was used to illustrate the trends and smooth out the large difference between cash investments and the other two products. The popularity of equities in the mid-age ranges can be seen, as well as an increase in the popularity of unit trusts among older investors. The results are similar to that of Gomes and Michaelides (Citation2005) who found low participation in the equities market among young investors. This is in contradiction to the theory of the investor life cycle and the findings of Coco et al. (Citation2005), Grable and Roszkowski (Citation2008), Gibson et al. (Citation2013), and Dickason and Ferreira Citation(2018a), who found investors move away from riskier investments as they age. Linear regression was conducted three times with the independent variable set as age and the dependent variable changed to cash value, equities value and unit trust value.
The results were statistically significant for cash, equities, and unit trusts at a confidence level of 95 percent. Cash had the highest R-square of 0.0319, followed by equities with 0.0022. Unit trusts had the lowest R-square of 0.0019. Table shows the parameter estimates that can be used to predict the amount invested per product based on age. The second demographic factor analysed was gender.
Table 2. Parameter estimates for linear regression
5. Influence of gender on investment product choice
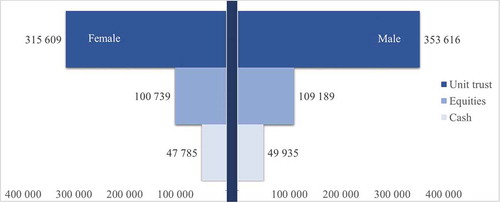
Figure illustrates the average amount invested per gender. Males invest slightly higher average amounts when compared to females. The differences are small, however, indicating that even though more females invest in cash and unit trusts, male investors that also invest in these products invest similar amounts. This supports the findings of Slovic (Citation1966), Roszkwoski et al. (Citation1993), Hawley and Fuji (Citation1993), Sung and Hanna (Citation1996), Sharma (Citation2006), Rahmawati et al. (Citation2015), Van den Bergh (Citation2018), Dickason and Ferreira (Citation2019), and Lawrenson (Citation2020) that female investors invest in less risky investment products. Female investors are also less likely to invest in equities, however, the females that do invest in equities invest similar amounts to their male counterparts. After establishing the influence of age and gender on investments, the researcher focussed on the influence of race on investment product choice.
Figure 4. Average amount invested per product by each gender
From Table , the majority of investors from each race group are invested in cash, with African and Coloured investors 91 percent invested in cash. The lowest amount invested in cash is White investors with 79 percent invested in cash. Indian and other races have 85 and 82 percent invested in cash respectively. African investors have only 1 percent invested in equities and 8 percent in unit trusts. The number of African investors is much higher in equities than unit trusts, suggesting that lower amounts are being invested in equities when compared to unit trusts. Coloured investors are 4 percent invested in equities and 5 percent in unit trusts. The pattern resembles that of African investors with higher average amounts in unit trusts when compared to equities. Indian investors have 13 percent invested in equities and only 2 percent in unit trusts. Other races have 18 percent invested in equities with no unit trust investments. White investors have 16 percent invested in equities and 4 percent in unit trusts. The results support the findings from Gutter and Fontes (Citation2006) that White investors are more likely to hold risky investment products. The final demographic factor analysed was the income level of the investors. These results can be due to the arguments of MacCrimmon and Wehrung (Citation1986) as well as Zhong and Xiao (Citation1995) that White individuals portray an attitude of confidence in decision-making skills and their abilities to analyse markets. However, these results are contrary to previous studies done in the private investment sector where Van Schalkwyk (Citation2012) and Dickason and Ferreira Citation(2018b), who found that African people tend to take higher risks than White people do, thus making African people are more risk-tolerant. These results were once again confirmed by
Figure 5. Investment products per investor based on income level
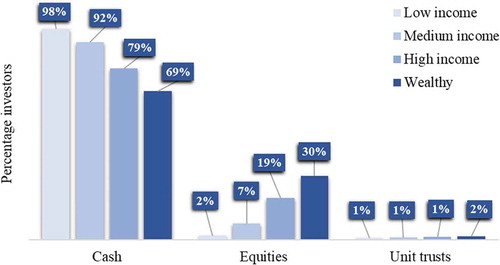
Table 3. Cross-tabulation of race and investment products
Figure illustrates the percentage distribution of the different investor products per income level. The figure clearly illustrates that there is a big difference between the product choices of investors in different income levels. The results show low-income investors gravitate more towards cash investments, with wealthier investors starting to move more towards equities. This suggests that there is a strong correlation between the income level of an investor and the types of investment products they prefer. The results support that of researchers like Gutter and These results were confirmed in the South African context by Carroll (Citation2000), Gutter and Fontes (Citation2006), Van Schalkwyk (Citation2012), and Mabalane (Citation2015); Van den Bergh (Citation2018), who found that wealthier investors are more likely to invest in higher-risk investment products when compared to lower-income investors. To further establish the link between the different investment products and the demographics used in the study, the researcher conducted multiple regression analysis with the investment products as the dependent variables and the demographics as the independent variables. By establishing whether there is a linear relationship between demographic factors and the total amount being invested and the investment amount per product, a predictive model can be built that attempts to identify if there is a relationship between these factors and the amount being invested. The first multiple regression model used the total investment amount as the dependent variable and investor age, race, gender, and income level as independent variables (Table ). A backwards elimination technique was used to disregard factors that were not statistically significant.
The cash model had eleven steps before the most suitable combinations were selected. The model was statistically significant at a 95 percent confidence level and had an adjusted R-square of 0.0825. The adjusted R-square indicates that 8.25 percent of the amount being invested in cash can be predicted based on the available demographics. The results confirm that race on its own has a significant impact on the cash investment amount. Other significant factors include the combination of age*race, gender*income, and age*gender*income. Analysing each parameter individually shows similar results to that of the total investment amount. The model selected White investors as the base parameter with a degree of freedom equal to zero. The model indicated that there is a high significance between the cash investment amount for White investors when compared to African, Coloured, and Indian investors. The “Other” race group is not statistically significant. The combination of age and race also had high significance across all five race categories. With the combination of gender and income level, the model selected wealthy males as the base with degrees of freedom equal to zero. Female investors with low-, medium-, and high-income levels, as well as wealthy, show statistical significance. Male investors with low- and medium income levels also show high statistical significance, while male investors with high-income level are not statistically significant. The final parameter combined age, race and income level with wealthy males chosen as the base with degrees of freedom equal to zero. The combination of gender with age for all income levels was statistically significant.
The equities model conducted thirteen steps before the most relevant demographic factors and combinations were selected. The model is statistically significant at a confidence level of 95 percent and the adjusted R-square is 0.0203. This indicates that 2.03 percent of the investment amounts in equities can be explained by the model. The model highlights that demographics like race and gender do not have statistical significance and that equity investments are more dependent on the income level of the investor and the combination of age and income level. The model selected wealthy investors as the base parameter with zero degrees of freedom. Low income showed high statistical significance, with medium- and high income showing no statistical significance. The combination of age and income level indicated that all income levels showed statistical significance, with the exception of low income, which showed no statistical significance.
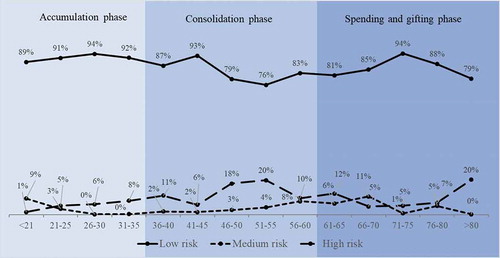
To establish if there were any statistically significant demographic factors to consider, the unit trust model conducted fourteen steps. The resulting model is statistically significant at a 95 percent confidence level, however, the adjusted R-square is extremely low at 0.0019. This indicates that the model only accurately predicts 0.19 percent of the value an investor is expected to invest in a unit trust. The only statistically significant parameter is the age of the investor. The null hypothesis for this study is thus rejected at a confidence level of 95 percent as the demographic factors have a significant impact on the products chosen by the investors. From the analysis conducted thus far, it is clear that the majority of South African investors are more likely to invest in investments that are regarded to be safe. Equity investments are more popular among affluent investors between 40 and 60 years of age. In order to gain more insight as to the level of risk South African investors take per phase on the investor life cycle, the researcher grouped the age bands as laid out by Brown and Reilly (Citation2012).
Table gives an outline of the percentage each phase on the life cycle invests based on risk level. The analysis shows that contrary to the theory, South African investors in the accumulation phase invest primarily in low risk investment products. The phase also has the lowest investment percentage invested in both medium and high risk products. The consolidation phase shows an increase in both medium and high risk investments and is also the phase with the highest amount invested in high risk products. In this phase investors should move away from risky products and invest more in medium and low risk products, however, this is not entirely the case.
Table 4. Parameter results for cash investment amount
Table 5. Parameter results for equities investment amount
Table 6. Parameter results for unit trust investment amount
Table 7. Percentage invested per life cycle phase
The final phase shows investors once again moving away from high risk products. However, this phase does have the highest percentage invested in medium risk products compared to the previous phases. The theory is that investors in the accumulation phase should invest more in high risk investments as the expected investment horizon is much longer. This is, however, not the case, with the bulk of these investors holding low risk investments. High risk investments increase in this phase as investors age towards the consolidation phase. Medium risk investments are seen with investors under the age of 21, however, it decreases to close to zero and slowly starts to increase towards the consolidation phase. The consolidation phase is theorised to be where an investor starts moving more towards medium risk investments as the overall investment horizon is shorter.
The curve initially moves more towards lower risk investments, however, the trend reverses after the age of 40, with investors moving more towards higher risk investments (Figure ). High risk investments reach the highest percentage with investors between the age of 51 and 55. Medium risk investments increase gradually in this phase reaching its second highest percentage on the life cycle at the age level between 56 and 60. Portfolios are more diversified in this phase when compared to the other two phases. The final phase shows a shift back towards low risk investments with low risk reaching a high of 94 percent for the age range 71 to 75. Medium risk investments also become slightly more popular with these investments reaching its highest level at the age level 66 to 70. After the age of 75, the investors again move away from low risk investments and more towards high risk investments, once again reaching its highest point of 20 percent for investors over the age of 80. The results of this study are therefore contrary to the existing theory of the investor lifecycle.
Figure 6. Product risk level according to the investor life cycle
6. Conclusion
The individual investment decision is a complex matter, as numerous factors, ranging from demographic and socioeconomic influence to personal preferences, will ultimately shape the perfect portfolio of investments for every individual. Banks use a number of strategies to determine the risk categories of their clients, to provide them with the most effective investment products to suit individual needs. To determine the risk profile of an investor, banks will need to determine the investor consideration by analysing available demographic information and administering questionnaires where the investor can provide more insight into what they are trying to achieve with the investment. Through these questionnaires, it is also possible to determine the investor’s goals as well as what can be achieved by analysing the financial standings of an investor. Banks can also use the information to determine certain constraints which can impact which investments will be included in the investor’s portfolio. Another characteristic of an investor that needs to be taken into account is the amount of risk that can be tolerated. As no two investors are the same, the best way to measure risk tolerance is from the investor’s own opinions on risk. This highlights the importance of using properly researched questionnaires when building investor portfolios.
To find the best combination of risky assets, banks and financial advisors need a thorough understanding of the investment instruments available and their unique characteristics. The main asset classes that were discussed are cash and other marketable securities, bonds, equities, real estate and alternative investments. These instruments each have unique risks and return characteristics which can be linked to the needs of the investor. Cash and other marketable securities are low risk investments with low returns. Bonds are slightly riskier, however, they can generate higher returns while still considered relatively safe investments. Equities are risky investments that require market research and a keen understanding of how they need to be traded. Real estate is seen as a good investment with promising returns, however, its biggest drawback is the difficulty in buying and selling of the asset. Alternative investments are specialised instruments that do not fall into any of the previous categories. These instruments are generally very complex and carry the highest risk, however, they also have the potential of generating the biggest returns. Allocating the most effective percentages of these assets into a portfolio is the most important part of the portfolio’s construction. Diversification has been proven to reduce the amount of risk in a portfolio without reducing the expected return. By measuring the risk and return of these assets and then measuring how correlated they are with each other, it is possible to determine what percentages of each asset would provide the perfect mix of assets for the individual investor’s unique needs. Several models have been developed which can be used to measure the performance of a portfolio and to find the required mix of risky and riskless assets.
Individuals do not think about investing in the same way. The investor life cycle theory proposes that an investor will go through 4 distinct phases in their lifetime. The initial accumulation phase is where the investor is starting to accumulate their wealth. As there is a long-expected investment horizon, the investor can invest in riskier assets as they have time to recoup any possible losses. At a later stage, the investor will enter the consolidation phase where they have a shorter investment horizon and would rather seek to preserve the value of their investments for retirement. When the time to retire approaches an investor will enter the spending phase, where they will mostly seek out the safest investments as they are no longer accumulating new wealth and rather surviving off existing investments. The final stage is the gifting phase, where investors no longer require a large amount of wealth they accumulated and they start sharing the wealth with family or donating to charity. Investor behaviour is unpredictable, as there are a large number of factors influencing the returns an investment can generate. What makes this even more unpredictable is the fact that individuals do not always make rational decisions. This contradicts the theories laid out by the investor life cycle, as these irrational investors might not behave in the way they should, given their theoretical life cycle stage. Regardless of this, there has been a wealth of research done regarding the validity of the life cycle theory, with the majority supporting the theory. The theory should be used as a guideline for financial advisors to provide investors with the most suitable investments for their unique needs.
The analysis confirmed that each demographic factor played a role in the overall amount being invested. Moreover, investors in the consolidation phase of the investor life cycle held more equity investments, while unit trusts were most popular among older investors. Cash investments were popular for all age groups, which indicates that the majority of South Africans prefer safe investment options. The distributions for gender was found to be similar for male and female investors, however, by running a multiple regression analysis, the researcher determined that gender in combination with the other demographic factors, was a predictive variable. There were also differences in the types of products male and female investors preferred, with male investors showing a higher likelihood to invest in equities. The investment product analysis revealed that as income levels rose, the probability of an investor investing in equities increased, with the highest portion of equity investments found in the wealthy investor segment. Unit trust investments were low across all income levels, however, there was also a slight increase in the value being invested with wealthier investors. The results indicate that lower-income investors prefer safe investment options, while wealthier investors can afford to take more risks. Banks have the means and abilities to gain insights from the vast amounts of data available on their clients. Using these insights, banks can model investor behaviour and promote healthy investment habits. By combining the theory of the investor life cycle, with the data available, banks can improve the returns their clients are expecting and improve client retention. By overlaying all the other data available that could not be supplied for the study due to ethical considerations, even more, accurate predictive models can be built. Banks can include data like regions, education level, marital status, number of dependents, rewards programme levels and a range of other factors that could potentially be indicative of investment needs.
Additional information
Funding
Notes on contributors
D. Kellerman
Mr Dewald Kellerman The researcher specialises in the field of risk management having obtained his Masters degree in this field. With over 5 years’ experience working in analytics for investment marketing in a bank’s wealth and investments division, the researcher’s passion is to use data to promote a culture of investment. Dr Sune Ferreira and Dr Zandri Dickason-Koekemoer specialise in financial risk management having obtained their PhD degrees in this field. Their main focus area is on financial risk tolerance, depositor behaviour, investor behaviour, behavioural finance, and the financial well-being of investors. These researchers have already published several articles in accredited journals regarding this field of interest.
References
- Achmed, J. U. (2011). Services rendered by commercial bank: A customer oriented empirical evidence from State Bank of India. Management Convergence, 1(2), 63–20. doi: 10.1.1.836.8033
- Baker, H. K., & Haslem, J. A. (1974). The impact of investor socioeconomic characteristics on risk and return preferences. Journal of Business Research, 2(1), 469–476.
- Barclays Plc. 2018. Assessing your risk profile. Retrieved June 4, 2018, from https://wealth.barclays.com/en_gb/home/international-banking/insight-research/your-financial-life/assessing-your-risk-profile.html
- Bayyurt, N., Karışık, V., & Coşkun, A. (2013). Gender differences in investment preferences. European Journal of Economic and Political Studies, 6(1), 71–84.
- Berger, A. N. (2003). The economic effects of technological progress: evidence from the banking industry. Journal of Money, Credit, and Banking, 35(2), 141–176.
- Blume, M. (1978). The changing role of the individual investor. Wiley.
- Bodie, Z. (2015). Thoughts on the future: Life-cycle investing in theory and practice. Financial Analysts Journal, 71(1), 43–48. https://doi.org/10.2469/faj.v71.n1.6
- Bodie, Z., & Treussard, J. (2007). Making investment choices as simple as possible, but not simpler. Financial Analyst Journal, 63(3), 42–47. https://doi.org/10.2469/faj.v63.n3.4689
- Bodie, Z., Treussard, J., & Willen, P. 2007. The theory of life-cycle saving and investing (Working Paper), Federal Reserve Bank of Boston.
- Botwinick, J. (1966). Cautiousness in advanced age. Journal of Gerontology, 21(3), 347–353. https://doi.org/10.1093/geronj/21.3.347
- Brown, F. K., & Reilly, K. C. (2012). Analysis of investments & management of portfolios (10th ed.). South-Western Cengage Learning.
- Carroll, C. D. 2000. Portfolios of the rich (Working Paper), The National Bureau of Economic Research.
- Chen, I. J., & Popovich, K. (2003). Understanding customer relationship management (CRM): People, process and technology. Business Process Management Journal, 9(5), 672–688. https://doi.org/10.1108/14637150310496758
- Coco, J. F., Gomes, F. J., & Maunhout, P. J. (2005). Consumption and portfolio choice over the life cycle. The Review of Financial Studies, 18(2), 491–533. https://doi.org/10.1093/rfs/hhi017
- Coet, L. J., & McDermott, P. J. (1979). Sex, instructional set, and group make-up: Orgasmic and situational factors influencing risk-taking. Psychological Reports, 44(1), 1283–1294. https://doi.org/10.2466/pr0.1979.44.3c.1283
- Daks, M. (2018). Banking on technology: Artificial intelligence helping banks get smarter. NJBIZ, 31(7), 10–11.
- Dickason, Z., & Ferreira, S. (2018a). The effect of age and gender on financial risk tolerance of South African investors. Investment Management and Financial Innovations, 15(2), 1–8. https://doi.org/10.21511/imfi.15(2).2018.09
- Dickason, Z., & Ferreira, S. J. (2018b). The effect of gender and ethnicity on financial risk tolerance in South African. Gender & Behaviour, 16(1), 10851–10862.
- Dickason, Z., & Ferreira, S. J. (2019). Risk tolerance of South African investors: Marital status and gender. Gender & Behaviour, 17(2), 12999–13006.
- Dickason, Z., Nel, I., & Ferreira, S. (2017). Gender: Behavioural finance and satisfaction of life. Gender and Behaviour, 15(3), 9550–9559.
- Dickason-Koekemoer, Z., & Ferreira, S. (2018c). Subjective Risk Tolerance of South African Investors. Journal of Economics and Behavioral Studies, 10(6 6(J)), 286–294. doi:10.22610/jebs.v10i6(J)
- EY (Ernst & Young). 2010. Understanding client behaviour in retail banking. Retrieved September 2, 2018, from https://www.ey.com/Publication/vwLUAssets/Understanding_client_behavior_in_retail_banking_-_February_2010/$FILE/EY_Understanding_client_behavior_in_retail_banking_-_February_2010.pdf
- EY (Ernst & Young). 2014. Big data – changing the way business compete and operate. Retrieved September 16, 2019, from https://www.ey.com/Publication/vwLUAssets/EY_-_Big_data:_changing_the_way_businesses_operate/%24FILE/EY-Insights-on-GRC-Big-data.pdf
- Gibson, R., Michayluk, D., & Van de Venter, G. (2013). Financial risk tolerance: An analysis of unexplored factors. Financial Services Review, 22(1), 23–50.
- Goddard, J., & Wilson, J. O. S. (2016). Banking: A very short introduction (1st ed.). Oxford University Press.
- Gomes, F., & Michaelides, A. (2005). Optimial life-cycle asset allocation: Understanding the empirical evidence. The Journal of Finance, 60(2), 869–904. https://doi.org/10.1111/j.1540-6261.2005.00749.x
- Grable, J. E. 1997. Investor risk tolerance: Testing the efficacy of demographics as differentiating and classifying factors [Thesis-Phd]. Blacksburg:.
- Grable, J. E. (2000). Financial risk tolerance and additional factors that affect risk taking in everyday money matters. Journal of Business and Psychology, 14(2), 625–630. https://doi.org/10.1023/A:1022994314982
- Grable, J. E., & Joo, S. (2000). A cross-disciplinary examination of financial risk tolerance. Consumer Interests Annual, 46(2), 151–157.
- Grable, J. E., & Joo, S. (2004). Environmental and bio psychosocial factors associated with financial risk tolerance. Journal of Financial Counselling and Planning, 15(1), 73–82.
- Grable, J. E., & Lytton, R. H. (1998). Investor risk tolerance: Testing the efficacy of demographics as differentiating and classifying factors. Financial Counselling and Planning, 9(1), 61–73.
- Grable, J. E., & Roszkowski, M. J. (2008). The influence of mood on the willingness to take financial risks. Journal of Risk Research, 11(7), 905–923. https://doi.org/10.1080/13669870802090390
- Gujarati, D. N., & Porter, D. C. (2010). Essentials of econometrics (4th ed.). McGraw-Hill/Irwin.
- Gutter, M. S., & Fontes, A. (2006). Racial differences in risky asset ownership: A two-stage model of the investment decision-making process. Financial Counselling and Planning, 17(2), 64–78.
- Hao, M. (2000). Competitive advantage: Kinetic and positional. Business Horizons, 43(1), 53–64. https://doi.org/10.1016/S0007-6813(00)87388-7
- Harlow, W. V., & Brown, K. C. (1990). Understanding and assessing financial risk tolerance: A biological perspective. Financial Analyst Journal, 46(6), 50–80.
- Hawley, C. B., & Fuji, E. T. (1993). An empirical analysis of preferences for financial risk: Further evidence on the Friedman-Savage model. Journal of Post Keynesian Economics, 16(1), 197–204. https://doi.org/10.1080/01603477.1993.11489978
- Higbee, K. L., & Lafferty, T. (1972). Relationships among risk preferences, importance, and control. The Journal of Psychology, 81(1), 249–251. https://doi.org/10.1080/00223980.1972.9916946
- Hofacker, C. F., Malthouse, E. C., & Sultan, F. (2016). Big data and consumer behaviour: Imminent opportunities. Journal of Consumer Marketing, 33(2), 89–97. https://doi.org/10.1108/JCM-04-2015-1399
- Irwin, C. E. (1993). Adolescence and risk taking: How are they related? In N. J. Bell & R. W. Bell (Eds.), Adolescent risk taking (pp. 7–28). SAGE.
- Jagongo, A., & Mutswenje, V. S. (2014). A survey of the factors influencing investment decisions: The case of individual investors at the NSE. International Journal of Humanities and Social Sciences, 4(4), 92–102.
- Kannadhasan, M. (2015). Retail investors’ financial risk tolerance and their risk-taking behaviour: The role of demographics as differentiating and classifying factors. IIMB Management Review, 27(1), 175–184. https://doi.org/10.1016/j.iimb.2015.06.004
- Keith, T. (2015). Multiple regression and beyond. An introduction to multiple regression and structural equation modelling (2nd ed.). Routledge.
- Kellerman, D. 2019. Analysing the investor life cycle in a South African universal bank [MA – Dissertation]. North-West University:.
- Kitchens, B., Dobolyi, D., Li, J., & Abbasi, A. (2018). Advanced customer analytics: Strategic value through integration of relationship-oriented Big Data. Journal of Management Information Systems, 35(2), 540–574. https://doi.org/10.1080/07421222.2018.1451957
- Kothari, C. R. (2004). Research methodology: Methods and techniques (2nd ed.). New Age International Ltd. Publishers.
- Kumar Sahu, P., Ranjan Pal, S., & Kumar Das, A. (2015). Estimation and interferential statistics (1st ed.). Springer.
- Larkin, C., Lucey, B. M., & Mulholland, M. (2013). Risk tolerance and demographic characteristics: Preliminary Irish evidence. Financial Services Review, 22(1), 1–26.
- Lawrenson, J. 2020. Modelling financial risk tolerance of female South African investors [Thesis-PhD]. NWU.
- Lee, I. (2017). Big Data: Dimensions, evolution, impacts, and challenges. Business Horizons, 60(3), 293–303. https://doi.org/10.1016/j.bushor.2017.01.004
- Lind, D. A., Marchal, W. G., & Wathen, S. A. (2006). Basic statistics for business and economics (5th ed.). McGraw-Hill.
- Mabalane, M. D. 2015. Cultural and demographic differences in financial risk tolerance. [Dissertation-Masters]. University of Pretoria.
- MacCrimmon, K. R., & Wehrung, D. A. (1986). Taking risks. The Free Press.
- Massol, Y., & Molines, A. 2015. Determinants of risk tolerance and investment behaviour: A study of French and Swedish business school students. [Dissertation-MSc]. Umeå School of Business and Economics (USBE).
- Matthews, K., & Thompson, J. (2005). The economics of banking (1st ed.). John Wiley & Sons Ltd.
- Mavundza, B. 2018, May 16. Business Insider SA. You can now open an FNB account with a selfie. We tried it. Retrieved August 9, 2019, from https://www.businessinsider.co.za/you-can-now-open-an-fnb-account-with-a-selfie-heres-how-it-works-2018-5
- Metherell, C. 2011. The impact of demographic factors on subjective financial risk tolerance: A South African study [Thesis-Masters]. UKZN.
- Morin, R. A., & Suarez, A. F. (1983). Risk aversion revisited. Journal of Finance, 38(1), 1201–1216.
- Mostert, P., & Lotz, O. (2010). Marketing management: Changes and challenges in South Africa (1st ed.). Mustart Housing Marketing.
- Mpofu, R. T., de Beer, J. D., Nortjé, A., & van de Venter, T. W. G. (2010). Investment management (3rd ed.). Van Schaik Publishers.
- Myatt, G. J. (2007). Making sense of data: A practical guide to exploratory data analysis and data mining (1st ed.). Wiley & Sons.
- Nogantshi, V. 2015. The hard truth on saving for retirement. Retrieved July 29, 2018, from http://www.nedgroupinvestments.co.za/Insights/InsightDetailsPage/the-hard-truth-on-saving-for-retirement
- O’Neil, B. (1996). Baby boomers at mid-life: Financial planning for 2000 and beyond. Journal of Family and Consumer Sciences, 88(4), 3–8.
- Okun, M. A., & DiVesta, F. J. (1976). Cautiousness in adulthood as a function of age and instructions. Journal of Gerontology, 31(1), 571–576. https://doi.org/10.1093/geronj/31.5.571
- Old, M. (2014). Premiums & problems. 109th ed. Cape Town: Old Mutual
- Rahmawati, M., Kumar, D., Kamuaya, M., Jamil, F., & Muneer, S. (2015). Determinants of the risk tolerance of individual investors. International Journal of Economics and Financial Issues, 12(1), 373–378.
- Rodionov, I. 2017, June 24. Robo-advisors – Should you use them? Moneyweb. Retrieved August 5, 2018, from https://www.moneyweb.co.za/news-fast-news/robo-advisors-should-you-use-them/
- Roszkwoski, M. J., Snelbecker, G. E., & Leimberg, S. R. (1993). Risk tolerance and risk aversion. The Tools and Techniques of Financial Planning, 4(1), 213–225.
- Rubin, P. H., & Paul, C. W. (1979). An evolutionary model of tastes for risk. Economici Inquiry, 17(4), 585–596. https://doi.org/10.1111/j.1465-7295.1979.tb00549.x
- Saleem, Z. & Rashid, K. (2011). Relationship between customer satisfaction and mobile banking adoption in Pakistan. International Journal of Trade, Economics and Finance, 2(6), 537–544 doi:10.7763/IJTEF.2011.V2.162
- Salvatore, D., & Reagle, D. (2002). Statistics and econometrics (2nd ed.). McGraw-Hill.
- Schooling, D. K., & Worden, D. D. (1999). Investors’ asset allocation versus life cycle funds. Financial Analyst Journal, 55(5), 37–43. https://doi.org/10.2469/faj.v55.n5.2297
- Seetharaman, A., Niranjan, I., Patwa, N., & Kejriwal, A. (2017). A study of the factors affecting the choice of investment portfolio by individual investors in Singapore. Accounting and Finance Research, 6(3), 153–168. https://doi.org/10.5430/afr.v6n3P153
- Sharma, K. (2006). An insight into determinants of financial risk tolerance. SCMS Journal of Indian Management, 11(3), 12–23.
- Slovic, P. (1966). Risk-taking in children: Age and sex differences. Child Development, 37(4), 169–176. https://doi.org/10.2307/1126437
- Sulaiman, E. K. (2012). An empirical analysis of financial risk tolerance and demographic features of individual investors. Procedia Economics and Finance, 2, 109–115.
- Sung, J., & Hanna, S. D. (1996). Factors related to risk tolerance. Financial Counseling and Planning, 7(1), 11–19.N.
- Trone, D. B., Allbright, W. R., & Taylor, P. R. (1996). The management of investment decisions. Irwin.
- Van de Venter, G., Michayluk, D., & Davey, G. (2012). A longitudinal study of financial risk tolerance. Journal of Economic Psychology, 33(1), 794–800. https://doi.org/10.1016/j.joep.2012.03.001
- Van den Bergh, A. 2018. Analysing risk tolerance during the investor lifecycle [Thesis-Masters]. NWU.
- Van Schalkwyk, C. H. 2012. Member choice in a defined benefit contribution pension plan: Decision-making factors [Unpublished Thesis-PhD]. University of Johannesburg.
- Vroom, V. H., & Pahl, B. (1971). Relationship between age and risk taking among managers. Journal of Applied Psychology, 55(2), 399–405.
- Wang, H., & Hanna, S. (1997). Does risk tolerance decrease with age? Financial Counselling and Planning, 8(2), 27–32.
- Woodbury, G. (2002). An introduction to statistics (1st ed.). Duxbury Tomson Learning.
- Yip, U. Y. 2000. Financial risk tolerance: A state or a trait? [Thesis-Masters]. University of New South Wales.
- Zhong, L. X., & Xiao, J. J. (1995). Determinants of family bond and stock holdings. Financial Counseling and Planning, 6(1), 107–114.
- Ziady, H. 2017, June 21. How banks are moving to a digital future. Business Day.Retrieved August 5, 2019, from https://www.businesslive.co.za/bd/companies/financial-services/2017-06-21-how-banks-are-moving-to-a-digital-future/