
 ?Mathematical formulae have been encoded as MathML and are displayed in this HTML version using MathJax in order to improve their display. Uncheck the box to turn MathJax off. This feature requires Javascript. Click on a formula to zoom.
Abstract
By combining Empirical Distribution Approach (EDA) and Discretionary Accruals Approach (DAA) with data including 2,949 observations of 295 Vietnamese listed companies from 2006 to 2016, we provide evidence that the firms have conducted earnings management behavior to avoid losses but have not committed earnings management behavior to avoid earnings decreases. The evidence indicates that the firms conducting earnings management behavior to avoid losses account for from 4.88% to 13.76% of the whole sample and account for from 49.6% to 73.6% of negative earnings observations. In addition, we find that the changes in working capital are a common tool for managers to conduct earnings management behavior to avoid losses. Furthermore, by removing discretionary accruals from earnings, we also confirm that managers have used discretionary accruals as a tool to manipulate reported earnings upward to avoid losses.
PUBLIC INTEREST STATEMENT
Corporate earnings are the top concern of shareholders and related parties such as investors, credit institutions, and even state agencies. Stakeholders use earnings information to make their decisions. Therefore, the practice of manipulating earnings to avoid losses conducted by managers may affect the decisions of stakeholders, thereby affecting the entire financial market. This study demonstrates the existence of earnings management to avoid losses in Vietnam and shows that this behavior is subject to managers’ manipulation of earnings. This research can be further developed by exploring the factors that influence earnings management behavior to avoid losses. Such a study would help readers get more insights into earnings management.
1. Introduction
Earnings management to avoid earnings decreases and losses is an important motivation for managers. A zero change in earnings or zero earnings are a concern as these are two natural reference points for decision-makers in the market. All over the world, many authors have studied earnings management to avoid earnings decreases and losses: Burgstahler and Dichev (Citation1997), Suda and Shuto (Citation2005), Holland and Ramsay (Citation2003), and Schøler (Citation2005), … Almost all the results of these studies suggest that firms manage earnings to avoid earnings decreases and losses. This study is motivated by two contrary ideas. Firstly, in Vietnam, the market tends to be short term and so, sensitive to reported earnings decreases and losses. In addition, the incentive schemes for management in listed companies are often tied to reported earnings. These facts may induce managers to involve in earnings management to avoid earnings decreases and losses. However, the situation in Vietnam may reflect a different case where market participants may underestimate accounting numbers due to short-term orientation and the quality issue of accounting numbers. At the same time, the degree of response to earnings decrease of stakeholders may not be similar to that in a developed market. Therefore, this study expects to provide distinctive evidence on earnings-increasing management around the two reference points which may affect the value perceived by investors in the Vietnamese market.
Recently, Degiannakis et al. (Citation2017) with an analysis of 188 listed companies in the period of 2006–2013 also proved the existence of earnings management to avoid earnings decreases and losses in Croatia. In addition, through the histograms of non-discretionary earnings and non-discretionary change in earnings, this study showed the influence of discretionary accruals on earnings management to avoid earnings decreases and losses where the distribution of non-discretionary earnings and non-discretionary change in earnings are relatively smooth.
By combining Empirical Distribution Approach (EDA) (Burgstahler & Dichev, Citation1997; Suda & Shuto, Citation2005) and Discretionary Accruals Approach (DAA) (Degiannakis et al., Citation2017; Suda & Shuto, Citation2005) with data including 2,949 observations of 295 companies listed on the stock market of Vietnam from 2007 to 2016, this study, firstly, provided evidence that the companies have conducted earnings management behavior to avoid losses but have not conducted earnings management behavior to avoid earnings decreases. Secondly, this study finds that discretionary accruals affect earnings management behavior to avoid losses of Vietnamese listed companies, or in other words, the companies’ managers have used discretionary accruals as a tool to manipulate reported earnings to avoid losses.
This study provides more evidence on earnings management to avoid earnings decreases and losses in an emerging market context. The results of previous studies need to be examined in the context of a market characterized by short-termism and volatility. The research results reflect the influence of Vietnamese market characteristics and the principal–agent relationship. The results offer financial reporting and corporate governance policy implications. If earnings management to avoid earnings decreases and losses are prevalent, this would increase stakeholders’ awareness in decision-making and more stringent requirements may apply to information disclosure and contract covenants.
Section 2 presents a literature review of prior studies and explains the theoretical basis and the research method of this study. Section 3 explores and discusses the results. Listed firms mainly use changes in working capital or operating accruals to conduct earnings management to avoid losses. However, firms do not necessarily use cash flow from operations to manipulate earnings to avoid losses. The results of this study contrast to prior studies in some aspects. Finally, section 4 draws conclusion and implications, and suggestions for further research.
2. Literature review, theoretical basis and research method
2.1. Literature review
Over the past two decades, researchers have increased their interest in the topic of earnings management. According to Healy and Wahlen (Citation1999, p. 368): “Earnings management occurs when managers use judgment in financial reporting and in structuring transactions to alter financial reports to either mislead some stakeholders about the underlying economic performance of the company or to influence contractual outcomes that depend on reported accounting numbers”.
Earnings management to avoid earnings decreases and losses are significant concerns of managers. This is because these are two reference points—the ultimate limits which ensure minimizing the impact on company value as well as meeting contractual terms based on accounting numbers. Consistent with Healy and Wahlen (Citation1999), this type of earnings management can prevent stakeholders from taking adverse actions against management. To study this topic, researchers often use Empirical Distribution Approach (EDA) and Discretionary Accruals Approach (DAA). Studies on earnings management to avoid earnings decreases and losses often implement EDA by constructing histograms of scaled change in earnings (SCE) and scaled earnings (SE) visually to prove that companies have conducted earnings management behavior to avoid earnings decreases and losses. In addition, some studies also supplement DAA by using a regression model of discretionary accruals to analyze more deeply the causes as well as the factors and components that affect earnings management to avoid earnings decreases and losses.
According to EDA, researchers construct histograms of SCE and SE. Through the concentration of observations around zero of SCE and around zero of SE, they can conclude whether or not companies conduct earnings management to avoid earnings decreases and losses. There have been many authors studying earnings management behavior to avoid earnings decreases and losses such as Burgstahler and Dichev (Citation1997), Suda and Shuto (Citation2005), Holland and Ramsay (Citation2003), Saleh et al. (Citation2005), and Burgstahler and Dichev (Citation1997) introduce the application of EDA to detect earnings management to avoid earnings decreases and losses. By collecting data from US companies from 1976 to 1994 and using histograms of SCE and SE, they found unusually low frequencies of small decreases in earnings and small losses and unusually high frequencies of small increases in earnings and small positive earnings. In addition, through the analysis of the quartiles, the authors found evidence that two components of earnings, cash flow from operations and changes in working capital, are used to achieve increases in earnings. The authors apply two theories, prospect theory and transactions costs theory, to explain the results of the paper. However, the biggest limitation of this study is that the authors have not yet come up with a regression model but only stop at analyzing the histograms of SCE and SE and analysis of the quartiles of two components of earnings are cash flow from operations and changes in working capital. The two reasons given by the authors about the limitations of the article are: firstly, there is little guidance in the accounting literature about the relationship between levels of working capital and levels of earnings; while the results below indicate that the conditional distributions are related to the level of earnings, the relationship is not linear and the variances of the conditional distributions are not constant. Secondly, the theory does not specify where differences in the costs of earnings management will be reflected in the conditional distributions. The research results of Burgstahler and Dichev (Citation1997) are consistent with Hayn (Citation1995), Degeorge et al. (Citation1999), and Burgstahler and Eames (Citation2006).
Inheriting the original research of Burgstahler and Dichev (Citation1997), Saleh et al. (Citation2005) studied earnings management to avoid earnings decreases and losses on the Malaysian stock market. This study was conducted in the context of a developing economy like Malaysia with a small number of observations (more than 4,800 observations), but the main results of this study also indicate that firms in Malaysia have participated in earnings management to avoid earnings decreases and losses. However, the main limitation of this study is that the formula for calculating “standardized differences” is not completely accurate. According to Burgstahler and Dichev (Citation1997), the “standardized difference” has a numerator which is the difference between the actual number of observations in an interval i and the expected number of observations in that interval i, where the expected number of observations in interval i is the average of the number of observations in the two immediately adjacent intervals (interval i-1 and i + 1). However, instead of calculating the expected number of observations in interval i like that, Saleh et al. (Citation2005) calculated “standardized difference” using the next two intervals of interval i (interval i + 1 and i + 2). This calculation may falsify the results of the study, especially it causes a large deviation at point zero of scale earnings or zero of scale change in earnings.
In Australia, Holland and Ramsay (Citation2003) investigated listed companies on the Australian stock market between 1990 and 1997 with approximately 480 companies each year. Similar to the research of Burgstahler and Dichev (Citation1997), the two authors also used EDA to construct histograms of SCE and SE. However, in this study, in order to increase the explanation power, in addition to construct the histograms of SCE and SE, the authors also construct histograms of cash flow from operations and changes of cash flow from operations year by year. The results also reveal that Australian listed companies have managed earnings to avoid losses as well as to avoid earnings decreases. In addition, although using EDA only is useful for determining the level of earnings management, it cannot explain why earnings management behavior occurs or determine whether this behavior happens or not. Besides, this study only focuses on analyzing cash flow from operations, while other components of earnings such as working capital are not explored.
Based on Burgstahler and Dichev (Citation1997), Suda and Shuto (Citation2005) study earnings management behavior to avoid earnings decreases and losses in Japan with over 20,000 observations in the period 1990–2000. In this study, the authors also apply the EDA of Burgstahler and Dichev (Citation1997) to prove that Japanese firms have conducted earnings management to avoid earnings decreases and losses. In the next step, the authors measure discretionary accruals by Kasznik model (Kasznik, Citation1999). Using discretionary accruals, the authors then calculate Pre-Managed Change in Earnings (PM∆E) and Pre-Managed Earnings (PME) by removing discretionary accruals from SCE and SE (scaled change in earnings and scaled earnings, respectively). Through the histograms of PM∆E and PME, the authors demonstrate that managers controlled discretionary accruals to manage earnings in an upward direction when PME is lost or decrease. The results also demonstrate that the prevalence of earnings management is associated with the cost of earnings management. In particular, firms that can manage earnings at low cost are more likely to manage earnings to move from negative PME to positive post-managed earnings. This is the first study to develop both EDA and DAA approaches in the research of earnings management to avoid earnings decreases and losses. Peasnell et al. (Citation2000) also provide evidence of accrual management to avoid earnings losses and earnings declines.
Schøler (Citation2005) investigates earnings management to avoid earnings decreases and losses at firms in the Danish market. The author uses Jones model (Jones, Citation1991) to estimate discretionary accruals of more than 2,200 observations from 1983 to 2002. The findings also reflect that firms in Denmark have also conducted in earnings management to avoid earnings decreases and losses, which is proved by the unusually low frequencies of small decreases in earnings and small losses and unusually high frequencies of small increases in earnings and small positive income. Furthermore, an analysis of the quartiles of beginning-of-year current assets and beginning-of-year current liabilities shows that all of their components have the tendency to go up at zero of SE or zero of SCE, especially the two items—inventory and accounts payable, which have the most dramatic changes (the highest slope). In addition, managers utilize discretionary accruals to report earnings changes upward when the changes of pre-management earnings reflect a decrease in earnings, and to report earnings changes downward when the changes of pre-management earnings were upward extremely. This study is divided into two periods: before and after the change of accounting regulations in Denmark (which took place in 1993). The results show that the change of accounting regulations in Denmark does not affect the results regarding firms’ earnings management to avoid earnings decreases and losses. However, the limitation of this study is that the number of observations in this study is small so the findings are not highly representative.
Degiannakis et al. (Citation2017) with the analysis of 188 listed companies in the period of 2006–2013 also proves the existence of earnings management to avoid earnings decreases and losses of listed companies in Croatia. This study takes the same approach as that of Suda and Shuto (Citation2005). Similar to Suda and Shuto (Citation2005), after proving the existence of earnings management to avoid earnings decreases and losses by histograms of SCE and SE, the authors also calculate two new variables, non-discretionary change in earnings and non-discretionary earnings, by removing discretionary accruals (estimated by two models—Modified Jones (Dechow et al., Citation1995) and Kothari et al. (Citation2005)) from SCE and SE. Moreover, for a more visual view, the histograms of non-discretionary change in earnings and non-discretionary earnings are constructed. After excluding discretionary accruals from earnings and the change in earnings, the histograms minimise discontinuities around zero of earnings and zero of change in earnings (i.e. the histograms are relatively smooth). The authors conclude that discretionary accruals have an effect on earnings management behavior to avoid earnings decreases and losses. In other words, managers have used discretionary accruals as a tool to manipulate reported earnings in an upward direction to avoid earnings decreases and losses.
2.2. Theoretical basis
2.2.1. The transactions costs theory
According to this theory, companies are a particular form of organization for management, exchange or “transaction” between one party and another (Coase, Citation1991). Bowen et al. (Citation1995) assumed that firms with higher earnings face lower costs in transactions with stakeholders, and therefore, have incentives to report higher earnings, such as:
Customers are willing to pay a higher price for goods because the firm is assumed more likely to honor implicit warranty and service commitments.
Suppliers offer better terms, both because the firm is more likely to make payments due for current purchases and because the firm is more likely to make larger future purchases.
Lenders offer better terms because the firm is less likely to either default or delay loan payments.
Valuable employees are less likely either to leave or to demand higher salaries to stay.
2.2.2. The prospect theory
This theory was developed by Kahneman and Tversky (Citation1979). This theory assumes that managers always make their decisions with respect to a reference point, rather than from absolute levels of earnings. This theory assumes that the greatest benefit occurs when moving from a relative or absolute loss to a benefit. In other words, the individual benefits are the steepest around the property reference points. Different decision makers will have different reference points. So, if profit margins or gains in profit are a reference point in their thinking (and those of the stakeholders,) then they will find ways to increase it (assuming the cost of earnings management is constant) to change the perception of stakeholders.
2.3. Research methodology
2.3.1. Research methodology
In this study, we follow the approach of Suda and Shuto (Citation2005) to combine Empirical Distribution Approach (EDA) and Discretionary Accruals Approach (DAA) to measure and analyze research results. Firstly, we will construct histograms of SCE and SE of 2,949 observations of 295 Vietnamese listed companies in the period 2006–2016 in order to demonstrate that firms have conducted earnings management to avoid earnings decreases and losses. We will then construct histograms of PME and PM∆E to evaluate whether managers of Vietnamese listed companies use discretionary accruals to manage earnings in an upward direction to avoid earnings decreases and losses or not.
shows the formula for calculating variables in this study.
Table 1. Measure the variables
To calculate PME and PM∆E, firstly, we estimate discretionary accruals using the model of Kothari et al. (Citation2005). Following Burgstahler and Dichev (Citation1997) and many other studies (Dechow et al., Citation1995; Degiannakis et al., Citation2017; Kothari et al., Citation2005; Suda & Shuto, Citation2005), we first calculate total accruals by the following formula:
where:
TAit: Total accruals for firm i in year t
: Change in the beginning of the year current assets for firm i in year t and is calculated by the change in the sum of accounts receivable (REC), inventory (INV) and other current assets (OTHER_CA).
∆CLit: Change in beginning of the year current liabilities for firm i in year t and is calculated by the change in the sum of accounts payable (PAY), taxes payable (TAX_PAY) and other current liabilities (OTHER_CL)
Depit: Depreciation for firm i in year t.
We then estimate non-discretionary accruals for firm i in year t using the following formula:
where:
NDAit: Non discretionary accruals for firm i in year t,
Ait-1: Total assets for firm i in year t-1 are based on book value,
∆REVit: Change in sales revenue for firm i in year t compared with year t-1,
∆RECit: Change in accounts receivable for firm i in year t compared with year t-1,
PPEit: Gross property, plant, and equipment for firm i in year t,
ROAit-1: Return on Assets for firm i in year t.
The coefficients α, β1, β2, β3 are estimated by the following model:
After calculating non-discretionary accruals, we calculate discretionary accruals (discretionary accruals) as follows:
DAit = TAit—NDAit.
Finally, we calculate pre-managed earnings (PME) and pre-managed change in earnings (PM∆E) by the following formula:
PMEit = SEit—DAit
PM∆Eit = SCEit—DAit
PME and PM∆E are part of earnings and change in earnings which are excluded from the influence of discretionary accruals (representing earnings management behavior); therefore, PME and PM∆E are used to determine whether discretionary accruals have an effect on earnings management behavior to avoid earnings decreases and losses of Vietnamese listed companies or not.
By examining the histograms of SCE, SE, PM∆E and PME, we test the following hypotheses:
H1: There is the existence of earnings management to avoid earnings decreases.
H2: There is the existence of earnings management to avoid losses.
H3: Discretionary accruals affect earnings management behavior to avoid earnings decreases (if H1 is accepted).
H4: Discretionary accruals affect earnings management behavior to avoid losses (if H2 is accepted).
Under the null hypotheses, the distributions of SCE, SE, PM∆E and PME are relatively “smooth”, especially at the intervals around zero of SCE, SE, PM∆E and PME. On the level of concentration of observations, our definition of smoothness is that the expected number of observations in any given interval of the distribution (interval i) is the average of the number of observations in the two immediately adjacent intervals (interval i-1 and i + 1). Standardized difference (Fstatistic) is used to test the null hypotheses of H1, H2, H3, H4. According to the null hypotheses of H1, H2, H3, H4, these standardized differences will be distributed approximately normal around zero of SCE, SE, PM∆E and PME.
2.3.2. Research data
The data used in this study are secondary data of 295 firms listed on both Hanoi Stock Exchange and Ho Chi Minh City Stock Exchange from 2006 to 2016. This sample includes all firms that are listed on both Vietnamese stock exchanges and have financial data available during that period. The variables in the study were calculated from the financial statements of the companies in the sample. After eliminating firms short of data, the number of observations satisfying the conditions for analysis for SCE, PM∆E, SE and PME are 2,654, 1,101, 2,949 and 1,946 observations, respectively.
The data in this study are divided by total assets at the end of the year. The benefit of dividing by total assets is to eliminate the influence of firm size on the results of the study, which allows us to have comparative data for comparison as well as assessment among firms of different sizes.
3. Results and discussion
3.1. There is no earnings management to avoid earnings decreases
shows descriptive statistics for all variables. The number of observations for SCE, PM∆E, SE and PME is 2,654, 1,101, 2,949 and 1,946, respectively.
Table 2. Descriptive statistics for all variables
For the entire sample, except for PM∆E, we find that both the mean and the median of all remaining variables are positive. Analyzing the quartiles, we find that only 25% of the quartiles of the variables receive negative values, and all the remaining quartiles receive positive values. This suggests that there are very few negative observations in the studied variables. The standard deviation of PM∆E is greater than SCE (the corresponding values are 0.148046 and 0.110297, respectively), suggest that the values of SCE have a greater concentration than the values of PM∆E. Similarly, the standard deviation of PME is greater than SCE (corresponding values are 0.194737 and 0.104231, respectively), suggest that the values of SE have a greater concentration than the values of PME.
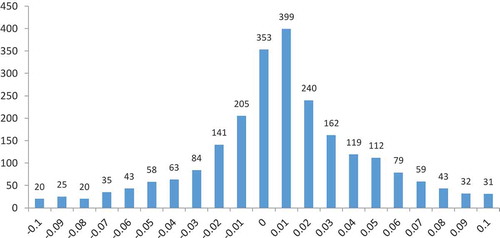
is the histogram of SCE with histogram interval widths of 0.01 for the range −0.1 to +0.1 (the intervals of SCE too far away from zero are not present). We also analyze with different intervals such as 0.005, 0.0075 and get the same results. shows a relatively uniform distribution for both the whole histogram and the intervals near zero. The changes in the earnings of the negative portfolios near zero and positive portfolios near zero are relatively balanced (although slightly deviated towards the positive earnings), in which the interval immediate to the left of zero is 353 observations and the interval immediate to the right of zero is 399 observations. Thus, the difference is negligible. We compare three adjacent negative intervals near zero (−0.03, 0) to three adjacent positive intervals near zero (0, 0.03) with a total of 699 and 801 observations, respectively. The difference is over 100 observations. With this number, it seems that the difference starts to appear. Therefore, for a better analysis, we test the null hypothesis of H1—there is no existence of earnings management to avoid earnings decreases by Fstatistic. The value of Fstatistic for the interval immediately to the left of zero and the interval immediately to the right of zero are 2.48 and 4.81, respectively. Both values are positive, and the difference is negligible, which is consistent with the hypothesis of no earnings management to avoid earnings decreases. Hence, hypothesis H1 for the existence of earnings management to avoid earnings decreases may be rejected.
Figure 1. Histogram of scaled change in earnings interval
According to Burgstahler and Dichev (Citation1997), firms have a stronger incentive to manage their earnings if earnings increased in previous years. Therefore, in order to increase the robustness of the above conclusion, we divide the observations into two groups: group A includes observations of SCE that had a decrease in earnings in the previous year (shown in ); group B includes the observations of the SCE for which the preceding year or two preceding years experienced increases in earnings (shown in ). If incentives to avoid earnings decreases become stronger with the length of the previous run of earnings increases, we expect the distributions in to be different in the direction that the observations in group B () will be concentrated in positive intervals near zero higher than in group A (). Conversely, the concentration of observations at negative intervals near zero of group B will be lower than that of group A.
Figure 2. Histogram of change in earnings interval of year subsequent to an earnings decrease
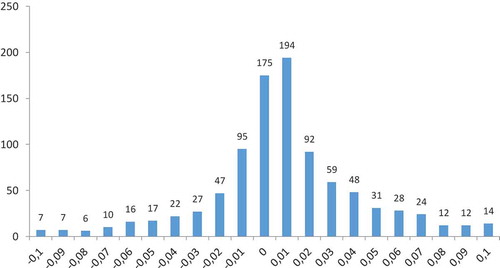
Figure 3. Histogram of change in earnings interval of year subsequent to one or two consecutive years of earnings increases
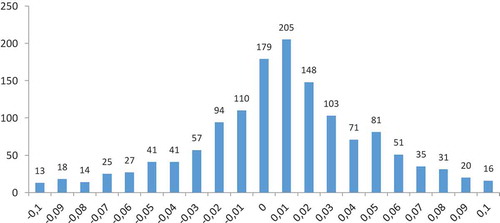
As shown in , the values of Fstatistic for the intervals immediately to the left of zero are 2.17 and 1.44, respectively (corresponding figures for the interval immediately to the right of zero are 4.19 and 2.66, respectively). These results indicate that there is no difference in earnings management to avoid earnings decreases between firms with previous year’s earnings decreases and firms with previous years’ earnings increases.
The above results differ from Burgstahler and Dichev (Citation1997) and other studies. This study shows that, whatever analysis from any aspect is adopted, we can conclude that Vietnamese listed firms do not conduct earnings management behavior to avoid earnings decreases. Hence, hypothesis H1 for the existence of earnings management to avoid earnings decreases may be rejected.
3.2. There is the existence of earnings management to avoid losses
is the histogram of SE with interval widths of 0.005 for the range from −0.07 to +0.17 (the intervals of SE too far away from zero are not present). We also analyze with different intervals such as 0.0075, 0.01 and get the same results. Completely different from , displays a distribution skewed toward the positive earnings. The difference of total observations for the interval immediately to the left of zero and for the interval immediately to the right of zero is so striking: 18 observations versus 130 observations, respectively.
Figure 4. Histogram of scaled earnings interval
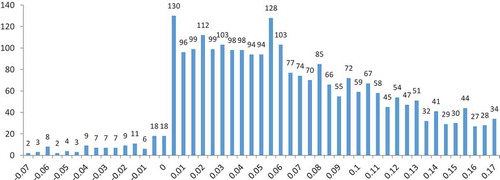
We extend the comparison to the six adjacent negative intervals near zero (−0.03, 0) and the six adjacent positive intervals near zero (0, 0.03). The two sides around zero continue to contrast with each other: 69 versus 639 observations, respectively—the difference is 570 observations. As the width of the intervals increases, the disparity in the distribution of the right and the left of zero becomes greater. The significance of this difference can be tested by Fstatistic, in which the value of Fstatistic for the interval immediately to the left of zero is −7.69 (the corresponding figure for the interval immediately to the right of zero is +5.93). Thus, almost according to any standards, the distribution in (especially for the intervals of earnings around zero) is statistically significant. This suggests that the hypothesis of the non-existence of earnings management to avoid losses may be rejected and hypothesis H2 of firms having earnings management behavior to avoid losses is accepted.
Because the null hypothesis of H2 applies in the absence of earnings management to avoid losses, thus the expectation model used to test the null hypothesis of H2 (where the expected number of observations in an interval is defined as the average of the observed numbers in the two adjacent intervals) is not appropriate for estimating the frequency of earnings management to avoid losses. Therefore, we assume that, if there is no earnings management to avoid losses, the distribution of SE in would be symmetric around 0.03. Thus, the expected number of observations in an interval to the left of 0.03 is assumed to be the observed number in the corresponding interval to the right of 0.03.
According to Burgstahler and Dichev (Citation1997), the estimated number of cases where firms have engaged in earnings management is the difference between the expected and the observed number of observations. On that basis, we estimate the frequency of earnings management to avoid losses for three negative earning intervals of increasing width near zero: (−0.01, 0), (−0.02, 0) and (−0.03, 0). The estimates for the three increasingly broad intervals are 144, 271 and 406, respectively. We provide some basis to evaluate the level of these numbers. First, these estimates are approximately from 4.88% to 13.76% of the whole sample (2,949 observed observations) (the corresponding data in Burgstahler and Dichev (Citation1997) are 0.9%—1.7%). Second, these estimates range from 49.6% to 73.6% of the alleged negative earnings observations (including the observed negative earnings observations plus the estimated number of observations possibly involving in earnings management from negative to positive; the corresponding data in Burgstahler and Dichev (Citation1997) are 3.0%—5.8%). We note that, as the width of the intervals increases, these rates are greater. Based on the above analysis, it is recognized that the earnings management behavior to avoid losses of Vietnamese listed firms is quite popular.
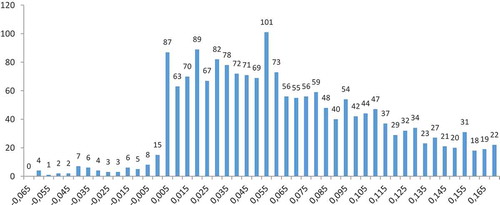
Similar to the case of earnings management to avoid earnings decreases, according to Burgstahler and Dichev (Citation1997), firms may also have a stronger incentive to avoid losses if previous years of earnings were positive or negative. Therefore, in order to further analyze the pressure to avoid losses coming from the preceding string of positive earnings, we again divide the observations into three categories: group 1 includes observations of SE that the previous year suffered losses in earnings (shown in ), group 2 includes the observations of SE for which the preceding year or two preceding years experienced positive earnings (shown in ), group 3 includes the observations of SE for which the three or more preceding years had positive earnings (shown in ). If the motive of earnings management to avoid losses is actually stronger with the length of the preceding string of positive earnings, we expect that the distributions for the three groups in differ in the following pattern: the observations concentrate increasingly higher in the positive intervals near zero, and conversely, the concentration of observations in the negative intervals near zero is lower and lower.
Figure 5. Histogram of scaled earnings interval of year subsequent to a loss
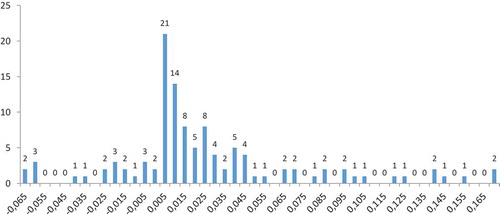
Figure 6. Histogram of scaled earnings interval of year subsequent to 1 or 2 consecutive years of positive earnings
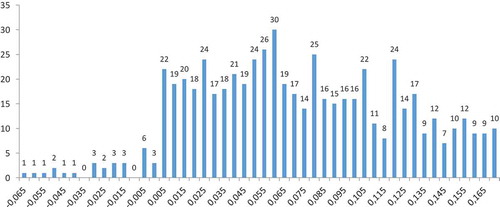
Figure 7. Histogram of scaled earnings interval of year subsequent to three or more consecutive years of positive earnings
For the three groups, the value of Fstatistic for the interval immediately to the left of zero is −3.81, −3.53 and −5.3, respectively (the corresponding figures for the interval immediately to the right of zero are 2.82, 2.13 and 4.75, respectively). The difference of Fstatistic between group 1 and 2 is marginal, which can be verified from . Thus, this provides little evidence of a pattern consistent with the prediction that the pressure of earnings management to avoid losses increases in the length of the previous run of consecutive positive earnings. However, Fstatistic reflects the discontinuity in the immediate interval at zero of earnings but it is also affected by the number of observations of these two intervals. Therefore, we should not focus solely on the number of observations in the two adjacent intervals at zero of earnings but can expand to other intervals near zero. Visually examining the number of observations at close to zero in may further solve this issue. shows that only two intervals to the right of zero have a relatively large number of observations compared to the rest (21 and 14 compared to 8, 5, 8, …). In , it reveals that the number of observations in the right intervals near zero is relatively large and uniform (22, 19, 20, 18, 24, …). This suggests that when comparing the absolute number of observations, the number of observations to the right of zero in is much greater than the corresponding number of observations to the right of . For a more comprehensive view, we continue to compare the relative proportions of observations between the right and left intervals of zero in both . The ratios of the number of observations of six adjacent intervals to the right of zero to the number of observations of six adjacent intervals to the left of zero in are 4.62 and 7.06, respectively. This larger value in indicates that the concentration level of the observations on the right of is larger than in . Thus, the analysis of the number of observations in any aspect (absolute or relative) in provides evidence consistent with the prediction that the pressure of earnings management to avoid losses increases in the length of the previous run of consecutive positive earnings.
In contrast to , moving from , the values of Fstatistic are significantly different for both the interval immediately to the left of zero (−3,53 and −5,3, respectively) and the interval immediately to the right of zero (2.13 and 4.75, respectively) as well. The significant increase in Fstatistic from confirms the expectation that the pressure of earnings management to avoid losses increases in the length of the string of consecutive positive earnings.
Overall, through the above analysis, we obtain evidence of the existence of pressure of earnings management to avoid losses in the length of previous years’ consecutive positive earnings on Vietnamese listed firms. As a result, earnings management to avoid losses increases as the length of positive earnings grows.
3.3. The components of earnings to avoid losses are used by managers
3.3.1. Current assets and current liabilities
According to DeFond and Jiambalvo (Citation1994), Burgstahler and Dichev (Citation1997), manipulation of working capital accruals is a common method of earnings management. Firms with high levels of working capital can be more easily to change accrual level without being noticed so much than firms with low levels of working capital. Consequently, firms with high levels of working capital can find it relatively less costly to manage earnings to avoid losses through changes in working capital than firms with low levels of working capital (Burgstahler & Dichev, Citation1997). In this case, current assets and current liabilities levels can serve as proxies for the cost of earnings management by changing working capital. On that basis, pre-managed levels of current assets and current liabilities for firms in the intervals immediately to the left of zero are expected to be lower and higher in the intervals immediately to the right of zero.
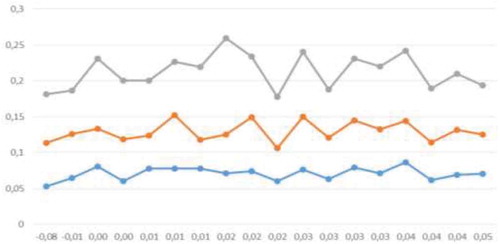
We examine beginning-of-year distributions of current assets and current liabilities to verify whether current assets and current liabilities at the beginning of a year are used to manipulate the earnings of that year or not. The observations are sorted on the earnings variable to form equal-sized portfolios of 75 observations per portfolio. The higher the number of observations in each portfolio is, the more representative it is. However, because our data consist of only 146 observations that have negative earnings, the portfolio formation is most appropriate for the existing data. We also analyze the data with alternative numbers of observations in each portfolio and also obtain similar results. The first portfolio to the right of zero consists of 75 smallest positive earnings observations; the second portfolio to the right of zero consists of 75 next smallest positive earnings, and so on. The portfolios on the left of zero are also constructed similarly. In each of the portfolios, the median of portfolio earnings represented on the horizontal axis, while three quartiles of the distribution of beginning-of-year current assets and current liabilities scaled by the total assets are plotted against the median on the vertical axis.
According to , as expected, both figures show a change in an upward direction when moving from negative to positive, especially for the upper quartiles of the distributions (the slope is getting higher). In particular, the changes of current assets are more pronounced than the corresponding values of current liabilities. For current assets, the larger the quartile with the higher slope when moving from negative to positive earnings. In addition, when going from the second portfolio (−0.08) to the first portfolio (−0.01) of the left of zero, the current asset values shift downward clearly. This indicates that firms that had a higher level of beginning-of-year current assets or current liabilities are more likely to manage earnings from a negative to a positive earnings level. This reflects that changes in working capital might play a role in earnings management to avoid losses.
Figure 8. Three quartiles of the current assets
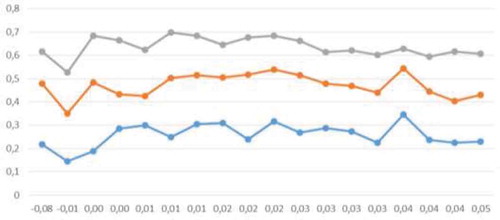
Figure 9. Three quartiles of the current liabilities
3.3.2. Cash flow from operations and changes in working capital
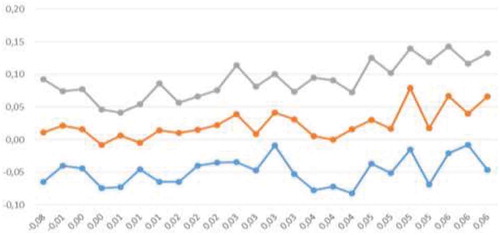
The analysis based on working capital provides ex-ante evidence on earnings management to avoid losses. To provide more evidence, in this section, we implement an ex-post analysis on the components of earnings: cash flow from operations, changes in working capital, and other accruals of year t. Cash flow from operations is taken from financial statements of firms; changes in working capital are defined as working capital at the end of the year minus working capital at the beginning of the year; other accruals are defined as profit after tax minus cash flow from operations and minus changes in working capital. If these components are used to manipulate earnings, we expect that the distribution of these components has a significant increase in the cases of slightly positive earnings when moving from negative earnings portfolios on the left of zero to positive earnings portfolios on the right of zero.
demonstrates the quartiles of cash flow from operations against the medians of earnings portfolios. Inconsistent with the prediction, only the top (the 3rd quartile) quartile of the distribution shifts upward at 0 while the other two quartiles shift downward. In addition, for the first three portfolios, the behavior of the top quartile is completely opposite to the other two quartiles. Before the top quartile shift upward from the left to the right of zero, it tends to shift downward while the other two quartiles go in the opposite direction. This can be explained as follows: firstly, firms that have positive cash flow from operations may have better condition to manage earnings than firms with negative cash flow from operations (which are often more difficult to change cash flows); and secondly, the downward trend of the top quartile before shifting upward to the right of zero suggests that a number of observations involving earnings management, which already moved into the immediate portfolios on the right of zero, may have higher cash flow from operations pre-managed whereas non-earnings management firms own lower cash flow from operations, presumably facing higher costs to adjust their earnings and so, still stay on the left of zero. However, as the middle and the lower quartiles shift downward, the results do not provide clear evidence that firms with large cash flow from operations manipulate earnings to avoid reporting losses. This result is different from previous studies suggesting that companies with high cash flow from operations can use it to manage earnings.
Figure 10. Three quartiles of cash flow from operations
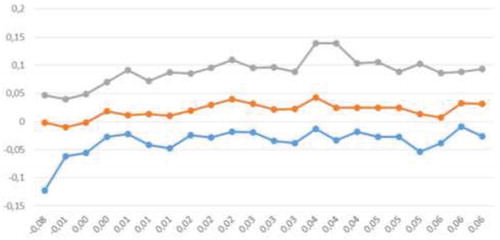
Unlike , for changes in working capital, shows an upward shift in all three quartiles from the left to the right of zero. This result is consistent with previous studies suggesting that firms with high changes in working capital are more likely to manage earnings than firms with low changes in working capital. The upper and the middle quartiles of portfolios of changes in working capital also shift downward before going upward through zero. This result reflects that firms with higher changes in working capital are likely to manage to shift earnings from negative to positive while firms with lower changes in working capital may find it difficult to manage earnings upward. Slightly different, for the lower quartile, there is an upward trend throughout the portfolios on the left of zero. This may be because these portfolios have very large negative values of changes in working capital and possibly just can manage to increase accruals to get closer to and through 0.
Figure 11. Three quartiles of changes in working capital
Similarly, displays the distribution chart of other accruals. Here, other accruals are calculated by subtracting after-tax profit minus cash flow from operations and minus changes in working capital. The results here are also different from previous studies as other accruals shift upward in the upper and middle quartiles when moving from negative to positive earnings. It is noted that not just one, but all the three components of earnings can be used to manipulate earnings. However, managers tend to employ one of the earnings components, i.e. cash flow from operations or changes in working capital or other accruals to distort earnings based on the existing conditions of the components. In addition, the employment of one component may affect the other components, for example, boosting up credit sales and purchases may result in an increase in accruals and decrease in cash flow from operations, disposals of investments may help to inflate earnings in case of difficulty in normal business operations. This reflects the fact that the three components of earnings are interdependent on each other. Therefore, the explanation of the shifts of other accruals should be put into this interdependence of the earnings components. Firstly, the upper quartile of cash flow from operations and the lower quartile of changes in working capital and the lower quartile of other accruals are correlated and so, when moving from negative to positive earnings, the pronounced downward ship of other accruals can be compensated by the upward shift of cash flow from operations and changes in working capital. Secondly, the correlation between the lower and the middle quartiles of cash flow from operations and the middle and the upper quartiles of both changes in working capital and other accruals helps explain the downward shifts of the first and the second quartiles of cash flow from operations. In this case, other accruals and especially changes in working capital are likely used as the main tools to manipulate earnings upward, and consequently, cash flow from operations is at a low level and shift downward.
Figure 12. Three quartiles of other accruals
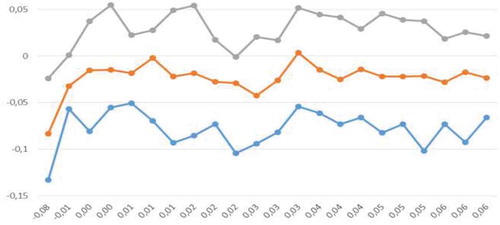
In sum, all the components of earnings may be used to manipulate earnings to avoid losses. Of all the three components, changes in working capital are likely the main component used for the earnings management purpose. This result should be confirmed further by the next analysis.
3.4. The effect of discretionary accruals on earnings management behavior to avoid losses
Continuing with the previous analysis, in this section, we analyze the effect of discretionary accruals on earnings management behavior to avoid losses. Consistent with prior studies, we conjecture that discretionary accruals would play an important role in manipulating earnings to avoid losses. Discretionary accruals are estimated by the model of Kothari et al. (Citation2005). We remove discretionary accruals from reported earnings to recover PME. We construct and examine the distribution of PME. If discretionary accruals are used to distort earnings, then after removing discretionary accruals, the distribution of PME should be smooth or minimize the discontinuity of the observations around zero of PME.
Similar to , is a histogram of PME with interval widths of 0.005 for the range from −0.07 to +0.17 (the intervals of PME too far away from zero are not present). We also analyze with different intervals such as 0.0075, 0.01 and get the same results.
Figure 13. Histogram of Pre-Managed Earnings interval
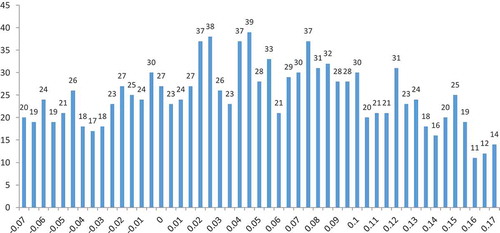
presents a relatively smooth histogram, especially at adjacent intervals at zero of PME. Indeed, quite different from , shows that the observations are distributed almost evenly at intervals, including adjacent intervals at zero of PME, where the number of observations in the immediately adjacent interval to the left of zero is 27 (the corresponding number of observations in the immediately adjacent interval to the right of zero is 23). The difference is just marginal and more interesting when the number of observations tends to decrease when going from negative to positive of PME (27 versus 23). This fact supports the prediction that discretionary accruals have some impact on the reported earnings.
We extend the examination of PME by comparing the six adjacent negative intervals near zero (−0.03, 0) to the six adjacent positive intervals near zero (0, 0.03) with a total of 156 and 175 observations, respectively. In this case, the number of observations on the right of zero is greater than that on the left of zero, but the difference is not significant (19 observations). Note that when the width of the intervals increases, the number of observations should be large enough to be significant. The number of observations in the positive intervals near zero of PME is not so large; therefore, these profit figures may have not been manipulated by managers.
shows the frequency of positive values of SE and PME in growing intervals. For both SE and PME, as the distribution intervals become widened, the frequency of positive values of these two variables increases, in which the minimum and maximum values of SE are, respectively, 86.3% and 91%, while the corresponding values of PME are 45.2% and 55.2%. This suggests that the more the distribution intervals become widened, the more the number of observations possibly involving earnings management increases. Furthermore, when comparing SE with PME in any distribution intervals, the number of positive values of PME is much lower than that of SE (for example, the frequency of positive values of PME and SE in the interval (−0.01, 0.01) account for 45.2% and 86.3%, respectively). This indicates that the frequency of positive observations of PME drops dramatically when we remove discretionary accruals from reported earnings. This corroborates that discretionary accruals are a common tool for managers to adjust reported earnings upward to avoid losses.
Table 3. The frequencies of positive and negative in the intervals
To appropriately determine whether the observations in the two adjacent intervals at zero of PME are smooth (accept or reject hypothesis H4), we calculate Fstatistic of these two intervals. The Fstatistic of the immediately adjacent interval to the left of zero is +0.08 (the corresponding Fstatistic of the right interval of zero is −0.42). The Fstatistic values are not statistically significant. The Fstatistic values change from positive to negative when going from the left to the right of zero reflect the downward trend at 0. This proves that discretionary accruals exert a significant influence on earnings.
In summary, whatever bases are adopted, hypothesis H4 is confirmed. Combining with the above results, we find that earnings management to avoid losses by using discretionary accruals of listed companies in Vietnam is common.
3.5. Comparing the results of this study with the results of previous studies
summarizes and compares the results of previous studies with the results of this study. From , we can see that some studies analyze earnings management under EDA such as Burgstahler and Dichev (Citation1997), Holland and Ramsay (Citation2003), and Saleh et al. (Citation2005) only present histograms of SCE and SE and quartiles of earnings components such as current assets, current liabilities, cash flow from operations, changes in working capital and other accruals without analyzing histograms of PM∆E and PME (because discretionary accruals are not measured). Meanwhile, other studies that analyze earnings management using both EDA and DAA methods focus on examining histograms of SCE, SE, PM∆E and PME but omit inspecting quartiles of the earnings components. Different from previous studies, our study applies both EDA and DAA methods, fully analyzes the histograms of SCE, SE and PME, and fully examines the quartiles of the earnings components. Therefore, in terms of research methods, this study provides a comprehensive research on the topic of earnings management to avoid earnings decreases and losses.
Table 4. Summary of the results of studies on earnings management to avoid earnings decreases and losses
In terms of research results, Burgstahler and Dichev (Citation1997) and other studies have proven the existence of earnings management to avoid earnings decreases and losses in various markets. Different from Burgstahler and Dichev (Citation1997) and other studies, our study finds evidence that Vietnamese listed firms have conducted earnings management behavior to avoid losses but have not conducted earnings management behavior to avoid earnings decreases. We provide here some possible reasons. In the first place, this difference may come from the fact that the size of both Vietnamese listed firms and the stock market are generally small. With small firms, revenue growth and profitability can fluctuate significantly. Therefore, the pressure of managers to increase earnings continuously is much lower than the pressure to avoid losses. Secondly, our research data cover the period 2006–2016. During this period, the world economy experienced an economic crisis in 2008 and needed many years to recover. As a consequence of the general impact of the world economy, it is very difficult for firms in Vietnam to maintain a length of years with continuously increasing earnings. Therefore, shareholders do not put too much pressure on managers regarding continuously increasing earnings over the years.
Contrary to Burgstahler and Dichev (Citation1997) and other studies, we find unclear evidence on the use of cash flow from operations to manipulate earnings to avoid losses. The key method of earnings management to avoid losses conducted by Vietnamese listed firms is the use of changes in working capital or operating accruals. Similar to studies using DAA such as Suda and Shuto (Citation2005) and Degiannakis et al. (Citation2017), our research also shows that discretionary accruals affect earnings management behavior to avoid losses, or in other words, managers of Vietnamese listed firms have used discretionary accruals as a common tool to conduct earnings management to avoid losses.
4. Conclusion and implications, and suggestions for further research
In this study, we apply EDA and DAA with the construction of the distributions of SCE, SE and PME of 295 listed companies in the period 2006–2016. This study provides evidence that listed companies in Vietnam have conducted earnings management behavior to avoid losses but have not conducted earnings management behavior to avoid earnings decreases. The findings indicate that firms with alleged earnings management to avoid losses account for approximately from 4.88% to 13.76% of the whole sample and approximately from 49.6% to 73.6% of the negative earnings observations. By forming portfolios of observations based on the length of the preceding string of earnings, we find that the pressure to commit earnings management increases in the length of the previous run of consecutive positive earnings. Furthermore, concentrating on components of earnings, we also find that changes in working capital are used to inflate earnings while the impact of cash flow from operations on earnings management is unclear. In addition, after removing discretionary accruals from earnings, the results also confirm that managers have used discretionary accruals as a common tool to manipulate reported earnings upward to avoid losses.
Overall, this study is the first research providing evidence of earnings management behavior to avoid earnings decrease and losses conducted by Vietnamese listed firms. Previous studies have focused on developed markets in the US, Japan, Australia and Europe. Whether the conclusions drawn from prior studies can be applied to emerging markets like Vietnam, where the majority is small companies, is a question. In Vietnam, except for this study, there is no research on earnings management behavior to avoid earnings decrease and losses. Thus, this study contributes more insights into earnings management in emerging markets to the vast repository of knowledge in this field.
This study has several limitations. First, this study is implemented with a small sample. Second, this study has not provided a model to analyze the factors that affect earnings management behavior to avoid losses. As a result, we expect that a more extensive quantitative study might be conducted to examine the influence of various corporate governance and firm characteristics on earnings management behavior to avoid earnings decrease and losses of Vietnamese listed firms.
Additional information
Funding
Notes on contributors

Ky Han Tran
Ky Han Tran - Corresponding author. Affiliation: Faculty of Economics & Tourism, Quang Trung University, Vietnam. Phone: (+84) 916 346 499. Email: [email protected].
Nguyen Hung Duong
Nguyen Hung Duong. Affiliation: University of Economics – The University of Danang, Vietnam. Phone: (+84) 905 364 989. Email: [email protected]
We focus on earnings management topic. In this study, we find that earnings management to avoid losses is a prevalent practice of Vietnamese listed firms. This study is part of our research project which focuses on earnings management behavior in the Vietnamese market. Based on this study, we develop this research into exploring the factors affecting earnings management to avoid losses in the Vietnamese market as well as the effect of this practice on stock prices and resource allocation in the economy.
References
- Bowen, R. M., DuCharme, L., & Shores, D. (1995). Stakeholders’ implicit claims and accounting method choice. Journal of Accounting and Economics, 20(3), 255–23. https://doi.org/10.1016/0165-4101(95)00404-1
- Burgstahler, D., & Dichev, I. (1997). Earnings management to avoid earnings decreases and losses. Journal of Accounting and Economics, 24(1), 99–126. https://doi.org/10.1016/S0165-4101(97)00017-7
- Burgstahler, D., & Eames, M. (2006). Management of earnings and analysts’ forecasts to achieve zero and small positive earnings surprises. Journal of Business Finance & Accounting, 33(5–6), 633–652. https://doi.org/10.1111/j.1468-5957.2006.00630.x
- Coase, R. H. (1991). The nature of the firm (1937). The nature of the firm. origins, evolution, and development (pp. 18–33). Oxford: Oxford university press.
- Dechow, P. M., Sloan, R. G., & Sweeney, A. P. (1995). Detecting earnings management. Accounting Review, 70(2), 193–225. https://www.jstor.org/stable/248303
- DeFond, M. L., & Jiambalvo, J. (1994). Debt covenant violation and manipulation of accruals. Journal of Accounting and Economics, 17(1–2), 145–176. https://doi.org/10.1016/0165-4101(94)90008-6
- Degeorge, F., Patel, J., & Zeckhauser, R. (1999). Earnings management to exceed thresholds. The Journal of Business, 72(1), 1–33. https://doi.org/10.1086/209601
- Degiannakis, S. A., Giannopoulos, G., Ibrahim, S., & Rozic, I. (2017). Earnings management to avoid losses and earnings declines in Croatia. Available at SSRN 3259851. https://doi.org/10.1504/IJCEE.2019.100561
- Hayn, C. (1995). The information content of losses. Journal of Accounting and Economics, 20(2), 125–153. https://doi.org/10.1016/0165-4101(95)00397-2
- Healy, P. M., & Wahlen, J. M. (1999). A review of the earnings management literature and its implications for standard setting. Accounting Horizons, 13(4), 365–383. https://doi.org/10.2308/acch.1999.13.4.365
- Holland, D., & Ramsay, A. (2003). Do Australian companies manage earnings to meet simple earnings benchmarks? Accounting & Finance, 43(1), 41–62. https://doi.org/10.1111/1467-629X.00082
- Jones, J. J. (1991). Earnings management during import relief investigations. Journal of Accounting Research, 29(2), 193–228. https://doi.org/10.2307/2491047
- Kahneman, D., & Tversky, A. (1979). Prospect theory: An analysis of decision under risk. Econometrica, 74(2), 263–291. https://doi.org/10.1142/9789814417358_0006
- Kasznik, R. (1999). On the association between voluntary disclosure and earnings management. Journal of Accounting Research, 37(1), 57–81. https://doi.org/10.2307/2491396
- Kothari, S. P., Leone, A. J., & Wasley, C. E. (2005). Performance matched discretionary accrual measures. Journal of Accounting and Economics, 39(1), 163–197. https://doi.org/10.1016/j.jacceco.2004.11.002
- Peasnell, K. V., Pope, P. F., & Young, S. (2000). Accrual management to meet earnings targets: UK evidence pre-and post-Cadbury. The British Accounting Review, 32(4), 415–445. https://doi.org/10.1006/bare.2000.0134
- Saleh, N. M., Iskandar, T. M., & Rahmat, M. M. (2005). Avoidance of reported earnings decreases and losses: Evidence from Malaysian. Management & Accounting Review (MAR), 4(1), 25–38. https://doi.org/http://dx.doi.org/10.24191/mar.v4i1.319
- Schøler, F. (2005). Earnings management to avoid earnings decreases and losses. Financial reporting research group, 1–25.
- Suda, K., & Shuto, A. (2005). Earnings management to avoid earnings decreases and losses: Empirical evidence from Japan. Available at SSRN 701525. https://doi.org/https://dx.doi.org/10.2139/ssrn.701525