
 ?Mathematical formulae have been encoded as MathML and are displayed in this HTML version using MathJax in order to improve their display. Uncheck the box to turn MathJax off. This feature requires Javascript. Click on a formula to zoom.
Abstract
Africa is still struggling to mitigate its electricity insecurity issues. This situation renders foreign direct investment in the renewable electricity industry (FDIREI) and renewable electricity production (REP) to become simultaneously important to Africa. Using a novel dataset of FDIREI, this paper examines the existence and nature of cointegration and causality nexuses among FDIREI, REP, and economic growth (GDP) in 32 African countries over 2003–2019. For methodological robustness purposes; GDP is added. By applying the panel vector autoregression model based-Granger causality test and a static panel data model, which are followed by robustness tests, more informative results are reported. Importantly, we find evidence of the growth hypothesis between REP and GDP, as a unidirectional Granger causality is seen from REP to GDP. Further, the neutrality hypothesis is confirmed among the remaining variables. This left us with the importance of REP in revitalizing African countries’ economic growth. All facets of REP thus should be enhanced.
PUBLIC INTEREST STATEMENT
Africa is stricken by electricity insecurity issues. Those issues worsen daily, aggravating all fields of African life. Africa is the region most vulnerable to global warming drawbacks. All of that renders foreign direct investment in the renewable electricity industry [FDIREI] and renewable electricity production [REP] to become simultaneously important to Africa. Using a novel dataset of FDIREI corporations, this paper investigates the cointegration and causality relationships among FDIREI, REP, and economic growth [GDP] in 32 African countries over 2003–2019. Employing econometrics methods, followed by robustness tests, a range of informative findings is reported. The growth hypothesis between REP and GDP is confirmed; a unidirectional Granger causality is revealed from REP to GDP. We further did not find any empirical evidence of the causality between the remaining variables. African policymakers should seriously consider the importance of green energy in revitalizing Africa’s economic growth. All facets of REP thus should be enhanced.
1. Introduction
Africa, the second-most populous continent, is still stricken by electricity insecurity issues. In responding to the COVID-19 pandemic, thousands of hospitals in Africa have experienced frequent electricity outages and by extension, social distancing has been impeded (IEA, Citation2020). More so, the International Energy Agency (IEA) documented in 2019 that almost 600 and 900 million Africans lived without electricity and lacked modern and healthy cooking facilities, respectively, in Sub-Saharan Africa (SSA), the second main region in Africa after North Africa (IEA, Citation2019). Of course, one can easily expect the detriment of electricity poverty on economic growth in SSA. For example, the power outage is ranked among the top 5 impediments to doing business in Cameroon in 2017, causing 2% losses in the country’s gross domestic product (GDP) per annum (Adesola & Brennan, Citation2019; Kenfack et al., Citation2017). Ghana also loses between US$320 million and US$924 million yearly from its GDP because of perennial electricity outages and load shedding (Obeng-Darko, Citation2019). Overall, the electricity insecurity issues in Africa deplete 2% – 4% of its GDP yearly.
North Africa indeed has nearly attained the electricity universal access whereas SSA has only reached 45% of this access rate (IEA, Citation2019). This northern region is almost fully electrified: where the power access made up 96% in 2010, 97% in 2016, and 98.5% in 2019 (African Development Bank Group, Citation2018; Pappis et al., Citation2019). However, the substantial growth in electricity needs coupled with the energy financing gap constitutes noticeable power insecurity issues in this region. North Africa enjoys rapid population growth which in turn entails an ongoing increase in electricity provision. Generally, Africans have increased almost fivefold since the 1950s, and around 470 million since 2000, making the African continent to be the fastest-growing in respect of the population. (Holechek et al., Citation2017; IEA, Citation2019).
The energy financing gap is further a challenge in Africa. The electricity investment is mainly financed by African countries’ funds (government budgets), development finance institutions (DFIs), and international donors. Over 2008–2017, SSA’s power investment was funded by the World Bank, the African Development Bank, European governments, Japan, and the USA. Further, almost 90% of the electricity infrastructure in SSA was fueled by governments’ budgets and global donors in 2017 (IEA, Citation2019). Nonetheless, highly due to the dearth of renewable energy expertise in Africa; most DFIs’ funds are still underutilized (IRENA, Citation2015). Accordingly, banks are often reluctant to finance renewables investment, and in the consent case, the funding is obtained at costly rates (IRENA, Citation2013). What’s more, the highest financing amounts by the public funds are provided to nonrenewable electricity projects instead of the renewable electricity investment (Baldwin et al., Citation2017). And, all in all, those financial assistance resources are not sufficient to bridge the energy financing gap. The IEA thus cites that a financial supplement is essentially needed in Africa through enhancing inward green foreign direct investment (FDI) (IEA, Citation2019).
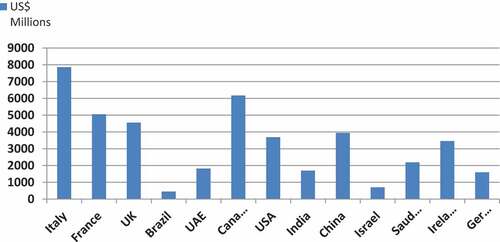
Some African countries have exerted efforts and enacted policies for green FDI attraction in the last 20 years. Consequently, FDI inflows in the renewable electricity industry (FDIREI) have been remarkably attracted in Africa. However, the trend of FDIREI was fluctuated and unevenly distributed over 2003–2019 (fDi Markets, Citation2020). For instance, the highest FDIREI has been steered towards the solar electric sub-industry, which FDIREI peaked in 2015. In contrast, the lowest FDIREI inflows have been poured into hydropower and geothermal electric sub-industries. Besides, Cameroon, Egypt, Ghana, Kenya, Morocco, Mozambique, Nigeria, South Africa, and Tunisia were the most attractive destinations to FDIREI. It is also noteworthy that Europe, Canada, China, Spain, India, the USA, and the UAE were the main FDIREI exporting countries to Africa (fDi Markets, Citation2020). FDIREI development for a period spanning 2003–2019 is shown in and .
Figure 1. FDI in renewable electricity industry in Africa over 2003–2019 (Source: fDi Markets, Citation2020).
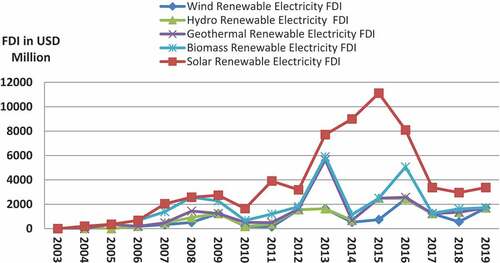
Figure 2. The most invested countries in the renewable electricity industry in Africa over 2003–2019. (Source: fDi Markets, Citation2020).
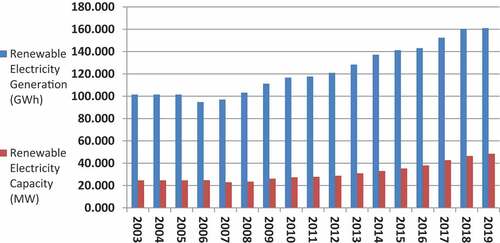
On the other hand, global warming is detrimental to all countries; however, Africa is the most vulnerable to this phenomenon’s drawbacks (Olubusoye et al., Citation2020). This is mainly attributed to Africa’s heavy dependence on agricultural activities, its ineffective and wrong enacted policies, its aging infrastructure, its incapable adaptation, and ongoing food insecurity problems (Acheampong et al., Citation2019). At this point, in light of Africa’s attempts to mitigate the global warming harmful effects on its economies, its commitment to the international climate change actions [the Paris Agreement is an example in which almost all the African countries have ratified], and its limitless renewable energies; African policymakers should effectively augment renewable energies-based electricity output instead of fossil fuel-based electricity when handling the electricity insecurity issues. Thus, expanding renewable electricity production (REP) is necessarily required. shows the gradual increase in renewable electricity capacity and production between 2003 and 2019 in Africa.
Figure 3. Renewable electricity capacity and generation in Africa over 2003–2019 (Source: IRENA, Citation2015, Citation2020).
Herein, it is important to clarify that; African governments should remarkably increase REP in their energy mix. We believe more expansions in renewable energy projects with a gradual diminishing in fossil fuel investments are required. However, several related limitations and difficulties to a serious transition to renewable energy are highly expected. Corruption, fossil fuel lobby effect, lack of renewable energy expertise, green financing deficiency, and costs associated are clear examples of these difficulties. Generally, the costs of renewable energy systems and technologies have been descended steadily. However, the related initial capital costs are still expensive. More innovative business simulations could help in absorbing those costs. Besides, a serious fight against corruption and effective political will towards renewable energy development will, of course, support African countries to absorb costs associated with the green transition. Further, more financing should be steered towards African renewables investment because the largest financing has been already assigned to fossil fuel projects (Baldwin et al., Citation2017). We thus believe that considering these steps together will noticeably aid the absorption of renewable energy costs in Africa.
Against this backdrop, it is evident that FDIREI and REP are important to Africa simultaneously. Enhancing both FDIREI and REP are highly needed to elevate the electricity security level in Africa. Put differently, alleviating electricity insecurity repercussions, Africa should enlarge its REP and by extension, accelerate and stimulate FDIREI because of its energy financing gap. The essence herein is that we endeavor to understand the FDIREI-REP association. For methodological robustness purposes; GDP is included. As such, this paper aims to investigate the existence of cointegration and causality among FDIREI, REP, and GDP in Africa over 2003–2019. Thus, answering the question of whether REP precedes/causes FDIREI or vice-versa could be an important issue for African policymakers to prioritize appropriate measures for developing and implementing cohesive policies for FDIREI and REP development. In other words, determining whether FDIREI enhances REP or REP attracts FDIREI or both variables improve/not improve each other could be an informative issue for African policymakers.
The novelty and contributions of this paper to the literature can be elucidated in two ways. Firstly, we employ a novel sectoral/industrial dataset of green FDI corporations in the renewable electricity industry in Africa to focus on the FDIREP-REP relationship. While the majority of the preceding studies use aggregate/national FDI datasets. Accordingly, to the best of our knowledge, the FDIREI-REP-GDP nexus in Africa within cointegration and causality analyses has yet to be examined. Secondly, the published papers that encompass REP and cover North Africa economics in such studies are limited. Our study thus fills these research gaps.
To this end, we obtained an unprecedented FDIREI dataset between 2003 and 2019 and employed the panel vector autoregression (PVAR) model based-Granger causality test and static panel data model, supported by robustness tests. Based on that, a range of interesting results is reported. Importantly, the results reveal the existence of the neutrality hypothesis between FDIREI and REP in Africa. However, we find evidence of a unidirectional Granger causality running from REP to GDP (growth hypothesis), i.e. REP precedes and predicts GDP in Africa during 2003–2019, and not vice versa.
The remainder of our paper includes the literature review in section 2. In section 3, a methodology is introduced, while section 4 contains results and discussion. Section 5 concludes by providing key policy implications.
2. Literature review
FDIREI-REP-GDP interrelationship could be theoretically elucidated by several theoretical underpinnings. Firstly, FDI is justified by many theories. Dunning’s Eclectic paradigm/OLI framework (1977-Citation2001) is the most comprehensive FDI theory in which the FDI movements depend on three combined factors: ownership, location, and internalization advantages. The first two determinants work to push and attract FDI into a specific destination. While the entry modes into foreign markets that are chosen by FDI corporations refer to the internalization advantage, in which foreign investors could attain higher returns (Dunning, Citation2001; Faeth, Citation2009).
Secondly, the literature cites four testable hypotheses for governing the REP-GDP nexus. The first is the growth hypothesis, i.e. a unidirectional causal link which goes from energy (electricity) to GDP. As such, energy is the economic growth engine, and the environmental policies that target energy conservation would negatively affect GDP. The opposite is called the conservation hypothesis, which means one-way nexus running from GDP to energy. But, if REP-GDP depicts a bidirectional linkage; it is known as a feedback hypothesis. The last one refers to the neutrality hypothesis, in which there is no causality between respective variables (Ozturk, Citation2010).
Thirdly, FDI impact on REP can be theoretically ruled by three effects. A scale effect is the first in which FDI elevates energy production. That means energy is increased because of the augmented GDP by FDI activities. While a technique effect indicates FDI’s positive contribution to energy efficiency and clean power. Lastly, a composition effect, in which the FDI’s effect depends on its sectoral distribution and the economic progression stage in host countries (Acheampong et al., Citation2019).
Lastly, the impact of FDI on economic growth could be explained by the followings theories. The first is the neoclassical growth model which cites economic growth as a function of FDI. FDI thus improves GDP. Conversely, the dependency theory indicates that FDI negatively affects GDP. The dependency school theorists argue that FDI attains its interests at the expense of developing countries’ long-run growth (Latief & Lefen, Citation2019; Peng et al., Citation2016).
On the other hand, published papers on cointegration and causality analyses are vast numerous incorporating different econometrics techniques and varied samples sizes. Therefore, it is hardly surprising that those papers introduce mixed, dissociated, and inconclusive results and policy implications. Furthermore, the included analyses in the bulk of those papers are classified into bivariate and trivariate frameworks, within a single and multiple-country analysis. In general, no clear consensus exists on the nature and direction of the FDI-energy-economic growth relationship in the literature.
Focusing on six SSA countries over 1971–2009, Kivyiro and Arminen (Citation2014) investigated causality amidst FDI, GDP, energy consumption, and CO2. For that, the authors used autoregressive distributed lag (ARDL) bound framework and vector error correction model (VECM)-based Granger causality test. The results showed variables moved together in the long-run and the causal corrections highly varied among countries, but the common Granger causality ran from CO2 to other variables. FDI also elevated CO2 in some of the respective countries, and CO2 attracted FDI in the other countries. Given the mixed reported results; the authors did not provide uniform policy implications. Similarly, Sbia et al. (Citation2014) confirmed the cointegration relationship among FDI, clean energy, trade openness, energy consumption, and GDP in the UAE during 1975–2011. They also found a bidirectional linkage between FDI-clean energy and GDP-energy consumption.
On 23 developing countries between 1971 and 2010, Hassaballa (Citation2014) employed an error correction approach within a panel data analysis to inspect the Granger causality between FDI and energy use. By using a Granger causality test, the results revealed a two-way nexus between FDI and energy use. These results contradict findings by Khatun and Ahamad (Citation2015) who found a one-way relationship ran from FDI to energy use and from the latter to GDP in Bangladesh. The authors adopted industrial/sectoral analysis by using the FDI dataset in Bangladesh’s energy and power sector (1972–2010). In Egypt, Ibrahiem (Citation2015) examined the FDI-GDP-renewable electricity consumption (REC) link over 1980–2011. By employing ARDL, a stable long-run relationship among the analyzed variables was found. The author further showed a unidirectional link going from FDI to GDP and bidirectional causality between GDP and REC.
A Turkish study covered the period of 1975–2012, in which Kalyoncu et al. (Citation2015) used the Johansen cointegration test-based-VAR model to examine the long-run linear relationship among FDI, energy production, GDP, trade openness, inflation, and labor productivity. The cointegration was confirmed. However, the inflation rate impeded FDI into Turkey. Across 75 countries, Amri (Citation2016) covered 1990–2010 to inspect the FDI-GDP-energy consumption liaison. Evidence of a bidirectional nexus between FDI-output per capita, conventional energy-GDP per capita, and green energy consumption-GDP per capita was revealed. The author also cited that a 1% increase in renewable energy attracted FDI by 0.185% and the opposite is true; a 1% rise in FDI augmented the renewable energy used by 0.292%. These results were obtained by employing the Cobb-Douglas production function within a dynamic panel model. Besides, a panel Granger causality analysis from 16 Chinese provinces over 1985–2012 was conducted by Peng et al. (Citation2016). The findings cleared that the Granger causality directions among FDI, GDP, and CO2 varied across the provinces. Evidence also from Vietnam by Nguyen and Wongsurawat (Citation2017) showed that economic growth, electricity consumption, exports, and FDI were cointegrated during 1980–2013. Further, a bilateral Granger causality nexus between electricity consumption and exports and one-way Granger causality from GDP to remaining variables were found.
Asiamah et al. (Citation2019) discovered a cointegration association among FDI, electricity production, GDP, inflation, interest rate, exchange rate, and infrastructure in Ghana over 1990–2015. The results also showed that inflation predicted FDI, but not vice versa, and there was a unidirectional link ran from interest rate to FDI. Elsewhere, by applying the Westerlund (2007) cointegration test and GMM, Shahbaz et al. (Citation2019) cited that GDP-CO2 and biomass usage-CO2 caused each other in MENA countries during 1990–2015. The authors further showed that the cointegration liaison among FDI, GDP, biomass energy use, and CO2 was significant. These cointegration findings are very much in line with Yilanci et al. (Citation2019) as the same results were confirmed in BRICS countries over 1985–2017 among FDI, trade openness, and clean energy consumption via using different econometrics methods. Hidden Fourier autoregressive distributed lag cointegration tests and Fourier Granger causality based on the Toda-Yamamoto approach were employed. Concerning China, a one-way nexus was discovered from FDI to clean energy use. In severe contrast to this finding, Kiliçarslan’s paper (Kiliçarslan, Citation2019) that covered the same countries, BRICS, showed that FDI limited renewable energy production over 2007–2015.
Latief and Lefen (Citation2019) adopted the Johansen cointegration and Granger causality tests to investigate the power and energy sector’s FDI-energy consumption-economic growth association in Pakistan over 1990–2017. The variables were cointegrated, and positive bidirectional causality between GDP-energy consumption in short-run was proved. This result is consistent with findings by a paper of Ssali et al. (Citation2019) that applied to 6 SSA countries over 1980–2014. The authors showed FDI, energy use, CO2, and GDP were cointegrated. Also, a one-way causal link going from CO2 to FDI in long-run, and bidirectional causality between CO2- energy use in short-run were confirmed. A recent study by Khan et al. (Citation2020) documented that FDI, CO2, income, renewable energy use, and health expenditure moved together in long-run (1995–2016) in the Belt and Road Initiative countries by using robust econometric techniques. A two-sided causality was further observed among the analyzed variables. These results are underpinned by Fan and Hao’s evidence (Fan & Hao, Citation2020) from 31 Chinese provinces over 2000–2015, which they declared a stable long-run relationship among FDI per capita, GDP per capita, and renewable energy consumption per capita. The VAR and VECM models were used to report that FDIpc Granger caused GDPpc. However, renewable energy use did not Granger cause GDPpc.
In conclusion, the essence of synthesizing the above-mentioned literature is to introduce compelling arguments that could underpin the research objectives and contributions of our paper to the literature. As such, to the best of our knowledge, the cointegration and causality analyses among FDIREI-REP-GDP in Africa have yet to be examined. What’s more, including REP and covering North Africa countries in such analyses is scarce. Our paper thus bridges these research gaps.
3. Methodology
In this section, a description of the employed variables and the applied empirical path are presented as follows:
3.1. Variables description, hypothesis, and data sources
Given the data availability; we employ balanced annual panel data for 32 African countries over 2003–2019. The univariate missing values in REP are treated by the linear interpolation method as used by Ankrah and Lin (Citation2020) and Hassaballa (Citation2014). This method is widely employed as a gap-filling technique (Bigaignon et al., Citation2020). Besides, we use Stata 14.0 to conduct the analysis.
Furthermore, we apply a trivariate framework. That is, FDIREI and REP are our variables of interest, however, we also include economic growth rate (GDP %) for threefold aims. Firstly, the literature cites that employing bivariate analysis highly leads to omission bias, spurious relationships, thereby misleading inference (Appiah, Citation2018; Chiawa et al., Citation2012; Esso & Keho, Citation2016; Ibrahiem, Citation2015; Maddala & Kim, Citation1998; Magombeyi & Odhiambo, Citation2017). Secondly, theoretically and empirically, economic growth/ market size (GDP is a proxy) is found as a crucial FDI determinant (Eyraud et al., Citation2013; Faeth, Citation2009; Keeley & Ikeda, Citation2017). Thirdly, the FDIREI-REP-GDP nexus is deemed an interrelationship, as these variables tend to impact each other. Besides, with regard to the nature and direction of the FDI-energy/electricity-GDP relationship, the literature shows mixed and inconclusive results. We, therefore, hypothesize that: FDIREI, REP, and GDP are cointegrated and cause each other in Africa. A brief description of the variables employed is given as follows:
FDIREI is a dependent variable, measured in current US$ millions. Given the objectives of our study, we have obtained the FDIREI dataset from the fDi Markets database. Thus, FDIREI is neither public data nor readily available, it is primary data. This global fDi Markets database is a specialist department from the Financial Times which presents datasets on FDI activities worldwide. FDIREI, therefore, is indeed a novel dataset. Furthermore, the fDi Markets database is widely employed, especially by UNCTAD’s world investment reports (Falk, Citation2016; UNCTAD, Citation2020). This paper covers years from 2003 to 2019; as the fDi Markets database traces FDI corporations from 2003 onwards.
REP and GDP are independent variables. REP depicts the percentage of electricity produced from renewable energy resources. The data of REP was collected from the World Bank’s world development indicators (WDI). We also employ annual GDP growth (%) as a proxy of the African countries’ market size. GDP is derived from WDI.
3.2. Model specification
For the theoretical framework which could govern the FDIREI-REP-GDP link, we consider the neoclassical growth model, feedback hypothesis, and Dunning’s eclectic paradigm. Therefore, based on Dunning (1993–2000) and Asiamah et al. (Citation2019), our model specification is specified as follows:
This economic model is restated as an econometric model as follow;
Where β represents parameters to be estimated, i implies host country, t represents years, εit is the error term.
3.3. Econometric steps and procedures
Based on the literature, the applied econometric path in cointegration and causality analyses rely on some cohesive sequential procedures. Put differently, the employment of a specific test, approach, or estimator depends on the results of the direct prior procedure. As such, we show our econometric strategy in the follows;
3.3.1. Cross-sectional dependence and panel unit root tests
We initiate our analysis by examining the potential of interdependencies of data across sampled African countries by cross-sectional dependence (CSD) test. Due to the collaboration among African nations in economic, energy, environmental, financial, etc. fields; CSD would highly exist. Nonetheless, CSD investigation is widely neglected in the literature (Shahbaz et al., Citation2020). Further, CSD may be induced by common shocks, evolutions, and unobserved factors that are depicted in disturbance error whether they are correlated or uncorrelated with the regressors (De Hoyos & Sarafidis, Citation2006). As our sample incorporates (N > T); we employ Pesaran (Citation2004) and Frees (Citation1995) tests to test CSD (Baye et al., Citation2020; De Hoyos & Sarafidis, Citation2006). Then, we proceed with unit root tests. Based on the results reported of the CSD tests, our balanced panel sample, and (N > T); the first (not allow CSD) or second (allow CSD) generation panel unit root tests will be used.
3.3.2. Panel cointegration test
Based upon the results of the unit root tests, the need for inspecting the long-term relationship (co-movement/ equilibrium) amidst the variables used will be decided. Nonstationary time series (unit root existence/ I (1)) is a precondition for cointegration analysis. In short, the unit root tests results will determine the cointegration analysis path (Bhaskara, Citation1994; Maddala & Kim, Citation1998; Studenmund, Citation2017).
3.3.3. Panel Granger causality test
Our second objective is to scrutinize the existence and direction of the FDIREI-REP-GDP causal nexus. If evidence for cointegration is confirmed, we must find causality among the variables regardless of their direction (Granger, Citation1988). The stationarity of the variables employed is a precondition for inspecting the causality (Gujarati, Citation2004). Further, causality means precedence, in which the first variable consistently precedes, happens, or changes before the other variable. Thus, it is implied that the first variable precedes, leads, or causes the other variable. However, if the causality resulted, it does not necessarily confirm causation without taking economic theory and common sense (the logic) into consideration (Gujarati, Citation2004).
It is also noteworthy that, the causation notion is widely investigated by the Granger causality test. For simplification, if an independent variable Granger causes a dependent variable, that happens if the past values of the former can explain the current value of the latter (Granger, Citation1969). These past values mean the lagged values of the independent variable which are employed to enhance the explanation of changes in the dependent variable (Granger, Citation1969; Hassaballa, Citation2014).
4. Results and discussion
This section discusses the results on the FDIREI-REP-GDP nexus in Africa between 2003 and 2019. That is all followed by robustness tests.
4.1. Descriptive statistics and matrix correlation
We commence with showing descriptive statistics for all variables used in all countries in our sample. presents the observations number, mean, standard deviations, minimum and maximum values of the variables. Then, the collinearity is detected via matrix correlation in . The results declare that the correlations between explanatory variables in the sampled countries are not high. Accordingly, it is presumed that the collinearity issue is absent.
Table 1. Descriptive statistics
Table 2. Correlation matrix
4.2. Cross-sectional dependence result
We employ CSD tests by Pesaran (Citation2004) and Frees (Citation1995).Footnote1 Under the null hypothesis of cross-sectional independence, the results in and suggest the existence of CSD in our panel data. For the Pesaran test, the H0 is strongly rejected at a 1% significance level. Likewise, Frees’s statistic exceeds the critical value with at least alpha = 0.01. Therefore, data of the respective variables have a CSD. This result is consistent with findings by Ssali et al. (Citation2019); Khan et al. (Citation2020); Pala (Citation2020); and Shahbaz et al. (Citation2020).
Table 3. Result of Pesaran’s test (Citation2004) cross-sectional Independence
Table 4. Result of Frees’s test (Citation1995, Citation2004) cross-sectional Independence
4.3. Panel unit root tests result
Having determined the presence of CSD, we then employ the second generation panel unit root tests which allow cross-sectional correlation instead of the conventional (first generation) panel unit root tests. We follow Khan et al. (Citation2020) in utilizing Harris–Tzavalis (HT) (1999) and Pesaran (CIPS) (2007)Footnote2 panel unit root tests for CSD data. HT test fits our study, as it is a balance panel analysis having a large N compared with T (N > T). Further, reliable estimates can be obtained by using the HT test in the presence of CSD (Khan et al., Citation2020).
The results are reported in . Under the null hypothesis of panels contains unit roots, the HT’s test strongly rejects it at a 1% significance level. Similarly, the CIPS’ null hypothesis of non-stationary time series is rejected as the calculated CIPS’ statistic for all variables is larger than their critical values in all cases. Accordingly, the results of both the HT and CIPS tests highly confirm the absence of unit root in our variables.
Table 5. Results of Harris-Tzavalis panel unit-root test
Table 6. Results of Pesaran (CIPS) panel unit-root test
4.4. Panel cointegration path
Based on the reported results of the panel unit root tests, a performing cointegration analysis is not necessary. Non-stationary is a prerequisite for cointegration analysis conducting (Gujarati, Citation2004; Maddala & Kim, Citation1998; Wooldridge, Citation2009). As our variables are stationary at level I(0), neither cointegration analysis nor short-run estimation (including differenced variables) are needed to be conducted, however, only the long-run panel data model should be estimated (Studenmund, Citation2017). This result is very much in line with Olanrewaju et al. (Citation2019) who cited that no need for performing cointegration tests because they found that all the employed variables in their paper were stationary, I(0). Johansen (Citation1991) stated that the cointegration analysis enables researchers to specify the pattern of dynamic adjustment between cointegrated variables, however, in our case, this adjustment moves quickly from the short run into the long run (Asiamah et al., Citation2019; Johansen, Citation1991). We thus run a static panel data model with inclusion countries-specific effects and time-specific effects (controlling for heterogeneity) as follows;
Where, αi shows country unobservable-effects and ϒ shows time dummy variable.
For the estimation, the OLS method is biased and inconsistent with a cointegrated regression, however, in our case, the OLS estimator is consistent and appropriate (Pala, Citation2020). For robustness purposes, we further employ panel random effects estimator after conducting the Hausman testFootnote3 in which reveals that the null hypothesis of using the random effects model cannot be rejected against the alternative hypothesis of using fixed effects regression. shows the result of both the Hausman test and the panel staticFootnote4 model. Based upon this table, it is evident that the estimates by the OLS are allied with the results obtained by the random effects estimator.
Table 7. Results of OLS and random effects panel models
The results reveal that the green foreign investors are indifferent to the REP growth in Africa from 2003 to 2019. This result stands in contrast to studies by Kalyoncu et al. (Citation2015) and Asiamah et al. (Citation2019) who found a positive and significant long-run effect of electricity production on FDI in Turkey and Ghana respectively. A probable justification is that, however, REP developments could reflect a positive indicator for foreign investors, but we believe that the final decision to invest highly depends on the attractiveness of the regulatory and financial renewable energy policies, the political support, and political stability in Africa.
The results also show that GDP is inconsequential to FDIREI in Africa. This finding, as we believe, is hardly surprising, as the World Bank cited that the regular and reliable GDP records and census data are absent in Africa (World Bank, Citation2016). As such, foreign investors could avoid depending on the GDP dataset as a robust macroeconomic indicator in making decisions toward Africa. This result is substantiated by Keeley and Ikeda (Citation2017) who found that GDP played nothing in attracting FDI in wind energy in developing countries over 2008–2014.
Here, it is important to note that, as mentioned above, no need for cointegration investigation in this paper, however, in the case of cointegration inspection, especially between GDP and REP in Africa, how can we account for/explain that? Put differently, it can be challenging to infer the cointegration between REP and GDP; because Africa’s GDP is highly dependent on nonrenewable resources. Notwithstanding, we could unpack this challenge. Both REP and GDP could have a common trend (cointegration/ co-movement in long run) in Africa if we consider these facts: [a] the progression in renewable energy growth is highly reflected in increased renewable energy capacity and REP in Africa. [b] Africa’s commitment to global warming and climate actions and agreements. For instance, almost all African countries have ratified the Paris agreement on climate change. As a result, those countries are required to adhere to the Paris treaty’s articles, targets, and duties. These requirements entail those African countries to cut their GHG, adopt more renewable energy technologies, receive green financing, and then, report their progress report toward the Paris agreement duties every five years. Consequently, an influential effect of renewable energies is highly expected to be in place in Africa. [c] Not all African countries are nonrenewable energy-dependent; however, all of them have limitless renewable energies. Out of 54 African countries, only five countries represented the top five oil-producing economies in 2019: Nigeria, Angola, Algeria, Libya, and Egypt. [d] Africa is the region most vulnerable to global warming drawbacks. That is coupled with the global warming effects that worsen daily worldwide. As such, more effective policies and transitioning to renewable energy are being processed all over the world. In short, combining all the above facts could show the growing role played by renewable energy in Africa and could support inferring and justifying cointegration between REP and GDP.
4.5. Result of the Granger causality test
The investigation of the Granger causality nexus is built on separate equations (multi-equations regression) in which the causality can be detected by employing the vector autoregression model (VAR). The VAR model is a framework of equations in which each equation’s dependent variable is the other equation’s independent variable. Put differently, the VAR system includes more than one outcome variable with more than one equation. Each equation incorporates lags of all its variables as regressors (Gujarati, Citation2004).
According to Maddala and Kim (Citation1998), if all the employed variables are stationary at level, I (0), (as our case), thereby applying an unrestricted VAR model is appropriate. We, therefore, depend on the unrestricted PVAR approach to investigate the Granger causality. The null hypothesis under the PVAR Granger causality model is that the independent variables cannot Granger-cause the dependent variable, and vice versa is true for the alternative hypothesis. The used PVAR Granger causality model is specified as follows;
Where p is lag length; i implies country; t present the year; β, δ, and ϒ are short-run dynamic parameters to be estimated; α1, α2, and α3 are intercepts; and ε normally distributed error term.
After that, we proceed with regulating the appropriately used lags. Given the sensitivity of the Granger causality approach to the employed lags, we determine the optimal lag length based on Akaike information (AIC) and Schwarz’s Bayesian information (SBIC) criteriaFootnote5; the most common model selection criteria that confirm no serial correlation with normally distributed errors (Asiamah et al., Citation2019; Gujarati, Citation2004). The same procedure was applied by Kivyiro and Arminen (Citation2014) and Pala (Citation2020). shows the relevant lag length is 2, as the statistics of AIC, SBIC, FPE, and HQIC jointly refer to lag 2 by the attached asterisks.
Table 8. Lag selection-order criteria
presents the results of the Granger causality test in a trivariate PVAR system.Footnote6 We find evidence that REP Granger causes GDP at a 5% level of significance, and not vice versa. That is, there is a unidirectional causality running from REP to GDP. As a result, REP is responsible for GDP in which the past REP rates did help to predict and explain changes in GDP, and this role was absent for GDP, which means the explanatory power of GDP toward REP vanished in Africa within the sampled period. REP thus is a crucial GDP determinant in Africa. Therefore, we provide evidence of the growth hypothesis existence (REP ➔ GDP) and the conservation hypothesis absence (GDP ➔ REP) in Africa over 2003–2019. In short, based on results obtained to date, we document that REP fed/fueled/caused GDP [growth hypothesis existence]; however, GDP did not feed/fuel/cause REP [conservation hypothesis missing]. Therefore, it appears that GDP was not unique to REP over 2003–2019 in Africa.
Table 9. Panel VAR-Granger causality Wald test
These results could be attributed to the fact that, according to the IRENA, the installed capacities of renewable electricity increased from almost 22,000 MW in 2003 to 43,000 MW in 2019. Therefore, REP has been augmented from 100,000 GWh to 160,000 GWh between 2003 and 2019 (IRENA, Citation2020). This growth in REP is expected to be reflected in enhancing Africa’s GDP. In addition, the poverty rate is rising in Africa with the expectations of the continuation of the poverty trend in the continent (World Bank, Citation2016). We believe these facts could support our results of the effectiveness of REP in GDP improvement and the absence of the uniqueness of GDP to REP in Africa between 2003 and 2019.
We can further add a more compelling argument that shows the unique characteristic of REP responsible for GDP growth in Africa. Renewable power share has been remarkably augmented in the continent’s energy mix. In the North Africa region, several monumental solar projects have been established there. In 2017, two Moroccan solar power projects, stage I of NOORM and NOORM II, were built with a total capacity of 800 MW and a total output of 1.886 Giga-watt hours (GWh) every year. As a result, almost 2 million Moroccan have access to electricity and about 0.7 million ton-equivalent of GHGs have been saved (African Development Bank Group, Citation2017). Elsewhere, the Nzema plant in the west of Ghana, the biggest solar power project in Africa, aims to provide electricity to over 100.000 households. In addition, a solar rooftop program has been initiated by Ghana Energy Commission to alleviate peak load by 200 MW through photovoltaic (PV) utilization (Kuamoah, Citation2020).
In Cameroon, the Nachtigal hydropower project is a 420 MW with an expected 2800 GWh yearly. The Nachtigal will expand Cameroon’s installed capacity by nearly 30% and will assist in saving 1.35 million tons equivalent of GHGs annually. Accordingly, the African Development bank expected that Cameroon’s GDP and employment rates will be noticeably enhanced (African Development Bank Group, Citation2017). Ghana also contributes positively to renewable energy development. In early 2020, Ghana generated 54% of its power from hydropower. The country yielded 65% of its electricity output by the Akosombo and Kpong dams in 2015. Accordingly, accessibility to electricity increased gradually from 67% in 2010 to 76% in 2015 and 83% in 2020. This progression pushes Ghana to become the second-highest country in terms of power access in the SSA region (Kuamoah, Citation2020). Kenya attained appreciable progress in power provision; 55% of Keynesians reached electricity in 2019 compared with only 27% in 2013. Furthermore, in 2017, 77% of the country’s used energy was produced from renewable energies in which geothermal and hydropower played a predominant role (Kazimierczuk, Citation2019). Mauritius also produced 17% of its power by Biomass in 2015.
Recent statistics in 2021 report that renewable energy constitutes 5.5% of South Africa’s energy mix. That is because of a gradual increase in installed clean power capacities from 1000 MW in 2007 to 4500 MW in 2016. In the same year, 2016, South Africa produced over 100 GWh of renewable electricity by biomass (Akinbami et al., Citation2021). Additionally, the largest wind power plants have been established in South Africa with 2010 MW, Ethiopia with 320 MW, and Kenya with 310 MW (Bishoge et al., Citation2020). Besides, Africa had 14 GW of large-scale solar photovoltaic (PV) and over 6 GW of Concentrated Solar Power (CSP) that were put into operation in 2015 (Amir & Khan, Citation2021). One of the major solar energy projects in Africa is called the Benban project with 165.5 MW which is located in the south of Egypt, Aswan City.
Consequently, renewable energies have fueled the industrial sector in Africa. In 2013, this sector consumed renewable electricity by almost 20% of the total energy used. This figure is expected to reach 50% by 2030 (IRENA, Citation2015). Besides, a few million Africans have been employed in renewable energy projects. Job creation/labor absorption is positively associated directly and indirectly with economic growth. Those green projects are more intensive labor than fossil fuel investments (OECD, Citation2013). Thus, generating one unit of renewable electricity will create more jobs than one unit produced by nonrenewable energies. As such, the renewable energy involvement in Africa’s industrial sector and labor market could be highly reflected in increasing the continent’s GDP.
Here, the bottom line is that a major portion of the energy consumed in Africa comes from renewable sources of energy (Kazimierczuk, Citation2019). Remarkable efforts to improve renewable energy have been executed. That is reflected in a notable growth in green energy capacities and REP which in turn contribute positively to Africa’s GDP. Notwithstanding, these improvements in renewable energy are still inadequate, and more effective policies and strategies should be taken.
In the literature, our result is also corroborated by Fondja Wandji (Citation2013) and Appiah (Citation2018) who found unidirectional causality running from energy consumption to GDP in Cameroon and Ghana, respectively. Further, our finding is partly consistent with findings by Ibrahiem (Citation2015) and Amri (Citation2016) who revealed a bidirectional causality link between economic growth and renewable energy consumption in developing countries. However, in contrast to our result, Masih and Masih (Citation1996) did not find any causality linkages between energy consumption and GDP in Malaysia, Singapore, and the Philippines.
Besides, the null hypothesis of non-causality cannot be rejected at a 10% significance level between FDIREI-REP and FDIREI-GDP. In other words, the existence of short-run causality between these groups was absent. Overall, the results obtained herein contradict our hypothesis. Therefore, our results suggest that the changes in REP and GDP did not precede the changes in FDIREI and vice versa. We, thus, discovered that REP and GDP have not been suitable predictive indicators of FDIREI, and the opposite is true. Economically speaking, possible explanations lie in the following facts;
As mentioned earlier, poverty is in rising in Arica. There were about 330 million Africans lived in poverty in 2012 comparing with around 280 million in 1990. It is anticipated that this poverty trend will continue and the world’s poor will be highly concentrated in Africa (World Bank, Citation2016). What’s more, over the last decade, Africa’s GDP growth was inadequate, and recently, it is inching up, pushing the continent to experience economic stagnation (United Nations, Citation2020). Moreover, good quality and regular GDP datasets are lacking in Africa (World Bank, Citation2016).
For clarifying the inefficiency of REP in causing FDIREI, it is noteworthy that the installed capacities of renewable energy and REP have been augmented in the last 20 years in Africa. However, the desired progress in the African clean energy industry is still lagging. Scant attention has been oriented to renewable energy development by policymakers (Ankrah & Lin, Citation2020; Opoku & Boachie, Citation2020). Here, it is logical to question that: why can’t African policymakers encourage more electricity security from renewable sources? Based on the literature, we can infer the answer. Many African countries have immense and multifarious nonrenewable resources. In 2015, for example, it was estimated that the world’s proven reserves of oil, natural gas, and coal in Africa were about 7.6%, 7.5%, and 3.6%, respectively. Investments have historically come into Africa for seeking natural resources. As such, the oil industry is a leader in pulling the multinational investment corporations in Africa. For instance, 75% of FDI has been poured into mining and oil extractive industries between 1985 and 1991. Also, 41% of FDI has been invested into only four oil-exporting countries: Angola, Congo Republic, Equatorial Guinea, and Nigeria over 1995–1998. In 2019, more than 40% of inbound Greenfield investment into Africa is concentrated in natural resources industries (UNCTAD, Citation2020). As a result, it is hardly surprising to find an influential impact of the fossil fuel lobby on the energy market in Africa. Besides, Africa is still stricken from the dearth of green power expertise, lack of renewable energy awareness, and risks associated with green investment. Komendantova et al. (Citation2014) cited that the stakeholders found solar energy projects is risky because of political instability and governance issues in North Africa region.
Here, the message we are trying to convey is that, in light of the above-mentioned circumstances of Africa, policymakers may be pressured and have resorted to paying more attention to fossil fuel resources rather than clean energies, and then, they did not encourage more green energy harnessing. That all could result in the absence of the desired role which should be played by the REP in enhancing inbound FDREI into Africa. For example, in the attempts to meet the substantial increase in energy needs, policymakers may resort to going to more fossil fuel expansions rather than going to more green energy. Thus, the little attention paid and inadequate encouragement oriented to renewable energy in Africa could be explained and justified.
Regarding the ineffectiveness of FDIREI toward GDP and REP, we add justification. In the last 20 years, FDIREI inflows into Africa have fluctuated and have been unevenly distributed across the continent (fDi Markets, Citation2020). As such, renewable energy investment in Africa has been highly financed by the international development institutions and African governments’ funds (IEA, Citation2019). Further, according to fDi Markets (Citation2020), FDIREI amounted to more than US$ 40 billion in Africa between 2003 and 2019. However, those capital investment values have not been exclusively poured into the green power generation activity. Simply put, beyond REP, other activities also absorbed shares/portions of FDIREI. Those activities include manufacturing; sales, marketing & support; headquarters; research & development; and education & training (fDi Markets, Citation2020). All these fields are categorized as nonproductive activities. In other words, all these activities are not directly associated with REP and GDP, but appear to indirectly and positively contribute to them (REP and GDP) in the long run. In addition to that, the capital investment values of FDIREI were severely uneven distributed among the 32 African countries under our investigation. That is, for example, over 2003–2019, South Africa, Egypt, and Morocco received FDIREI that estimated at almost US$ 18.297 billion, US$ 6324 billion, and US$ 6253 billion, respectively, whereas countries of Algeria, Benin, and Liberia only got US$ 376 million, US$ 29 million, and US$ 174 million, in respective order (fDi Markets, Citation2020). Surprisingly, it seems that the countries of Lesotho, South Sudan, Guinea-Bissau, and Eritrea have not pulled any FDIREI over the considered period. We believe that these clear disparities in amounts invested could add very slightly to the aggregated Africa’s GDP and REP.
On the other hand, the dependency theory has declared that FDI can negatively affect GDP. The theorists of the dependency school have claimed that FDI could achieve its interests at the expense of developing countries’ long-run growth (Latief & Lefen, Citation2019; Peng et al., Citation2016). This is substantiated by a more recent published paper by Lema et al. (Citation2021) on Chinese investment in renewable energy projects in Africa. The authors cited that China is the principal renewable energy investor in the African continent; however, African benefits from those projects are very limited. As a result, the researchers recommended that policymakers should be cautious about the effectiveness of Chinese renewables investment in Africa.
In combination, all the above-mentioned facts could underpin our non-causality findings. That is, the predictive power between FDIREI-REP and FDIREI-GDP was absent in Africa during 2003–2019. In detail, given the mentioned Africa’s circumstances, it seems that the GDP and REP have not been reliable predictive indicators for foreign investors and by extension, they have not attracted FDIREI. Simultaneously, due to the FDIREI discontinuity, concentration, and fluctuations; FDIREI has not been effective for Africa’s GDP and REP. Our results are consistent with Asiamah et al. (Citation2019) who found that the past FDI inflows did not help to predict electricity production in Ghana over 1990–2015. Also, Fan and Hao (Citation2020) corroborate our results; they showed that neither GDP nor FDI was responsible for renewable energy consumption in 31 Chinese provinces over 2000–2015. Contrary, our results are inconsistent with Kivyiro and Arminen (Citation2014) who found a unidirectional Granger causality from GDP to FDI in Kenya and Congo, and Sbia et al. (Citation2014) who proved a bilateral causality between FDI and clean energy in UAE.
Lastly, worthy of mention is that the majority of African countries are relatively similar to each other in almost all their affairs. Almost all African countries, for example, are endowed with high renewable energies potentials and have commitments/agreements toward global warming mitigation. In addition, the green FDI dataset employed here has been sourced from fDi Markets. This dataset almost covers all African countries that have already attracted renewable electricity FDI between 2003 and 2019. Based on that, and given African countries’ similarities, we believe this dataset is unique and could provide a good representation of the entire continent. As such, we suggest that our results can be applied to all African countries. That means the generalizability of our findings is suitable to be adopted to African countries that are out of our sample.
4.6. Diagnostic and robustness tests
For reinforcing our results, several robustness tests are conducted. For heteroskedasticity, we use a robust standard errors estimator -vce (robust)—to report heteroskedasticity-robust estimates. Therefore, the heteroskedasticity issue is treated (Santos Silva & Tenreyro, Citation2006). Regarding autocorrelation, we employ the Born and Breitung (Citation2016) HR-test. The HR-test is more robust, flexible, and straightforward to use. Moreover, the HR statistic can be considered as autocorrelation and heteroskedasticity-robust diagnostic test (Born & Breitung, Citation2016; Wursten, Citation2018). shows the result of the HR diagnostic test.Footnote7 Under the null hypothesis of no first-order serial correlation, we cannot reject it at a 10% significance level. Thus, first-order serial correlation is absent in our data. Besides, in addition to reporting the correlation matrix in , we adopt the variance inflation factor (VIF) methodFootnote8 to redetect the collinearity. reaffirms the absence of collinearity between our variables due to the VIF (βi) < 5 (Studenmund, Citation2017).
Table 10. Result of heteroskedasticity-robust Born and Breitung (Citation2016) HR-test
Table 11. Result of variance inflation factor
Further, in addition to the estimation of the PVAR model by GGM, we also use OLS and random-effects estimators,Footnote9 as the Hausman test (in ) confirms the appropriateness of the random effects estimator. and reaffirm that REP has a positive and statistically significant short-run impact on GDP at a 5% significance level. These results strengthen the robustness of our reported results. We thus can confirm the existence of unidirectional causality nexus ran from REP to GDP and the absence of causality among other variables in Africa over 2003–2019.
Table 12. Panel vector autoregresssion. GMM Estimation. Final GMM Criterion Q (b) = 1.86e-33. Initial weight matrix: Identity. GMM weight matrix: Robust
Table 13. Random effects and OLS estimation
Lastly, the model stability is detected by plotting the cumulative sum of recursive residuals (CUSUM) test as adopted by Appiah (Citation2018). CUSUM test enables us to discover how stable the estimated coefficients are. As we use a panel data analysis, the CUSUM test is easily applicable with a time series analysis. We thus follow Boukhelkhal and Bengana (Citation2018) in running the test on African economics individually, but only on the largest ones. Those largest economies in terms of GDP include Algeria, Angola, Egypt, Nigeria, and South Africa (IMF, Citation2015; World Bank, Citation2018). reveals the CUSUM situated in the 5% critical bounds. We thus conclude our estimated coefficients are stable and provide reliable findings.
Figure 4. Plot of cumulative sum of recursive residuals.
5. Conclusions and policy implications
Africa is immensely stricken by electricity insecurity issues. Given the very high vulnerability of Africa to climate change and its suffering from the energy financing gap; enhancing both FDIREI and REP is required simultaneously for mitigating energy poverty. As the existence of the FDIREI-REP-GDP nexus in Africa has yet to be examined, we obtained an unprecedented FDIREI dataset for our analysis purposes. This paper thus bridges this research gap by investigating the cointegration and causality association among FDIREI, REP, and GDP in Africa over 2003–2019.
To this end, we used the PVAR Granger causality model and static panel data model, followed by several robustness tests. Based on that, important results are reported. Interestingly, we find it is unnecessary to run the cointegration analysis as all variables employed are stationary at level. Further, we provide evidence of the growth hypothesis in Africa between 2003 and 2019, as the results confirm a unidirectional causality ran from REP to GDP. However, we did not find any empirical evidence of the causality between other variables. Besides, incomplete data of some renewable energy variables form the limitation of our paper. That highly emanates from the little attention given to African clean energy. But, several proxies can be used and robust methods can handle this issue, as the literature shows.
In light of our findings, some policy implications are introduced. The validation of the growth hypothesis (renewable electricity-led growth) is substantiated herein; REP thus is a key factor of Africa’s economic growth. Therefore, REP should be given more priority on the African policymakers’ agenda, which could be by REP promotion and expansion. Revitalizing REP financial and regulatory policies is highly recommended. Overall, REP should be augmented as a prime component in the energy banks in all African countries. Besides, effective attractive policies for enhancing green FDI should be enacted. Of course, reliable and regular datasets of GDP should be available in Africa. Lastly, future research should replicate our investigation into the FDIREI-REP-GDP relationship exclusively on Arabian countries. Many countries there still live under the electricity insecurity issues pressure.
Disclosure statement
No potential conflict of interest was reported by the author(s).
Additional information
Funding
Notes on contributors
Ahmed Rashed
Ahmed Rashed is a doctoral researcher at the University of Malaya, Faculty of Economics and Business, Department of Economics. He is a research assistant at the Helwan University in Egypt, Department of Economics and Foreign Trade. His research interests are currently in the field of International Economics, Renewable Energies, and African Economic Studies. He holds a master’s degree in Foreign Trade Economics from Helwan University, Cairo, Egypt.
Notes
1. We use “xtcsd, pesaran abs” and “xtcsd, frees” Stata commands to run Pesaran (Citation2004)and Frees (Citation1995)tests for CSD. “Xtcsd” Stata command introduced by De Hoyos and Sarafidis (Citation2006) allows multiple variables to be tested for cross-sectional independence at the same time.
2. For these panel unit root tests we use: “xtunitroot ht FDIREI, REP, and GDP” for HT test, and “xtcips FDIREI, REP, and GDP, maxlags (1) bglags (1) noc” for CIPS.
3. For the Hausman test, we run: “xtreg FDIREI REP GDP, fe”, “estimates store fixed”, “xtreg FDIREI REP GDP, re”, “estimates store random”, and “ hausman fixed random”, respectively.
4. To run OLS regression, we use “reg FDIREI REP GDP i.Year i.ID, vce (robust)” and for random effects regression “xtreg FDIREI REP GDP i.Year i.ID, re vce (robust)”. Vce (robust) option is employed to correct heteroskedasticity.
5. Selecting optimum lags we follow “varsoc FDIREI REP GDP, maxlag (8)”.
6. We first ran the panel VAR model typing “pvar FDIREI REP GDP, lags (2) fod vce(robust)”. The estimation is done by the generalized method of moment (GMM). Then based on the PVAR model estimates, we typed “pvargranger” to run the PVAR-Granger causality test. We use the options “fod” and “vce(robust)” to capture panel-specific fixed effects and to control for Heteroscedasticity in respective order (Abrigo & Love, Citation2016).
7. Stata command used is “xthrtest FDIREI REP GDP”.
8. Stata command is “vif”.
9. Stata command for OLS is “regress y x”, and for random effects is “xtreg y x, re”.
References
- Abrigo, M. R. M., & Love, I. (2016). Estimation of panel vector autoregression in Stata. Stata Journal, 16(3), 778–23. https://doi.org/10.1177/1536867x1601600314
- Acheampong, A. O., Adams, S., & Boateng, E. (2019). Do globalization and renewable energy contribute to carbon emissions mitigation in Sub-Saharan Africa? Science of the Total Environment, 677, 436–446. https://doi.org/10.1016/j.scitotenv.2019.04.353
- Adesola, S., & Brennan, F. (2019). Energy in Africa; Policy, Management and Sustainability. Palgrave Macmillan. https://doi.org/10.1007/978-3-319-91301-8
- African Development Bank Group. (2017). Annual Report 2017.
- African Development Bank Group. (2018). North Africa economic outlook. African Development Bank.
- Akinbami, O. M., Oke, S. R., & Bodunrin, M. O. (2021). The state of renewable energy development in South Africa: An overview. Alexandria Engineering Journal, 60(6), 5077–5093. https://doi.org/10.1016/j.aej.2021.03.065
- Amir, M., & Khan, S. Z. (2021). Assessment of renewable energy: Status, challenges, COVID-19 impacts, opportunities, and sustainable energy solutions in Africa. Energy and Built Environment. Advance online publication. https://doi.org/10.1016/j.enbenv.2021.03.002
- Amri, F. (2016). The relationship amongst energy consumption, foreign direct investment and output in developed and developing Countries. Renewable and Sustainable Energy Reviews, 64, 694–702. https://doi.org/10.1016/j.rser.2016.06.065
- Ankrah, I., & Lin, B. (2020). Renewable energy development in Ghana: Beyond potentials and commitment. Energy, 198, 117356. https://doi.org/10.1016/j.energy.2020.117356
- Appiah, M. O. (2018). Investigating the multivariate Granger causality between energy consumption, economic growth and CO2 emissions in Ghana. Energy Policy, 112(August2017), 198–208. https://doi.org/10.1016/j.enpol.2017.10.017
- Asiamah, M., Ofori, D., & Afful, J. (2019). A nalysis of the determinants of foreign direct investment in Ghana. Journal of Asian Business and Economic Studies, 26(1), 56–75. https://doi.org/10.1108/JABES-08-2018-0057
- Baldwin, E., Carley, S., Brass, J. N., & MacLean, L. M. (2017). Global renewable electricity policy: A comparative policy analysis of countries by income status. Journal of Comparative Policy Analysis: Research and Practice, 19(3), 277–298. https://doi.org/10.1080/13876988.2016.1166866
- Baye, R. S., Olper, A., Ahenkan, A., Musah-Surugu, I. J., Anuga, S. W., & Darkwah, S. (2020). Renewable energy consumption in Africa: Evidence from a bias corrected dynamic panel. Science of the Total Environment, 766, 142583. https://doi.org/10.1016/j.scitotenv.2020.142583
- Bhaskara, B. R. (1994). Cointegration for the applied economist. Palgrave Macmillan. https://doi.org/10.1007/978-1-349-23529-2
- Bigaignon, L., Fieuzal, R., Delon, C., & Tallec, T. (2020). Combination of two methodologies, artificial neural network and linear interpolation, to gap-fill daily nitrous oxide flux measurements. Agricultural and Forest Meteorology, 291(May), 108037. https://doi.org/10.1016/j.agrformet.2020.108037
- Bishoge, O. K., Kombe, G. G., & Mvile, B. N. (2020). Renewable energy for sustainable development in sub-Saharan African countries: Challenges and way forward. Journal of Renewable and Sustainable Energy, 12(5), 5. https://doi.org/10.1063/5.0009297
- Born, B., & Breitung, J. (2016). Testing for serial correlation in fixed-effects panel data models. Econometric Reviews, 35(7), 1290–1316. https://doi.org/10.1080/07474938.2014.976524
- Boukhelkhal, A., & Bengana, I. (2018). Cointegration and causality among electricity consumption, economic, climatic and environmental factors: Evidence from North-Africa region. Energy, 163, 1193–1206. https://doi.org/10.1016/j.energy.2018.08.163
- Chiawa, M. M., Torruam, J. T., & Abur, C. C. (2012). Cointegration and causality analysis of government expenditure and economic growth in Nigeria. International Journal of Scientific & Technology Research, 1(8), 165–174.
- De Hoyos, R. E., & Sarafidis, V. (2006). Testing for cross-sectional dependence in panel-data models. Stata Journal, 6(4), 482–496. https://doi.org/10.1177/1536867X0600600403
- Dunning, J. H. (2001). The Eclectic (OLI) paradigm of international production: Past, present and Future. International Journal of the Economics of Business, 8(2), 173–190. https://doi.org/10.1080/13571510110051441
- Esso, L. J., & Keho, Y. (2016). Energy consumption, economic growth and carbon emissions: Cointegration and causality evidence from selected African countries. Energy, 114, 492–497. https://doi.org/10.1016/j.energy.2016.08.010
- Eyraud, L., Clements, B., & Wane, A. (2013). Green investment: Trends and determinants. Energy Policy, 60, 852–865. https://doi.org/10.1016/j.enpol.2013.04.039
- Faeth, I. (2009). Determinants of foreign direct investment - A tale of nine theoretical models. Journal of Economic Surveys, 23(1), 165–196. https://doi.org/10.1111/j.1467-6419.2008.00560.x
- Falk, M. (2016). A gravity model of foreign direct investment in the hospitality industry. Tourism Management, 55, 225–237. https://doi.org/10.1016/j.tourman.2016.02.012
- Fan, W., & Hao, Y. (2020). An empirical research on the relationship amongst renewable energy consumption, economic growth and foreign direct investment in China. Renewable Energy, 146, 598–609. https://doi.org/10.1016/j.renene.2019.06.170
- fDi Markets. (2020). Foreign direct investment companies investing in Africa between 2003 and 2019. The Financial Times Limited, All Rights Reserved.
- Fondja Wandji, Y. D. (2013). Energy consumption and economic growth: Evidence from Cameroon. Energy Policy, 61, 1295–1304. https://doi.org/10.1016/j.enpol.2013.05.115
- Frees, E. W. (1995). Assessing cross-sectional correlation in panel data. Journal of Econometrics, 69(2), 393–414. https://doi.org/10.1016/0304-4076(94)01658-M
- Granger, C. W. J. (1969). Investigating causal relations by econometric models and cross-spectral methods. Econometrica, 37(3), 424–438. https://doi.org/10.2307/1912791
- Granger, C. W. J. (1988). Concept of causality. Journal of Econometrics, 39(1–2), 199–211. https://doi.org/10.1016/0304-4076(88)90045-0
- Gujarati, D. N. (2004). Basic Econometrics (Fourth ed.). McGraw-Hill Companies.
- Hassaballa, H. (2014). Testing for Granger causality between energy use and foreign direct investment Inflows in developing countries. Renewable and Sustainable Energy Reviews, 31, 417–426. https://doi.org/10.1016/j.rser.2013.12.011
- Holechek, J. L., Cibils, A. F., Bengaly, K., & Kinyamario, J. I. (2017). Human population growth, African pastoralism, and rangelands: A perspective. Rangeland Ecology and Management, 70(3), 273–280. https://doi.org/10.1016/j.rama.2016.09.004
- Ibrahiem, D. M. (2015). Renewable electricity consumption, foreign direct investment and economic growth in Egypt: An ARDL approach. Procedia Economics and Finance, 30(15), 313–323. https://doi.org/10.1016/S2212-5671(15)01299-X
- IEA. (2019). Africa energy outlook 2019 – Analysis scenarios. World Energy Outlook Special Report, 288. https://www.iea.org/reports/africa-energy-outlook-2019#energy-access%0Ahttps://www.iea.org/reports/africa-energy-outlook-2019#africa-case
- IEA. (2020). Global energy review 2020. https://doi.org/10.1787/a60abbf2-en
- IMF. (2015). World economic outlook: Adjusting to lower commodity prices. https://www.imf.org/external/pubs/ft/weo/2015/02/pdf/text.pdf
- IRENA. (2013). Africa’s renewable future the path to sustainable growth.
- IRENA. (2015). A renewable energy roadmap report. Irena, (June), 173. www.irena.org/remap
- IRENA. (2020). Scaling up Africa’s renewable energy deployment: Detailed overview of IRENA’s engagement and impact. (January), 1–82. www.irena.org%0Awww.irena.org/publications
- Johansen, S. (1991). Estimation and hypothesis testing of cointegration vectors in gaussian vector autoregressive models. Econometrica, 59(6), 1551. https://doi.org/10.2307/2938278
- Kalyoncu, H., Tuluce, N., & Yapark, Z. O. (2015). Determinants of foreign direct investment: An empirical. Journal of Economic and Social Studies, 5(2), 41–56. http://dx.doi.org/10.14706/JECOSS15524
- Kazimierczuk, A. H. (2019). Wind energy in Kenya: A status and policy framework review. Renewable and Sustainable Energy Reviews, 107(2019), 434–445. https://doi.org/10.1016/j.rser.2018.12.061
- Keeley, A. R., & Ikeda, Y. (2017). Journal of cleaner production. Determinants of Foreign Direct Investment in Wind Energy in Developing Countries, 161(May2017), 1451–1458. https://doi.org/10.1016/j.jclepro.2017.05.106
- Kenfack, J., Lewetchou, K. J., Bossou, O. V., & Tchaptchet, E. (2017). How can we promote renewable energy and energy efficiency in Central Africa? A Cameroon case study. Renewable and Sustainable Energy Reviews, 75(December2016), 1217–1224. https://doi.org/10.1016/j.rser.2016.11.108
- Khan, A., Hussain, J., Bano, S., & Chenggang, Y. (2020). The repercussions of foreign direct investment, renewable energy and health expenditure on environmental decay? An econometric analysis of B&RI countries. Journal of Environmental Planning and Management, 63(11), 1965–1986. https://doi.org/10.1080/09640568.2019.1692796
- Khatun, F., & Ahamad, M. (2015). Foreign direct investment in the energy and power sector in Bangladesh: Implications for economic growth. Renewable and Sustainable Energy Reviews, 52, 1369–1377. https://doi.org/10.1016/j.rser.2015.08.017
- Kiliçarslan, Z. (2019). The relationship between foreign direct investment and renewable energy production: Evidence from Brazil, Russia, India, China, South Africa and Turkey. International Journal of Energy Economics and Policy, 9(4), 291–297. https://doi.org/10.32479/ijeep.7879
- Kivyiro, P., & Arminen, H. (2014). Carbon dioxide emissions, energy consumption, economic growth, and foreign direct investment: Causality analysis for Sub-Saharan Africa. Energy, 74(C), 595–606. https://doi.org/10.1016/j.energy.2014.07.025
- Komendantova, N., Pfenninger, S., & Patt, A. (2014). Governance barriers to renewable energy in North Africa. International Spectator, 49(2), 50–65. https://doi.org/10.1080/03932729.2014.907627
- Kuamoah, C. (2020). Renewable energy deployment in Ghana: The hype, hope and reality. Insight on Africa, 12(1), 45–64. https://doi.org/10.1177/0975087819898581
- Latief, R., & Lefen, L. (2019). Foreign direct investment in the power and energy sector, energy consumption, and economic growth: Empirical evidence from Pakistan. Sustainability (Switzerland), 11(1), 1–21. https://doi.org/10.3390/su11010192
- Lema, R., Bhamidipati, P. L., Gregersen, C., Hasen, U. E., & Kirchherr, J. (2021). China’s investments in renewable energy in Africa: Creating co-benefits or just cashing-in? World Develpment, 141(2021), 105365. https://doi.org/10.1016/j.worlddev.2020.105365
- Maddala, G. S., & Kim, I. M. (1998). Unit roots, cointegration, and structural change. Cambridge university press.
- Magombeyi, M. T., & Odhiambo, N. M. (2017). Causal relationship between FDI and poverty reduction in South Africa. Cogent Economics & Finance, 5(1), 1357901. https://doi.org/10.1080/23322039.2017.1357901
- Masih, A. M. M., & Masih, R. (1996). Energy consumption, real income and temporal causality: Results from a multi-country study based on cointegration and error-correction modelling techniques. Energy Economics, 18(3), 165–183. https://doi.org/10.1016/0140-9883(96)00009-6
- Nguyen, T. N., & Wongsurawat, W. (2017). Multivariate cointegration and causality between electricity consumption, economic growth, foreign direct investment and exports: Recent evidence from Vietnam. International Journal of Energy Economics and Policy, 7(3), 287–293.
- Obeng-Darko, N. A. (2019). Renewable energy and power: A review of the power sector reform and renewable energy law and policy nexus in Ghana. Africa Review, 11(1), 17–33. https://doi.org/10.1080/09744053.2018.1538677
- OECD. (2013). Renewable energies in the Middle East and North Africa: Policies to support private investment. https://doi.org/10.1787/9789264183704-en
- Olanrewaju, B. T., Olubusoye, O. E., Adenikinju, A., & Akintande, O. J. (2019). A panel data analysis of renewable energy consumption in Africa. Renewable Energy, 140, 668–679. https://doi.org/10.1016/j.renene.2019.02.061
- Olubusoye, O. E., Musa, D., & Ercolano, S. (2020). Carbon emissions and economic growth in Africa: Are they related ? Cogent Economics & Finance, 8(1), 1850400. https://doi.org/10.1080/23322039.2020.1850400
- Opoku, E. E. O., & Boachie, M. K. (2020). The environmental impact of industrialization and foreign direct investment. Energy Policy, 137, 111178. https://doi.org/10.1016/j.enpol.2019.111178
- Ozturk, I. (2010). A literature survey on energy-growth nexus. Energy Policy, 38(1), 340–349. https://doi.org/10.1016/j.enpol.2009.09.024
- Pala, A. (2020). Energy and economic growth in G20 countries: Panel cointegration analysis. Economics and Business Letters, 9(2), 56–72. https://doi.org/10.17811/ebl.9.2.2020.56-72
- Pappis, I., Howells, M., Sridharan, V., Usher, W., Shivakumar, A., Gardumi, F., & Ramos, E. (2019). Energy projections for African countries. Luxembourg: Publications Office of the European Union. https://doi.org/10.2760/678700
- Peng, H., Tan, X., Li, Y., & Hu, L. (2016). Economic growth, foreign direct investment and CO2 emissions in China: A panel granger causality analysis. Sustainability (Switzerland), 8(3), 1–13. https://doi.org/10.3390/su8030233
- Pesaran, M. H. (2004). General diagnostic tests for cross section dependence in panels (CESifo Working Paper Series No. 1229. IZA Discussion Paper No. 1240). Bonn, Germany.
- Santos Silva, J. M. C., & Tenreyro, S. (2006). The log of gravity. Review of Economics and Statistics, 88(4), 641–658. https://doi.org/10.1162/rest.88.4.641
- Sbia, R., Shahbaz, M., & Hamdi, H. (2014). A contribution of foreign direct investment, clean energy, trade openness, carbon emissions and economic growth to energy demand in UAE. Economic Modelling, 36, 191–197. https://doi.org/10.1016/j.econmod.2013.09.047
- Shahbaz, M., Balsalobre-Lorente, D., & Sinha, A. (2019). Foreign direct Investment–CO 2 emissions nexus in Middle East and North African countries: Importance of biomass energy consumption. Journal of Cleaner Production, 217, 603–614. https://doi.org/10.1016/j.jclepro.2019.01.282
- Shahbaz, M., Raghutla, C., Chittedi, K. R., Jiao, Z., & Vo, X. V. (2020). The effect of renewable energy consumption on economic growth: Evidence from the renewable energy country attractive index. Energy, 207, 118162. https://doi.org/10.1016/j.energy.2020.118162
- Ssali, M. W., Du, J., Mensah, I. A., & Hongo, D. O. (2019). Investigating the nexus among environmental pollution, economic growth, energy use, and foreign direct investment in 6 selected sub-Saharan African countries. Environmental Science and Pollution Research, 26(11), 11245–11260. https://doi.org/10.1007/s11356-019-04455-0
- Studenmund, A. H. (2017). Using econometrics: A practical guide (Seventh ed.). Pearson.
- UNCTAD. (2020). World investment report. New York, United Nations.
- United Nations. (2020). World Economic Situation Prospects. New York, United Nations.
- Wooldridge, J. M. (2009). Introductory econometrics: A modern approach. South-Western Cengage Learning.
- World Bank. (2016). Poverty in a rising Africa. Africa poverty report overview. Washington, DC: Author.
- World Bank. (2018). Africa’s pulse: Analysis of issues shaping Africa’s economic future. Washington, DC: Author. https://doi.org/10.1596/978-1-4648-1291-0
- Wursten, J. (2018). Testing for serial correlation in fixed-effects panel models. Stata Journal, 18(1), 76–100. https://doi.org/10.1177/1536867x1801800106
- Yilanci, V., Ozgur, O., & Gorus, M. S. (2019). The asymmetric effects of foreign direct investment on clean energy consumption in BRICS countries: A recently introduced hidden cointegration test. Journal of Cleaner Production, 237, 117786. https://doi.org/10.1016/j.jclepro.2019.117786
Appendix
Country List
In light of data availability, those countries included in the analysis: Algeria- Angola- Benin- Burkina Faso- Burundi- Cameroon- Cote d’ Ivoire- Democratic Republic of Congo- Egypt- Ethiopia- Gabon- Ghana- The Gambia- Kenya- Liberia- Libya- Mali- Mauritius- Morocco- Mozambique- Namibia- Nigeria- Rwanda- Senegal- Sierra Leone- South Africa- Tanzania- Togo- Tunisia- Uganda-Zambia- Zimbabwe.
