
 ?Mathematical formulae have been encoded as MathML and are displayed in this HTML version using MathJax in order to improve their display. Uncheck the box to turn MathJax off. This feature requires Javascript. Click on a formula to zoom.
Abstract
The study analyses the role of RTAs in determining the export efficiency of India using a stochastic frontier version of the gravity model. We estimate the impact of select RTAs (bilateral, SAFTA, APTA, ASEAN, and MERCOSUR trade bloc) and the partner nation’s regulatory quality on India’s export efficiency throughout 2008–2018. The findings suggest that India has been substantially able to exploit exports efficiency to its trading partners under FTAs (ASEAN&SAFTA) and bilateral agreements compared to PTAs (MERCOSER&APTA); however, India’s exports are yet quite far from the potential frontier. Excluding APTA, all other agreements are statistically significant, implying that joining trade agreements augments India’s export efficiency. The study finds that the regulatory quality of importing nations bears a significant positive impact on India’s export efficiency. This highlights the importance of good institutions and better regulatory quality in realizing the potential level of exports with partner nations.
PUBLIC INTEREST STATEMENT
The study analyses the impact of select RTAs (bilateral, SAFTA, APTA, ASEAN, and MERCOSUR trade bloc) and the partner nation’s regulatory quality in realizing India’s export efficiency throughout 2008–2018. The study is timely and compelling given the Indian government’s impetus to stimulate value-added domestic manufacturing by actively venturing into signing RTAs to expand its export markets, promoting India as a global manufacturing hub. The findings suggest that India has been able to exploit exports efficiently to its trading partners under FTAs (ASEAN&SAFTA) and bilateral agreements compared to PTAs (MERCOSER&APTA), where the exports are yet quite far from the potential frontier. The findings further suggest that excluding APTA, joining the select regional integrations have contributed towards augmenting India’s export efficiency. The study also highlights the importance of good institutions and better regulatory quality in realizing the export potential with partner nations, as in the case of India.
1. Introduction
In recent years, the world has observed an accelerated proliferation of regional trade agreements (RTA). RTAs overcoming trade barriers have been the World Trade Organization’s (WTO) hallmark that encourages governments worldwide to implement trade-led growth strategies and integrate them into the multilateral trading system (UNCTAD, Citation2015). Economists often have dissenting opinions, but the advantage of RTAs over “protection” is primarily not debatable (Rodrik, Citation2018). Agreements play a catalytic role in reducing the tariff and non-tariff barriers to enhance trade between partners and leverage shared complementarities of each other’s industries (Paul, Citation2017). The development level of member nations in a regional agreement may vary; however, being part of the agreement, economies exploit comparative advantage to enhance economic growth (Gharleghi & Shafighi, Citation2020). The principle of comparative advantage and gains from trade are fundamental pillars in economics; hence, nearly unanimous support for RTAs, free or preferential in principle, is reasonable. Free trade agreements (FTA) primarily eliminate or reduce tariff and non-tariff barriers on substantial trade between partner countries. In contrast, preferential trade agreements (PTA) only reduce tariffs on the agreed number of tariff lines (products), giving preferential access to products from partner nations.
The policymakers have frequently used RTAsFootnote1 in both developed and developing nations to promote bilateral trade (Xuepeng Liu, Citation2016); however, the global landscape of production and trade agreements has significant implications for developing nations. Trade liberalization and economic integration policies promote export as a powerful instrument stimulating economic growth, known as export-led growth (Clarke et al., Citation2017; Elliott et al., Citation2019), which has considerably deepened the global value chains (GVC) and international production networks in the Asian region (Chakraborty et al., Citation2019). Over the last three decades, East Asian economies’ export-led strategy supported by strong economic development and notable structural transformations has significantly contributed towards global trade (Hartmann et al., Citation2020).
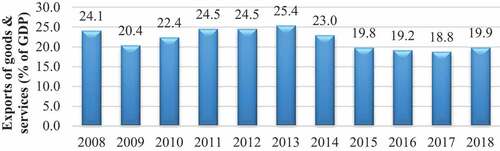
India’s RTAs merit special attention as an emerging superpower since integration into global trade is increasingly critical to attaining India’s economic growth targets. India’s goods & services export (later referred to as total exports or exports) has notably fluctuated from 24.1% of GDP in 2008 to 19.9% in 2018 ().
Figure 1. India’s Total Export (Goods & services) as a % of GDP (2008–18)
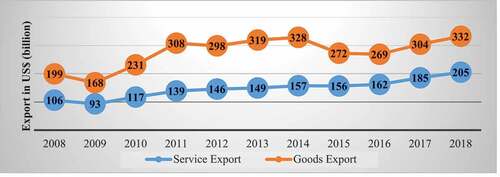
Over the period (2008–2018), service exports recorded a growth of 94% ($139 to$205 billion) vis-à-vis 66% ($200-$332billion) in goods. Over 2011–2018, goods export has stagnated with ~7% overall growth compared to ~55% in services (). The stagnating exports (as a % of GDP) during 2014–16 was mainly attributed to the challenging global economic situation and plunge in the crude oil prices contracting global trade (Lewis & Monarch, Citation2016). The limited diversification of India’s export basket with the top 10 principal exports comprising 78% of India’s total goods export also contributed to further deterioration. The exportfall extended until 2017, owing to initial impediments of economic reforms, demonetization in late 2016, followed by GST implementation in 2017 (Venkatesh & Grover, Citation2018).
Figure 2. India’s Goods & Service Exports (2008–2018)
The ongoing US–China trade war, pandemic and Brexit warn towards the possibility of a shift in the global trade paradigm. Since 2012, India has not signed any trade agreement; however, to stimulate exports, the Indian government presently is in consultation for the possible FTA with the European Union and the US, following the global trend of building regional trade integration. The overall trade integration positively impacts manufacturing employment in developing countries by expanding the scale of production (Sen, Citation2019). India currently has 42 trade agreements (preferential and free) either in effect (13) or under negotiation or consultation. Saraswat et al. (Citation2018) suggest that Indian exports have a vast potential market in the United States (US), highlighting the absolute difference between potential and actual exports to be $18.6 billion.
The augmented gravity model is a popular technique to assess trade potential and efficiency following agreements between trade blocks or nations (Chaney, Citation2018; Maciejewski & Wach, Citation2019). The “potential” relates to the maximum possible trade achievable under the frictionless trade scenario, whereas “trade efficiency” indicates the extent of realized trade potential. The extent of RTAs aiding member nations exploiting trade potentials has been widely researched among academicians (Gharleghi & Shafighi, Citation2020; Laget et al., Citation2020); however, there are not many studies concerning India. The Indian government has been actively venturing into signing RTAs to expand its export market and ensure access to the required raw materials stimulating value-added domestic manufacturing, promoting India as a global manufacturing hub. Therefore, considering the importance of exports for the Indian economy, it is imperative to examine the role of RTAs in realizing exports potential and efficiency. Furthermore, including India’s trading partners’ regulatory quality and inward FDI as the determinants of India’s export efficiency helps evaluate the institutional quality and foreign investments in promoting exports. The present research investigates the role of India’s select RTAs (South-Asian Free Trade Agreement (SAFTA), Asia Pacific Trade Area (APTA), MERCOSUR (Mercado Común del Sur) trade bloc, ASEAN (Association of Southeast Asian Nations) – India FTA and bilateral FTAs (see Annex: ) in determining export efficiency levels using a stochastic frontier (SF) version of gravity model estimated via panel data over the period 2008–2018. Findings suggest that India has considerably exploited exports efficiency to its trading partners under FTAs (ASEAN&SAFTA) and bilateral agreements compared to PTAs (MERCOSUR & APTA).
2. Review of literature
The gravity model of trade is among the most widely used approaches in modern econometrics. Since its first introduction by Ravenstein (1885) in the nineteenth century to model migration flows, the gravity model has a long distinguished history of applications across disciplines and high experimental importance (Kabir et al., Citation2017; Morland et al., Citation2020). In the early 60s, Tinbergen (Citation1962) formally conceptualized the gravity model to analyze international trade at the macro level empirically. According to the conventional model, bilateral trade between two nations is proportional to their respective sizes, measured by their GDPs and inversely proportional to the geographic distance, a proxy for transportation cost. Furthermore, the standard gravity model has been augmented with a number of variables such as exchange rates, income and TAs and shifting demand patterns to test their relevance in influencing trade (Osabuohien et al., Citation2019).
The stochastic frontier (SF) approach, developed by Aigner et al. (Citation1977) and Meeusen and van Den Broeck (Citation1977), was initially used to estimate production efficiency. Later, Kalirajan (Citation2007) proposed the SF version of the gravity model to estimate TAs effect on Australian export performance. The study suggests that TAs enhanced Australian exports by 15% among its trading partners. Since then, the SF gravity model has been popularly used to estimate the impact of non-conventional or “behind the border” factors on the country’s exports (Nguyen, Citation2020). Researchers seeking evidence of a trade-enhancing effect of economic integration widely employ the SF version of the gravity model to calculate a country’s export potential and efficiency (Atif et al., Citation2019; Boffa et al., Citation2019).
RTAs, in general, are believed to enhance intra-regional trade (Ngepah & Udeagha, Citation2018). Kumar and Prabhakar (Citation2017) assert that over the period 2000–2014, India’s select bilateral agreements and ASEAN FTA have successfully enhanced bilateral trade efficiency between India and the partner nations. Bilateral trade between small developing member economies primarily benefits from RTAs (Freckleton & Whitely, Citation2020). The RTAs have significantly promoted bilateral trade due to trade complementarity among the Economic Community of West African States (ECOWAS) (Osabuohien et al., Citation2019) and service trade in the Nordic region (Nordas, Citation2018).
Recent SF gravity approach studies estimate the trade flows with a sector-specific focus (Atif et al., Citation2017; Jiang & Nguyen, Citation2021). Investigating the export potential of the IT-telecommunications sector in emerging Asian, North American and European economies Nasir and Kalirajan (Citation2016) found that Asian countries export efficiencies are significantly below their potential frontiers vis-à-vis developed economies. However, Asian nations have a better chance as Miao et al. (Citation2020) suggests that China’s belt and road initiative would significantly reduce trade barriers in the Asian region, promoting potential trade among partner nations.
Guloglu and Bayar (Citation2016) finds that besides RTAs, the partner nations’ exchange rate and domestic productivity also significantly affect Turkey’s chemical exports. Studies report that the exchange rate volatility negatively influences Pakistan’s (Hassan et al., Citation2017; Mahmood & Alkhateeb, Citation2018) and Vietnam’s (Nguyen and Trinh (Citation2019) export to its partner nations. FDI has broadly been identified as a vital financing force enhancing economic growth and export performance in developing nations. However, Mohanty & Sethi (Citation2021)asserts that because FDI does not work uniformly in all sectors, policymakers should formulate sector-specific FDI policies to boost exports. Ghoshal (Citation2015) interestingly reveals that trade agreements have reversed the relationship between export and growth. The author finds confirmation of the export-led-growth hypothesis during pre-trade agreement periods, whereas post-trade agreement period sees growth as the cause of exports.
3. Methodology
The study takes wisdom from theoretical and empirical literature, highlighting that RTAs improve trade and production efficiency. To overcome the inherent biases of the conventional time-varying gravity model that did not segregate individual heterogeneity from inefficiency, the study adopts SF gravity model introduced by Kalirajan (Citation1999) to estimate India’s export efficiency. The SF gravity model combines a gravity model with a stochastic frontier approach to efficaciously capture inefficiency or the unquantified multilateral resistances, the cause of time-invariant heteroscedasticity, distinctly into a technical inefficiency term. Concerning robustness to outliers, SF is preferred over OLS because besides yielding unbiased estimates of the frontier parameters; the estimates are more robust to skewness of the residuals implied by inefficiency. It also addresses the endogeneity issue arising from the inclusion of RTA dummies and aids in interpreting the impact of various trade resistances, including RTAs, on trade efficiency and trade flows (Kumar & Prabhakar, Citation2017). The study employs Battese and Coelli’s (Citation1995) specification to estimate India’s export efficiency using the single-stage SF gravity approach in panel data settings.
The SF model is motivated by the theoretical idea that no economic agent can exceed the ideal “frontier”, and deviations from this extreme represent individual inefficiencies (Belotti et al., Citation2013). It is an innovative tool to estimate reliable efficiency scores and variation between actual and potential values. When a country achieves its maximum trade capacity, the exports are assumed to be 100% technically efficient. The error term’s inefficiency component (ui) is the log difference between the maximum and the actual output; therefore, ui x100% is the % by which actual output can be increased using the same inputs if production is fully efficient (Doan & Xing, Citation2018). Explicitly, it relates to the % of output lost due to technical inefficiency. The estimated value of ui is the output-oriented technical inefficiency, and the value nearing 0 suggests fully efficient production (Ahmadzai, Citation2017). To accurately interpret the efficiency determinants, it should be noted that the dependent variable is the one-sided error term denoting technical inefficiency. Therefore, positive signs of the coefficient indicate technical efficiency-reducing factors, and negative signs reveal technical efficiency-enhancing factors (Paudel et al., Citation2020).
Among the various trade resistance between the partners, the study focuses on the RTAs as a determinant of India’s export potential and efficiency. The model proposes to test the effectiveness of India’s active RTAs on export promotion and trade efficiency. The fundamental stochastic frontier model is outlined as follows:
where Yjit indicate the exports from India to country i at time t, xjit are vectors (1*k) of the known parameters determining exports associated with country i and/or India at time t
β is a vector (k*1) of parameter coefficients to be estimated
Vit is the conventional error term assumed to be iid with mean 0 and variance σv2
Uit is the one-sided error term with observation-specific mean and “variance of its pre-truncated distribution”.
The model assumes that the one-sided error term is “truncated normally distributed” (Battese & Coelli, Citation1995) with a mean μ and variance σ2. If there is a difference between India’s actual and potential exports, the error term’s value will be greater than zero but less than one. This implies that the impact of trade resistances exists and have a negative effect on the efficiency of exports. However, if the one-sided error takes a value of zero, it implies no difference between the actual and potential exports between India and its trade partners.
The equation above is the SF equation for India’s exports. However, the inefficiency effect Uit is assumed to be a function of a set of independent variables. Thus, the inefficiency effect of Uit in the SF equation is stated below as:
where zit would be the vector (1*m) of explanatory variables related to India’s export inefficiency over time t; δ would be the vector (m*1) of unknown coefficients and Wit is “defined by the truncation of the normal distribution with zero mean and variance σ2” (Kalirajan, Citation2007).
The parameters for the technical efficiency is estimated using EquationEq. (3)(3)
(3) . The study employs a built-in function in STATA for estimating uit, based on the inefficiency model proposed by Battese and Coelli (Citation1995). Estimating trade efficiency requires a hypothetical trade frontier representing maximum trade capacity achievable under the free trade proposition. The earlier studies applied a conventional two-stage SF procedure to explore determinants of technical inefficiency. The first stage predicts observation specific inefficiency estimates and the second stage regresses the inefficiency estimates obtained from the first stage on the vector of inefficiency determinants. Wang and Schmidt (Citation2002) highlights that the neglected resistance variables in the first stage affecting the final inefficiency estimates is the main drawback of this approach. Thus, “z” not being included in the first stage spurs the omitted variable bias issue. The single-stage estimation, where both equations are executed simultaneously, is the proposed solution to the possibility of omitting unobservable resistances and the consequent heteroscedastic error through the one-sided error term and its possible determinants. This process assumes that vit and uit are iid of each other and the explanatory variables. In this approach, the assumed relationship between “z” and the trade efficiency is imposed in the frontier equation to estimate export inefficiency levels. Hence, the present study employs a single-stage panel SF model for efficiency estimation.
The SF analysis does not require a priori knowledge of trade resistance variables’ effects on exports. Moreover, the SF approach does not require prior knowledge about the direction and magnitude of the effects that the explanatory variables included in the equation have on exports. These factors can be verified post-estimation to ensure the robustness of the resulting efficiency estimates. Kumar and Prabhakar (Citation2017) state that the single-stage estimation procedure can also accommodate exogenous variables’ non-monotonic trade efficiency effects.
4. Data & model specification
The data utilized in the study has been sourced from the World Bank’s World Integrated Trade Solutions (WITS) database (exports from India), World Bank open database (GDP, exchange rate, total FDI inflow in India), the CEPII (Centre d’Etudes Prospectives et d’Informations Internationales) database (geographical distance), the World Governance Index database (regulatory quality) and the World Trade Organisation and the Ministry of Commerce & Industry website for data on active Indian trade agreements. The estimated empirical model intends to assess the impact of active RTAs on India’s export efficiency from 2008 to 2018. The sample contains 167 countries with a total of 1829 observations.
For the stochastic frontier trade function to be estimated, we specify a gravity equation augmented with the domestic exchange rate vis-a-vis the partner economy’s exchange rate:
The technical inefficiency effects Uit in our specification are assumed to be defined by the following variables,
where ln denotes the natural logarithm
Exportsjit denotes the total exports from country j (India) to country i for the time period t
GDPit is the Nominal GDP of the importing country i during the time period
GDPjt is the Nominal GDP of the exporting country j during the time period t
DistCapjit is the straight-line distance between the capitals of country j & country i
EXRjt is the exchange rate of country j (LCU per dollar US)
EXRit is the exchange rate of country i (LCU per dollar US)
Vit is the random error term that is assumed to be iid with N (0, σv2) at period t
Uit is the one-sided error term that has observation-specific mean and variance of its pre-truncated distribution
Bilateral Agreementjit is a dummy variable that is assigned a value of 1 if India has an active bilateral FTA/PTA with country i during the time period t
ASEANjit is the dummy variable for the ASEAN trade agreement that is assigned a value of 1 if the agreement is active during period t, otherwise zero
MERCOSURjit is the dummy variable capturing the PTA India has signed with four South American nations
SAFTAjit dummy captures the active South-Asian Free Trade Agreement for period t
RegQualit is the regulatory quality of the importing country i
FDIjt is the total FDI inflows into country j during the time period t
i is the importing country, j is the exporting country India and t is the time indicator (annual)
The agreements considered for the analysis are Bilateral agreements (active), ASEAN-India FTA, the India-MERCOSUR PTA, Asia Pacific Trade Agreement (APTA) PTA and South Asia Free Trade Area (SAFTA). India signed an FTA with ASEAN for goods in 2010, which in 2014 was extended to include both services and investments. It aims to lower tariffs on traded goods and services among the ASEAN member nations. APTA comprising India, Bangladesh, China, South Korea and Sri Lanka came into force in 1975. APTA was initially signed as the Bangkok Agreement in 1975, later renamed APTA in 2005. Mongolia joined as its seventh member in 2020. SAFTA came into force in 2006 when India and seven other neighbouring nations signed the agreement, which was considered the successor to the 1993 SAARC PTA. In 2004, India signed the MERCOSUR PTA with the MERCOSUR trade bloc comprising Brazil, Argentina, Uruguay and Paraguay. The agreement came into effect in 2009 and aimed to promote trade between India and the bloc via reciprocal tariff preferences, with the ultimate objective of free trade.
The study adopts importing and exporting nations GDP as a measure of economic size. A larger economic size of the partner economy is expected to positively influence Indian exports since it represents an extensive market with significant trade potential for India. The GDP of an importing nation also indicates the country’s demand propensity, whereas, for an exporting nation, it signifies its ability to supply (Kabir et al., Citation2017). The literature suggests that using real GDP data instead of nominal GDP leads to biases on account of a single common numeraire when country-pair-specific numeraires are needed but unavailable. However, using nominal GDP in connection with time effects addresses this problem (Baldwin & Taglioni, Citation2006; Shepherd et al., Citation2019). Hence, the study considers nominal GDP as an explanatory variable in the present gravity specification. India’s rising GDP is expected to have a positive effect on the outward export to partner nations.
While constructing the gravity model, distance is negatively linked with trade flows and reported negative by several scholars. The distance variable is deemed a proxy for transportation cost. Greater geographical distances increase the final price of exports, indicating a negative relationship between distance and trade volumes (Jan & Shah, Citation2019). Glaeser and Kohlhase (Citation2004) found that 80% of the shipments occur in industries where transport costs are less than 4% of the total value. However, the impact of distance could also be reflected through cultural differences and unfamiliarity between two nations far apart (Ghosh et al., Citation2017). Investigating the UKs export pattern, Carrère et al. (Citation2020) confirm that the UK’s export tends to fall with distance. However, Nordås (Citation2018) found that the distance does not significantly affect Nordic nations service trade such as computer services, financial services, insurance.
The augmented gravity models by Bergstrand (Citation1985) and Dell’Ariccia (Citation1999) employ exchange rates to explain bilateral trade variation. Our study adopts the exchange rate specification used by Binh et al. (Citation2013) to calculate the exchange rate as below:
The above ratio determines India’s annual average exchange rate per unit of the importing country’s exchange rate. An increase in this ratio would imply a depreciation of India’s exchange rate, which should theoretically help boost exports. The variable is thus expected to have a positive effect on the total value of exports.
FDI is assumed to promote export-led growth by supporting the host economy’s processing and manufacturing industries, import substitution industries, R&D, and linkages between domestic and foreign firms (Doan & Xing, Citation2018). FDI positively influence export sophistication; however, this only holds if the investments are driven by the “production for export” motive (Zhu & Fu, Citation2013). Often, foreign investments aim to circumvent trade barriers in the host economy to produce for local domestic consumption. These are considered “market seeking FDI” and do not have a direct bearing on export promotion.Proposed that resource- and efficiency-seeking investors are more export-oriented than market or strategic asset seekers. His findings indicate that FDI does not influence India’s export potential in the short run; however, it has a negative but insignificant impact in the long run. Thus, to test whether FDI inflows support India achieve export efficiency, we consider FDI inflows as an explanatory variable in the inefficiency equation.
Regulatory quality of importing nations is also included in estimating the inefficiency equation as a variable that is not a conventional determinant of trade but is assumed to significantly influence trade in the present times (Das et al., Citation2018). Regulatory quality is indicative of importing nation’s government’s perception. The perception relates to the government’s ability to formulate and implement policies that protect private-sector participants and promote their development (Miao et al., Citation2020). The improved quality of governance results in a three-fold increase in trade between commonwealth members belonging to an existing RTA by three folds (Khorana & Martínez‐Zarzoso, Citation2020). The study also presumes that a higher regulatory quality of the importing nation would positively affect the export efficiency of India. However, the potential effect of the variable is not known apriori (Kumar & Kumar, Citation2015).
5. Empirical findings & discussion
As illustrated in the previous section, the study aims to understand the impact of trade agreements on India’s export potential and efficiency. Findings of the SF gravity models are presented in below:
Table 1. Results of the Stochastic Frontier Gravity Model
From the obtained coefficients, the study concurs that the market size of India’s trading partners has a significant positive impact on India’s total export value. The coefficient of India’s GDP is also statistically significant, providing evidence that economic size significantly impacts bilateral trade. A similar hypothesis is proved by Žmuk and Jošić (Citation2021) and Das et al. (Citation2018). Findings suggest that an overall impact of a percentage increase in the partner economy’s GDP on India's exports (~1.3%) is more compared to a percentage increase in India’s GDP (~0.21%). Despite the consistent increase of India’s total share in global exports, the value of goods and services consumed within the domestic economy has also gone up significantly, over 13% in the last decade (BCG Report, Citation2019). It could be inferred that the rising production level in India is mainly domestic demand-driven than export-driven. The findings further indicate that FDI inflow reduces the technical efficiency of exports, further supporting the consumption argument. It implies that foreign investments flowing into India are essentially market seeking (Saini & Singhania, Citation2018), unlike efficiency-seeking in Vietnam and other export promoting nations in the Asian region (Doan & Xing, Citation2018). Mohanty & Sethi (Citation2021) also reports that inward FDI negatively influences India’s exports in the long run.
The distance variable is found to be negative but insignificant. This indicates that distance is not a significant determinant of India’s trade efficiency with partner nations. Over the last decade, Indian exports nearly doubled from $305 billion (2008) to $537 billion (2018), comprising 94% growth in merchandise and 66% growth in service exports. However, from 2011 till 2018, service exports recorded a significant ~50% growth vis-à-vis ~8% in goods, thus holding a larger share in the total export basket. It could be inferred that since services do not entail physical trades and rely more on external demand, human capital, openness and information communication infrastructure, distance has an insignificant influence on the value of services (Malik & Velan, Citation2020).
As expected from the theoretical relationship traditionally established between exports and exchange rates, India’s exchange rate’s depreciation vis-a-vis its partner economy positively influences exports. Depreciation of the Indian rupee allows foreign nations to import more goods and services per dollar, thus making Indian exports more competitive than the partner economy’s domestic market. We notice a 0.2% increase in exports for every percentage point depreciation in the value of the Indian rupee. The study by Venkatraja (Citation2018) also reports similar findings.
As presumed, the results confirm that partner nations regulatory quality significantly enhances India’s technical export efficiency. Regulatory quality indicates the ability of the government to formulate and implement sound policies and regulations that minimize regulatory inefficiencies such as red-tapism, corruption, lengthy procedures, unclear rules, and trade restrictions (Khorana & Martínez‐Zarzoso, Citation2020; Majeed et al., Citation2021) that otherwise inflates the trading cost and impacts international trade and competitiveness (Takele, Citation2019). Studies indicate that nations in the present times consistently aim to improve their regulatory quality to deepen the coverage of bilateral trade among the regional members (Fiorini & Hoekman, Citation2018), and India seems to benefit from it.
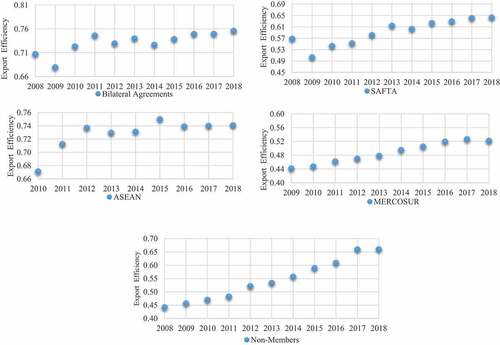
Analysing the effects of RTAs on India’s export efficiency, we find that joining the RTAs considered in the study, such as Bilateral, ASEAN, SAFTA or MERCOSUR, except APTA technically enhances India’s export efficiency. exhibits the computed export efficiency, employing widely used Battese and Coelli’s (Citation1995) specification in the SF estimation technique (Nguyen, Citation2021). Findings suggest that India has been successfully increasing exports to the member nations except for APTA nations, where the trade gap has exponentially expanded in favour of other member nations, with imports dominating exports (PHD Report, Citation2018). Excluding APTA, all other agreements are statistically significant, implying that RTAs increases India’s technical export efficiency. The ASEAN and Bilateral agreements are statistically significant at 5%, whereas SAFTA and MERCOSUR are at 10%, respectively. The obtained coefficients and their statistical significance highlight the importance of negotiating RTAs to capitalize on more significant volumes of exports.
Table 2. Export Efficiency Estimates
As evident from , India has realized 61% (overall mean) export efficiency with member nations, relatively higher than the mean export efficiency with non-member partners (54%). The study notes that bilateral agreements have the highest realized export potential at 73%, followed by ASEAN (71%), SAFTA (59%), APTA (56%) and MERCOSUR (48%). Consistent rise in the value of total Indian exports has increased realized export potential (). India’s bilateral agreements (73%) and FTAs (66%) have significantly enhanced overall export efficiency by eliminating trade resistances vis-a-vis PTAs (53%). Kumar and Prabhakar (Citation2017) also report that ASEAN and Bilateral agreements have significantly enhanced India’s exports efficiency moving towards the frontier levels. However, the findings further reveal that SAFTA, compared to ASEAN–India FTA, is a weak agreement with limited regional complementarities restricting intra-regional trade expansion even under the free trade mechanism (Jain, Citation2019).
Figure 3. India’s export efficiency with Members and Non-Member
The shallow nature of India’s agreements, entailing limited trade liberalization, is one of the crucial reasons why PTAs do not significantly alter India’s export efficiency (Krishna, 2019). Rules of origin, which qualifies only specific goods for the preferential treatment under RTAs, impose added trade barriers between partners and undermine trade creation potential (Doan & Xing, Citation2018). The results suggest a weak trade relationship between India and MERCOSUR bloc. India’s total export share to MERCOSUR has slightly dropped from 1.5% to 1.3% over 2008–2018 (World Bank). Besides limited trade liberalization in India, MERCOSUR economies also have highly protectionist trade policies with several tariffs (10%, higher than the world average) and non-tariff barriers, which restrains trade owing to high trading costs (Bartesaghi, Citation2019). However, the comparative advantage index between India and MERCOSUR, estimated by (Verma & Dhami, Citation2021), suggest a significant complementarity between both economies and great potential in this trade relationship. Acknowledging the same, India has been reaching out to MERCOSUR members to fast track negotiations to expand existing PTA and upgrade India– MERCOSUR relations into a more comprehensive economic partnership agreement (Siddiqui, Citation2021).
Broadly, the estimates are consistent as expected. However, to check the robustness of the model, the baseline (original) model specification is modified by adding two more dummy variables, “Contiguity” indicating whether trading nations are contiguous and “colony” denoting if the trading partner ever colonized India. Also, instead of using four dummies ASEAN, APTA, MERCOSUR, SAFTA, we used FTA (comprising ASEAN & SAFTA) and PTA (comprising APTA & MERCOSUR) to estimate the newly specified model. The new model’s estimates and corresponding statistical significance do not vary much compared with the baseline model results (Annex: ). Therefore, we consider the estimates of the baseline model to be robust. The results suggest that bilateral agreements, FTAs and PTAs are technical efficiency-enhancing factors; however, only FTA and bilateral agreements are statistically significant.
6. Conclusion
This paper mainly evaluates the role of select RTAs in determining India’s export efficiency levels using the SF version of gravity model over 2008–2018. The empirical findings suggest that India’s exports to its regional trade partners are significantly below the potential frontier. While the ASEAN-India FTA (71%) and Bilateral agreements (73%) aided India in attaining significant export efficiency, not much could be achieved through APTA (56%) and MERCOSUR PTA (48%). SAFTA is also a weak agreement as it did not support India achieve much of its export potential (59%). Nevertheless, compared to India’s trade with partner nations, the export efficiency achieved with the non-member nations has been extremely sluggish. The study proposes that the importing partner’s regulatory quality significantly enhances India’s export efficiency; however, the conditional trade liberalization in India and partner nations impedes India from reaching its potential export frontier and actively participating in the global value chain (GVC). Harmonizing regulatory standards and minimizing inadvertent trade restrictions are crucial to promoting cross-border trade and for economies to benefit from globalization and international competition. Findings further indicate that inward FDI does not contribute towards enhancing India’s export efficiency. It confirms the market-seeking motive of foreign investors and their limited participation in export-oriented manufacturing sectors, which does not help broaden India’s export basket. India must strategize its FDI policies favoring export promoting sectors, enhancing its export basket and global competitiveness. Despite India’s exchange rate favoring exports, India has a limited GVC participation with significant export potential still untapped. Findings also indicate the insignificant impact of distance on India’s export efficiency. It could be inferred that geographical distance does not significantly affect India’s rising service exports, for instance, computer services, financial services and insurance, which have recorded a remarkable growth of ~50% vis-a-vis merchandise (~7%) from 2011 till 2018.
Regardless of past outcomes, it is clear that India needs global market accessibility to propel its economy. Market access is essential, but domestic productivity and competitiveness are also crucial. The study recommends that RTAs be signed, keeping two things in mind; mutually reciprocal terms with maximum trade liberalization and focusing on products and services with maximum export potential. Efforts should be made to channelize FDI into the export-oriented manufacturing sectors, to enhance the export basket and global competitiveness. The results have implications for policymakers to apprehend India’s untapped export potential with the partner nations and assess the effectiveness of policies promoting trade integration reforms encouraging GVC participation. How India manages both these issues will crucially determine its development trajectory over the coming years.
Disclosure statement
No potential conflict of interest was reported by the author(s).
Additional information
Funding
Notes on contributors

Leena Ajit Kaushal
Leena Ajit Kaushal is faculty in Economics at Management Development Institute (MDI), Gurgaon, India. She did her PhD in Economics and Masters in Business Economics (MBE) from Devi Ahilya University, India. She has received Postgraduate Certificate in Academic Practice from Centre for the Enhancement of Learning and Teaching (CELT), Lancaster University, UK and holds a status of ‘Associate of United Kingdom Higher Education Academy’. She has authored and co-authored quite a few books, Foreign Direct Investment-The Indian Experience by BEP publishers in 2019, ‘Global Entrepreneurship and New Venture Creation in the Sharing Economy’ published by IGI Global and Managerial Economics by Cengage Publishing. Her research interest lies in the field of Development Economics, Foreign Direct Investment, Sharing economy and Macroeconomic issues and policies.
Notes
1. RTAs comprise both Free & Preferential trade agreements. RTA and TA are used interchangeably throughout the study. RTA may be multilateral (between three or more nations) or bilateral (between two nations).
References
- PHD Report. 2018. Trade & Investment Facilitation Services.PHD Chamber of Commerce & Industry. PHD Report, available at: http://www.phdcci.in/live_backup/image/data/Research%20Bureau-2014/TIFS-2018/TIFSJulyandAugust2018.pdf
- Ahmadzai, H. (2017). Crop diversification and technical efficiency in Afghanistan: Stochastic frontier analysis. The University of Nottingham, Centre for Research in Economic Development and International Trade (CREDIT), Nottingham, Paper No. 17/04.
- Aigner, D., Lovell, C. K., & Schmidt, P. (1977). Formulation and estimation of stochastic frontier production function models. Journal of Econometrics, 6(1), 21–17. https://doi.org/10.1016/0304-4076(77)90052-5
- Atif, R. M., Haiyun, L., & Mahmood, H. (2017). Pakistan’s agricultural exports, determinants and its potential: An application of stochastic frontier gravity model. The Journal of International Trade & Economic Development, 26(3), 257–276. https://doi.org/10.1080/09638199.2016.1243724
- Atif, R. M., Mahmood, H., Haiyun, L., & Mao, H. (2019). Determinants and efficiency of Pakistan’s chemical products’ exports: An application of stochastic frontier gravity mo del. PloS One, 14(5), e0217210. https://doi.org/10.1371/journal.pone.0217210
- Baldwin, R., & Taglioni, D. (2006). Gravity for dummies and dummies for gravity equations. NBER Working Paper No. 12516.
- Bartesaghi I. (2019). India’s relations with MERCOSUR-A weak trade relationship with great trade potential. Extraordinary and Plenipotentiary Diplomatist 7(9), available at: https://ucu.edu.uy/sites/default/files/facultad/fce/dnii/03_ignacio_bartesaghi.pdf
- Battese, G. E., & Coelli, T. J. (1995). A model for technical inefficiency effects in a stochastic frontier production function for panel data. Empirical Economics, 20(2), 325–332. https://doi.org/10.1007/BF01205442
- BCG Report. (2019).Going for gold by creating customers who create customers. https://media-publications.bcg.com/pdf/Going-for-Gold-By-creating-customers-who-create-customers.pdf
- Belotti, F., Daidone, S., Ilardi, G., & Atella, V. (2013). Stochastic frontier analysis using Stata. The Stata Journal, 13(4), 719–758. https://doi.org/10.1177/1536867X1301300404
- Bergstrand, J. H. (1985). The gravity equation in international trade: Some microeconomic foundations and empirical evidence. The review of economics and statistics ,671, 474–481.
- Binh, P. T. (2013). Unit root tests, cointegration, ECM, VECM, and causality models. Topics in Time Series Econometrics.
- Boffa, M., Jansen, M., & Solleder, O. (2019). Do We Need Deeper Trade Agreements for GVCs or Just a BIT? The World Economy, 42(6), 1713–1739. https://doi.org/10.1111/twec.12766
- Carrère, C., Mrázová, M., & Neary, J. P. (2020). Gravity without apology: The science of elasticities, distance and trade. The Economic Journal, 130(628), 880–910. https://doi.org/10.1093/ej/ueaa034
- Chakraborty, D., Chaisse, J., & Xu, Q. I. A. N. (2019). Is it finally time for India's free trade agreements? the ASEAN “Present” and the RCEP “Future”. Asian Journal of International Law, 9(2), 359–391.
- Chaney, T. (2018). The gravity equation in international trade: An explanation. Journal of Political Economy, 126(1), 150–177. https://doi.org/10.1086/694292
- Clarke, S., Akbari, M., & Far, S. M. (2017). Vietnam’s trade policy: A developing nation assessment. International Journal of Community Development and Management Studies, 1, 1. https://www.informingscience.org/Publications/3858?Source=%2FJournals%2FIJCDMS%2FArticles%3FVolume%3D0-0
- Das, J., Tanger, S. M., Kennedy, P. L., & Vlosky, R. P. (2018). Examining the Relationship between Regulatory Quality and Forest Product Exports to India: A Gravity Model Approach. Forest Products Journal, 68(2), 172–181. https://doi.org/10.13073/FPJ-D-17-00022
- Dell’Ariccia, G. (1999). Exchange rate fluctuations and trade flows: Evidence from the European Union. IMF Staff Papers, 46(3), 315–334. https://doi.org/10.2307/3867646
- Doan, T. N., & Xing, Y. (2018). Trade efficiency, free trade agreements and rules of origin. Journal of Asian Economics, 55, 33–41. https://doi.org/10.1016/j.asieco.2017.12.007
- Elliott, R. J., Horsewood, N. J., & Zhang, L. (2019). Importing exporters and exporting importers: A study of the decision of Chinese firms to engage in international trade. Review of International Economics, 27(1), 240–266. https://doi.org/10.1111/roie.12374
- Fiorini, M., & Hoekman, B. (2018). Trade agreements, regulatory institutions and services liberalization. Global Policy, 9(4), 441–450. https://doi.org/10.1111/1758-5899.12583
- Freckleton, M., & Whitely, P. (2020). Can trade agreements among small countries create trade? International Journal of Development Issues, 19(2), 205–216. https://doi.org/10.1108/IJDI-06-2019-0110
- Gharleghi, B., & Shafighi, N. (2020). Do regional trade agreements increase trade? Empirical evidence from the Asia–Pacific region. Economic Affairs, 40(3), 419–435. https://doi.org/10.1111/ecaf.12435
- Ghosh, S., Lien, D., & Yamarik, S. (2017). Does the Confucius institute network impact cultural distance? A panel data analysis of cross‐border flows in and out of China. Asian Economic Journal, 31(3), 299–323. https://doi.org/10.1111/asej.12125
- Ghoshal, I. (2015). Trade-growth relationship in India in the pre and post trade agreements regime. Procedia Economics and Finance, 30, 254–264. https://doi.org/10.1016/S2212-5671(15)01293-9
- Glaeser, E. L., & Kohlhase, J. E. (2004). Cities, regions and the decline of transport costs. Papers in Regional Science, 83, 197–228. Berlin, Heidelberg: Springer. https://doi.org/10.1007/s10110-003-0183-x
- Guloglu, B., & Bayar, G. (2016). Sectoral exports dynamics of Turkey: Evidence from panel data estimators. The Journal of International Trade & Economic Development, 25(7), 959–977. https://doi.org/10.1080/09638199.2016.1157886
- Hartmann, D., Bezerra, M., Lodolo, B., & Pinheiro, F. L. (2020). International trade, development traps, and the core-periphery structure of income inequality. EconomiA, 21(2), 255–278. https://doi.org/10.1016/j.econ.2019.09.001
- Hassan, M. S., Wajid, A., & Kalim, R. (2017). Factors affecting trade deficit in Pakistan, India and Bangladesh. Economia Politica, 34(2), 283–304. https://doi.org/10.1007/s40888-017-0053-7
- Jain, H. (2019). Implications of SAFTA for Indian Economy: Trade, Compatibility and Welfare Effects. Foreign Trade Review, 54(4), 355–374.
- Jan, W. U., & Shah, M. (2019). A gravity model approach towards Pakistan’s bilateral trade with SAARC countries. Comparative Economic Research. Central and Eastern Europe, 22(4), 23–38. https://doi.org/10.2478/cer-2019-0030
- Jiang, J., & Nguyen, T. (2021). Linear and generalized linear mixed models and their applications. Springer Nature.
- Kabir, M., Salim, R., & Al-Mawali, N. (2017). The gravity model and trade flows: Recent developments in econometric modeling and empirical evidence. Economic Analysis and Policy, 56, 60–71. https://doi.org/10.1016/j.eap.2017.08.005
- Kalirajan, K. (1999). Stochastic varying coefficients gravity model: An application in trade analysis. Journal of Applied Statistics, 26(2), 185–193. https://doi.org/10.1080/02664769922520
- Kalirajan, K. (2007). Regional cooperation and bilateral trade flows: An empirical measurement of resistance. The International Trade Journal, 21(2), 85–107. https://doi.org/10.1080/08853900701266555
- Khorana, S., & Martínez‐Zarzoso, I. (2020). Twenty‐First‐Century Trade Governance: Findings from the Commonwealth Countries. Contemporary Economic Policy, 38(2), 380–396. https://doi.org/10.1111/coep.12450
- Kumar, S., & Kumar, S. (2015). Does modernization improve performance: Evidence from Indian police. European Journal of Law and Economics, 39(1), 57–77. https://doi.org/10.1007/s10657-013-9392-1
- Kumar, S., & Prabhakar, P. (2017). India’s trade potential and free trade agreements: A stochastic frontier gravity approach. Global Economy Journal, 17(1), 1. https://doi.org/10.1515/gej-2016-0074
- Laget, E., Osnago, A., Rocha, N., & Ruta, M. (2020). Deep trade agreements and global value chains. Review of Industrial Organization, 57(2), 379–410. https://doi.org/10.1007/s11151-020-09780-0
- Lewis, L., & Monarch, R., (2016). Causes of the global trade slowdown. https://www.federalreserve.gov/econresdata/notes/ifdp-notes/2016/causes-of-the-global-trade-slowdown-20161110.html
- Liu, X. (2016). Trade agreements and economic growth. Southern Economic Journal, 82(4), 1374–1401. https://doi.org/10.1002/soej.12113
- Maciejewski, M., & Wach, K. (2019). What determines export structure in the EU countries? The use of gravity model in international trade based on the panel data for the years 1995-2015. Journal of International Studies, 12(1), 1. https://doi.org/10.14254/2071-8330.2019/12-1/10
- Mahmood, H., & Alkhateeb, T. T. Y. (2018). Asymmetrical effects of real exchange rate on the money demand in Saudi Arabia: A non-linear ARDL approach. PloS One, 13(11), e0207598. https://doi.org/10.1371/journal.pone.0207598
- Majeed, M. T., Yu, Z., Maqbool, A., Genie, M., Ullah, S., & Ahmad, W. (2021). The trade-off between economic growth and environmental quality: Does economic freedom asymmetric matter for Pakistan? In Environmental Science and Pollution Research (pp. 1–10). https://doi.org/10.1007/s11356-021-13709-9
- Malik, M. H., & Velan, N. (2020). An analysis of IT software and service exports from India. International Trade, Politics and Development.
- Meeusen, W., & van Den Broeck, J. (1977). Efficiency estimation from Cobb-Douglas production functions with composed error. International economic review, 18(2), 435–444. https://doi.org/10.2307/2525757
- Miao, M., Lang, Q., Borojo, D. G., Yushi, J., & Zhang, X. (2020). The impacts of Chinese FDI and China–Africa trade on economic growth of African countries: The role of institutional quality. Economies, 8(3), 53. https://doi.org/10.3390/economies8030053
- Mohanty, S., & Sethi, N. (2021). Does inward FDI lead to export performance in India? An empirical investigation. Global Business Review, 22(5), 1174–1189 .
- Morland, C., Schier, F., & Weimar, H. (2020). The structural gravity model and its implications on global forest product trade. Forests, 11(2), 178. https://doi.org/10.3390/f11020178
- Nasir, S., & Kalirajan, K. (2016). Information and communication technology-enabled modern services export performances of Asian economies. Asian Development Review, 33(1), 1–27. https://doi.org/10.1162/ADEV_a_00059
- Ngepah, N., & Udeagha, M. C. (2018). African regional trade agreements and intra-African trade. Journal of Economic Integration, 33(1), 1176–1199. https://doi.org/10.11130/jei.2018.33.1.1176
- Nguyen, T. T. V., & Trinh, T. T. D. (2019). The impact of exchange rate volatility on exports in Vietnam: A bounds testing approach. Journal of Risk and Financial Management, 12(6), 1–14. https://doi.org/10.3390/jrfm12010006
- Nguyen, V. (2020). Human capital, capital structure choice and firm profitability in developing countries: An empirical study in Vietnam. Accounting, 6(2), 127–136. https://doi.org/10.5267/j.ac.2019.11.003
- Nordås, H. K. (2018). What drives trade in services? Lessons from the Nordics. Applied Economics, 50(33), 3532–3545. https://doi.org/10.1080/00036846.2018.1430334
- Osabuohien, E. S., Efobi, U. R., Odebiyi, J. T., Fayomi, O. O., & Salami, A. O. (2019). Bilateral trade performance in West Africa: A gravity model estimation. African Development Review, 31(1), 1–14. https://doi.org/10.1111/1467-8268.12359
- Paudel, G. P., Devkota, M., Keil, A., & McDonald, A. J. (2020). Climate and landscape mediate patterns of low lentil productivity in Nepal. PloS One, 15(4), e0231377. https://doi.org/10.1371/journal.pone.0231377
- Paul, B. R. (2017). Handbook on Negotiating Sustainable Development Provisions In Preferential Trade Agreements. United Nations publication, available at: https://www.unescap.org/sites/default/files/Handbook%20SD-PTA_final.pdf
- Rodrik, D. (2018). What do trade agreements really do? Journal of Economic Perspectives, 32(2), 73–90. https://doi.org/10.1257/jep.32.2.73
- Saini, N., & Singhania, M. (2018). Determinants of FDI in developed and developing countries: A quantitative analysis using GMM. Journal of Economic Studies.
- Saraswat, V. K., Priya, P., & Ghosh, A. (2018). A note on free trade agreements and their costs. NITI Aayog, Government of India. https://niti.gov.in/writereaddata/files/document_publication/FTA-NITI-FINAL.pdf
- Sen, K. (2019). What explains the job creating potential of industrialization in the developing world? The Journal of Development Studies, 55(7), 1565–1583. https://doi.org/10.1080/00220388.2017.1404033
- Shepherd, B., Doytchinova, H. S., & Kravchenko, A. (2019). The gravity model of international trade: A user guide [R version]. United Nations ESCAP.
- Siddiqui H. (2021). India-Mercosur expansion talks back on track, available at: https://www.financialexpress.com/defence/india-mercosur-expansion-talks-back-on-track/2329465/
- Takele, T. B. (2019). The relevance of coordinated regional trade logistics for the implementation of regional free trade area of Africa. Journal of Transport and Supply Chain Management, 13(1), 1–11. https://doi.org/10.4102/jtscm.v13i0.417
- Tinbergen, J. (1962). Shaping the world economy; suggestions for an international economic policy. New York: Twentieth Century Fund.
- UNCTAD. 2015. Reforming International Investment Governance, available at: https://unctad.org/system/files/official-document/wir2015_en.pdf
- Venkatesh, M., & Grover, P. 2018. Behind Rupee meltdown: India’s exports disaster under Modi Govt, The Print,available at: https://theprint.in/economy/behind-rupee-meltdown-indias-exports-disaster-under-modi-govt/131660
- Venkatraja, B. (2018). Sensitivity of trade balance to exchange rate depreciation: Evidence from indo-US Bilateral trade. Asian Economic and Financial Review, 8(5), 691–703. https://doi.org/10.18488/journal.aefr.2018.85.691.703
- Verma, M. S., & Dhami, J. K. (2021). Trade Potential Of India With Mercosur Countries Using Revealed Comparative Index Method. Journal of Contemporary Issues in Business and Government 27(1).
- Wang, H. J., & Schmidt, P. (2002). One-step and two-step estimation of the effects of exogenous variables on technical efficiency levels. Journal of Productivity Analysis, 18(2), 129–144. https://doi.org/10.1023/A:1016565719882
- Zhu, S., & Fu, X. (2013). Drivers of export upgrading. World Development, 51, 221–233. https://doi.org/10.1016/j.worlddev.2013.05.017
- Žmuk, B., & Jošić, H. (2021). Investigating the impact of GDP and distance variables in the gravity model using sign and rank tests. Eastern Journal of European Studies, 12(1), 1. https://doi.org/10.47743/ejes-2021-0101
Appendix
Table A1. (i). India’s Regional Trade Agreements (Multilateral)
(ii) India’s Trade Agreements (Bilateral)
(iii) List of nations with no trade agreements considered in the study
