?Mathematical formulae have been encoded as MathML and are displayed in this HTML version using MathJax in order to improve their display. Uncheck the box to turn MathJax off. This feature requires Javascript. Click on a formula to zoom.
Abstract
This study examined the effects of research-based recommended cereal production practices on the technical efficiency of farm households based on household-level data generated from questionnaire surveys, focus group discussions, and key informant interviews. The technical efficiency scores were estimated using the stochastic meta-frontier approach because it allows addressing the expected differences in production technologies. Tobit regression framework was applied to identify factors related to farm inefficiency. Results showed mean technical efficiency of 58%, implying that the farm households can improve cereal output by about 36% with the current level of input mix and technologies. The t-test results revealed farm households who adopted high-yielding varieties with research-based recommended production practices were technically more efficient than their counterparts. Our econometric model results also indicated that the use of high-yielding varieties and research-based recommended seed rate affects the technical efficiency of farm households positively and significantly. In addition, we find gender, age, mobile telephone ownership, cooperative membership, access to input market, and crop damage as significant factors affecting the efficiency of farm households. Our findings highlight the importance of addressing technology adoption gaps and gender-based disparities, expanding access to information and modern inputs, strengthening social capital, and adopting climate change adaptation practices to improve the efficiency of farm households.
Public interest statement
Cereal crops are the core of Ethiopia’s agriculture and important sources of food supply and livelihood for the ever-growing population of the country. Despite its importance, cereal productivity in the country remains very low as compared to its potential yields. Many factors contribute to the low levels of cereal productivity in the country, of which limited access, utilization, and inefficiency in the use of production inputs are among the most limiting factors. To address the existing gap, the Ethiopian government has been implementing cereal crop development and intensification strategy to sustainably improve cereal productivity through increased availability of improved seed, chemical fertilizer, and better management practices. This study, therefore, contributes to the empirical literature and policy debate by examining the effects of the use of modern inputs and research recommended production practices on the technical efficiency of cereal-producing farm households in Ethiopia.
1. Introduction
Cereal crops are important sources of income for a majority of Ethiopia’s population. Mainly, the major cereals, such as teff, wheat, maize, barely and sorghum are the core of the country’s agriculture and food economy and dominate the Ethiopian smallholder agriculture (Chamberlin & Schmidt, Citation2012; Seyoum et al., Citation2011). Cereals contributed 87.97% of the grain production, from which maize, teff, wheat, and sorghum made up 30.08%, 17.12%, 15.33%, and 15.92% of the grain production, in the same order (CSA, Citation2019). On the side of consumption , it is estimated that an average person in Ethiopia consumes about 150 kilos of cereals per year, with slightly higher in rural areas (152 kg) as compared to urban ones (137 kg) (Minten et al., Citation2012).
Cereal crop development and intensification have been at the center of the Ethiopian agricultural development policies and investments over the past two decades. Cereal intensification with high priority was headed when Participatory Demonstration and Training Extension System (PADETES) was started in 1994/95 to pilot technological package-driven extension approach (Byerlee et al., Citation2007; Yu et al., Citation2011). The approach was implemented in moisture-reliant highland parts of the country by focusing on specific crops (“teff”, wheat, and maize) to scale up the approach and raise productivity in the country. Since then, new packages have been developed to support other crop and livestock enterprises (Spielman et al., Citation2012). The core aim of most of the interventions was to sustainably improve cereal productivity through increased availability of improved seed, chemical fertilizer and better management practices (MoFED, Citation2003; NPC, Citation2016).
In addition to this, the government has been pursuing holistic measures as part of the country’s intensification efforts aimed at addressing constraints and challenges related to the supply and use of agricultural inputs. As a result of which, the share of farm households using agricultural inputs in the sector has increased over the last decades. For example, the share of cereal producers using improved seed has increased from 10% in 2004/05 to 21% in 2013/14, while chemical fertilizer imports have increased by 124% and fertilizer use by smallholders increased by 144% between 2004/05 and 2013/14 (World Bank, Citation2016). However, during the GTP I period the performance of improved input supply sill falls short of the target set. The amount of fertilizer supplied in 2014/15 was a record 1.201 million quintals, but this was only 72.2% of the target set for the year. The supply of improved seeds was only 1.514 million quintals, which accounted for about 42% of the target set for 2014/15 (NPC, Citation2016). Moreover, since recently the Government has been promoting cluster-based crop production approaches as a way to encourage smallholder farmers to adopt new crop varieties along with its fully improved management practices. The approach has been increasingly practiced in major crop-growing areas of the country., It is a method by which farmers merge their small and fragmented plots of farms into a big mother farm to produce the same type of crop and variety.
Because of the efforts, cereal production has grown significantly in the country, rising from 61.5 million quintals in 1994/95 to 296.7 million quintals in 2019/20 with an average annual growth rate of 6.6% (CSA 1994/95–2019/20). Growth in cereal production increased more rapidly by 7.2% particularly since 2004/05 than the previous years with an average growth rate of 3.97%, while the cultivated area under cereal increased by only 2.5% at a declining rate. This is perhaps a reflection of heavy policy emphasis on cereals (Rashid, Citation2010). Despite the significant shift in the volume of crop production, cereal productivity remains very low relative to its potential yields. Many factors contribute to the low levels of productivity in the country, among others, limited access, utilization, and inefficiency in the use of production inputs (Urgessa, Citation2015; Yu et al., Citation2011) are the significant limiting factors to improve productivity.
Besides, the domestic price for cereals is also growing from time to time due to the rapid increase in domestic demand, rapid population growth, income, and urbanization. The projected population of Ethiopia in 2015 that was 90.0 is expected to be 171.8 million in 2050 (CSA, Citation2016; UN, Citation2015, Citation2019) with 2.6% of an annual growth rate. This shows that the population of the country is expected to increase by 81.8 million over 35 years. On the other hand, the country’s import of cereals (wheat, rice, and barley), edible oil and lint cotton continues to rise dramatically, now costing over a billion dollars every year (Diriba, Citation2020). The situation reminds raising the productivity and efficiency of smallholders is one of the essential aspects of agricultural policy interventions to address food supply gaps in the country.
Satisfying increased demand for food and agricultural products for developing countries like Ethiopia, requires technological packages, the more efficient use of production technologies, and a combination of both, among others (Dhungana et al., Citation2004; IFAD, Citation2013; World Bank, Citation2007). The adoption of technological packages ranges from improved high-value varieties, farming equipment, natural resource management practices, to conservation agriculture practices (Ogundari & Bolarinwa, Citation2018). Whereas, production efficiency is a way to ensure that products are produced in the best and most profitable manner (Mardani & Salarpour, Citation2015). It is also related to how well a firm allocates scarce resources to meet production goals (Mardani & Salarpour, Citation2015; Wu, Citation2008) and produces maximum feasible output at a minimum average cost (Coelli et al., Citation2005). Productivity gains through improved technology and efficiency are the main sources of growth in agriculture and the primary means to satisfy increased demand for food and agricultural products for developing countries like Ethiopia (World Bank, Citation2007). Empirical evidence also suggests that growth in agricultural productivity through intensification, adoption of improved technologies, and more efficient use of inputs have become successful in Asia (Pingali & Heisey, Citation1999). This shows that the adoption of technological packages and improving production efficiency are two key strategies followed to increase the production and productivity of smallholder farmers. Therefore, technology adoption and efficiency analysis are crucial to generate evidence that guides intensification strategy.
Several empirical studies assess the technical efficiency of smallholders in Ethiopia using different methodologies. For example, studies (Alemu et al., Citation2009; Nisrane et al., Citation2015; Tiruneh & Geta, Citation2016) estimated the production efficiency of smallholders and identified factors contributing to the inefficiency of crop production in a different part of Ethiopia. However, several of these studies addressed only socio-economic factors accounting for the inefficiency of smallholders. Other studies, such as Ahmed et al. (Citation2017); Geffersa et al. (Citation2019), among others, are good examples of studies that examined the effect of maize variety adoption on-farm production. The studies found that the use of improved maize varieties has a positive and significant effect on farm productivity. On top of high-yielding crop varieties, a range of location-specific research-based recommended improved practicesFootnote1 has been also promoted to improve farm households’ productivity in the country.
To this end, the literature stated that the adoption of modern inputs should be blended with better management practices to give rise to a higher level of returns (Diao & Pratt, Citation2007). The use of modern inputs together with its recommended rate provides an opportunity for increasing resource use efficiency, attaining sustainability, and increase in agricultural food production (Leeuw & Vaessen, Citation2009). Therefore, assessing the use of both high-yielding varieties along with their recommended practices and their effect on production efficiency is crucial for providing intuitive policy options on how to improve smallholder agriculture in the country. Besides, earlier efficiency studies assumed homogeneous production technology across locations while estimating the technical efficiency of farm households. However, overlooking differences among farm households in terms of geographical location, resources and knowledge may lead to predicting biased efficiency scores for the farm households (Chen et al., Citation2016; Orea & Kumbhakar, Citation2004). Hence, unlike the previous studies in Ethiopia, this study used a meta-frontier framework because production technologies are expected to differ by location. In consideration of the above mentioned research gaps, this study contributes to the empirical literature by analyzing the adoption of research-based recommended production practices and their effects on the level of farm households’ technical efficiency.
The rest of the article is organized into four sections. The second section presents review of related literature. The third section offers methodological frameworks and definitions of variables. Section four presents descriptive statistics and discussions on empirical results. Finally, the study’s main conclusions and policy implications are presented in the last section.
2. Literature review
2.1. Production efficiency: Concepts and measurements
The concept of production in economics is beyond an activity of making something material like the growing of wheat, maize, teff, or any other crops or livestock products by the farmers. It is the transformation of factors of production (land, capital, labor, and entrepreneurship) into products (also term as outputs) (Rasmussen, Citation2011) through the production process to satisfy human wants. In its wider concept, production involves the process of utilizing resources to satisfy human wants through the creation or addition of utility. Creating or adding utility to the resources in the production process follows the process of changing resources into form, time, place, service utility. Hence, the entire process of production is creating or adding form, place, time and/or personal utility.
In microeconomics theory, the concept of productivity and efficiency is seen from two different but related concepts. The productivity of a firm can be briefly defined as the ratio of output(s) to its input(s) (Coelli et al., Citation2005; Fried et al., Citation2008; Rasmussen, Citation2011). The productivity of a firm could be measured using partial productivity, such as yield per hectare, output per labor, or total factor productivity (TFP) (ratio of aggregate output to aggregate input). Efficiency can be briefly defined as “the achieved compared to what can be achieved” (Rasmussen, Citation2011, p. 61). More comprehensively, Fried et al. (Citation2008, p. 8) defined the efficiency as “observed output to maximum potential output obtainable from the input, or comparing observed input to minimum potential input needed to produce the output or some combination of the two.” The definition of efficiency forward by Fried and his colleagues implies two important concepts, the first efficiency is the relationship between the observed and the optimal value of its inputs and outputs; the second efficiency has both output (output-oriented efficiency) and input side (input-oriented efficiency) of the production process.
A firm’s productivity is greatly determined by the type and quality of inputs and how well these inputs are combined in the production process. The type and quality of inputs represent the production technology, while the way inputs are combined in the production process refers to the technical efficiency of the production process (FAO, Citation2017). A firm’s productivity can be, therefore, enhanced by either advancing the state of technology that can shift the production frontier upward or improving efficiency on the use of the existing frontier. Changes in the efficiency of a firm can be seen from the change of the firm’s position relative to the current technological frontier (Rasmussen, Citation2011), suggesting that it is important to address efficiency gaps in addition to production technology and environment in which the production occurs.
Using a simple definition, the production function is the functional relationship between inputs and output. However, the definition goes beyond the input and output relationship. According to Debertin (Citation1966, p. 14), “a production function describes the technical relationship that transforms inputs (resources) into outputs (commodities).” The theoretical definition of a production function as forwarded by Aigner et al. (Citation1977, p. 1) is “the maximum amount of output obtainable from given input bundles with fixed technology.” Similarly, Battese (Citation1992, p. 185) defined the production function in terms of “the maximum output that can be produced from a specified set of inputs, given the exiting technology available to the firm involved.” According to Todaro and Smith (Citation2010), “production function is defined as technological or engineering relationship between the quantity of a good produced and the quantity of input required to produce it.” Concerning this, the output takes the form of the volume of goods and services, whereas the inputs are different factors of production such as land, labor, capital and enterprise/organization.
In theoretical literature, Koopmans (Citation1951), Debreu (Citation1951), and Shephard (Citation1953) are regarded as pioneers in starting frontier efficiency measures on production efficiency in the early 1950s. The methodology behind the measurement of productivity and efficiency extended by the seminal work of Farrell (Citation1957) who was inspired by the work of Debreu (Citation1951) and Koopmans (Citation1951) to define a simple measure of firm efficiency that could account for multiple inputs. Econometricians have been estimating average/response production functions using traditional least-squares methods until the late 1960s (Aigner et al., Citation1977; Battese, Citation1992). However, Farrell (Citation1957) in his work presents the possibility of estimating the so-called frontier production functions. He proposed the notion of relative efficiency in which the efficiency of a particular production technology may be compared with another one within a given group. He identified the efficiency of a firm into three types of efficiency, such as technical efficiency, allocative efficiency (termed by Farrell as price efficiency), and economic efficiency (termed by Farrell as overall efficiency).
Technical efficiency (TE) as per Farrell’s (Citation1957) explanation reflects the ability of a firm to obtain maximal feasible output from a given set of inputs (output-oriented TE) or produce a given level of output using the minimum feasible amounts of inputs (input-oriented TE). Although both methods of measuring technical efficiency prevail in the efficiency literature, the output-oriented measure of technical efficiency is routinely used in the literature on the stochastic frontier approach (Kumbhakara & Tsionas, Citation2006). Allocative efficiency (AE) reflects the ability of a firm to use the inputs in optimal proportions (minimize production costs), given their respective prices and the production technology. Economic efficiency is also known as cost-efficiency obtained from the combination or the product of both TE and AE.
There are four most commonly used methods of measuring efficiency, including (1) Least-squares economistic production models, (2) Total factor productivity (TFP) indices, (3) Data envelopment analysis (DEA), and (4) Stochastic Frontiers Analysis (SFA). The first two methods of measuring efficiency are most often applied to aggregate time-series data and provide measures of technical change and/or TFP (Coelli et al., Citation2005). Whereas, DEA and SFA provide measures of relative efficiency among sample units’ data at one point in time (Coelli et al., Citation2005). DEA is a non-parametric approach proposed by Charnes et al. (Citation1978), and SFA is a parametric method developed by Aigner et al. (Citation1977) and Meeusen and van Den Broeck (Citation1977). DEA uses a linear programming technique to estimate technical efficiencies, whereas SFA uses an econometric method to estimate efficient frontiers with statistical noise in the data (Coelli et al., Citation2005; Mardani & Salarpour, Citation2015; Toma et al., Citation2015).
As discussed in Coelli (Citation1995), SFA imposes specific restriction assumptions on the functional form of the frontier and the distribution of stochastic error terms, which is considered as one of the weaknesses of SFA. In contrast, DEA uses linear programming methods to construct a piecewise frontier of the data, and hence, no assumption about the production function and the distribution of the error terms is required. However, the DEA does not take account of the sort of statistical errors, e.g., errors of measurement (Kalirajan & Shand, Citation1999), therefore less convenient for agricultural-related studies in developing countries (Coelli, Citation1995). In contrast, SAF can measure efficiency while simultaneously considering the presence of statistical noise by assuming a production function and specific distributions for the error term (Andor & Hesse, Citation2011).
The introduction of a stochastic meta-frontier approach in efficiency literature is also another methodological progress in the measurement of production efficiency. The traditional approach, which is dominantly applied to measure efficiency scores uses a single production function based on the assumption that the underlying technology is the same for all the sample observations, regardless of differences in operating circumstances and working environments (Alem et al., Citation2018). Differently, however, this approach provides methodological rigor in estimating technical inefficiencies by simultaneously accommodating the heterogeneity across different groups, such as farms, firms, regions, and countries in terms of production technologies used. Comparing the efficiency scores of different farms located in different geographical regions using a single estimate is likely to produce misleading results (Chen et al., Citation2016; Kumbhakar et al., Citation2015; Orea & Kumbhakar, Citation2004).
The approach was the extension of the meta-production function, which was first introduced by Hayami (Citation1969); Hayami and Ruttan (Citation1970), Hayami & Ruttan (Citation1971) as envelope of commonly conceived neoclassical production functions. Battese and Rao (Citation2002) proposed a stochastic meta-frontier function to operationalize the standard meta-production function approach and Battese et al. (Citation2004) further developed a modified model that encompasses the deterministic components of the stochastic frontier production functions for the firms that operate under the different technologies. The Battese, Rao, and O’Donnell model estimated the stochastic frontier analysis in two steps, where a stochastic frontier estimation for the homogeneous group frontier is estimated in the first step and the meta-frontier is estimated using linear programming in the second step.
After some years, O’Donnell et al. (Citation2008) provided a basic analytical framework necessary for the definition of a meta-frontier and how a meta-frontier can be estimated using non-parametric and parametric methods. Huang et al. (Citation2014) further improved the approach by proposing a new two-step stochastic frontier approach that estimates the group-specific frontier and the meta-frontiers, respectively. Different from Battese et al. (Citation2004) and O’Donnell et al. (Citation2008), the estimation strategy is based on a stochastic frontier framework rather than a mathematical programming technique, which allows separating the random shocks from the technology gaps.
2.2. Empirical findings on the determinants of technical efficiency
A large number of empirical studies have estimated the technical efficiency of major crops and identified factors influencing the technical efficiency of farm households in developing countries. For example, Alemu et al. (Citation2009) investigated efficiency variations across agro-ecological zones in Ethiopia and found a mean technical efficiency of 76% with a statistically significant difference among agro-ecological zones. The study also found that positive and significant elasticity for asset endowments including physical (land and draft power), financial (credit and market access), and human (labor and education). Studies by Nisrane et al. (Citation2015) also identified farm-specific attributes including education, crop area, crop damage, level of specialization, access to information and services as important factors affecting teff producers’ technical efficiency in Ethiopia. The study conducted by Oyetunde-Usman and Olagunju (Citation2019) showed a mean technical efficiency of 52% for farm households in Nigeria. Similarly, the efficiency analysis by Wongnaa and Awunyo-Vitor (Citation2018) revealed the mean technical efficiency of 58.1% for maize farmers in Ghana. This study also found that educational level, farming experience, extension contact, group membership, use of fertilizer, and improved seed enhance technical efficiency, whilst farm size and land fragmentation decrease technical efficiency among maize farmers.
Other empirical studies conducted in Ethiopia revealed the presence of technical inefficiency in crop production due to farm and household-specific determinant factors. For example, a study conducted by Bizuayehu (Citation2014) found that education of the household head, the use of soil and water conservation, livestock ownership and access to improved seed have statistically significant and positive associations with the technical efficiency of farm households. Similarly, Tenaye (Citation2020) found that age and education of the household head, farm size, cultivated land quality, access to extension service were positively associated with technical efficiency, while family size, land fragmentation, access to credit services, and off-farm income negatively affected the technical efficiency of farm households.
A study carried out by Geffersa et al. (Citation2019) showed that sex of the household head, family size, off-farm income, saving, farmer group participation have significant and positive association with technical efficiency, while the age of the household head was negatively related to technical efficiency. Few studies have been conducted on the impact of improved technologies on technical efficiency scores in developing countries. A study conducted by Ahmed et al. (Citation2017) is a good example to estimates the impact of improved maize variety on technical efficiency of farm households in East Hararghe Zone of Ethiopia using propensity score matching method. They found that farm households who adopt improved maize varieties have 4.42% of technical efficiency gain compared with their non-adopter counterparts.
3. Methodology
3.1. Study area
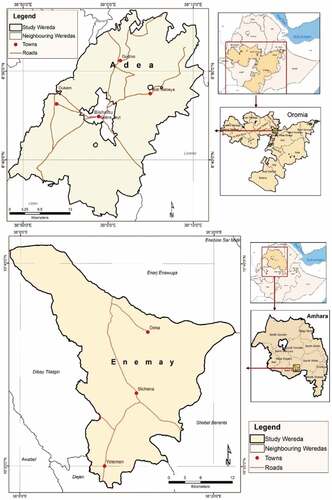
The study was conducted in the Amhara and Oromia regions, which are the major teff-producing mixed-farming areas of Ethiopia. The regions collectively accounted for 81% of cereal cultivated land and 82% of total cereal production and more specifically, 85% of teff cultivated land and 87% of the total teff production in the country (CSA, Citation2020). East Shewa in the Oromia region and East Gojjam in the Amhara region are particularly known as teff-based mixed farming areas in the country. East Shewa and East Gojjam zone are located at a distance of 100 km and 300 km from Addis Ababa, the capital of the country, to the southeast and northwest direction, respectively. East Shewa and East Gojjam zones receive an annual average rainfall ranging from 350 mm to 1150 mm, and 900 mm to 1800 mm with unimodal and bimodal rainfall patterns, in that order (Ferede et al., Citation2020; Senbeta et al., Citation2020). The mean annual minimum and maximum temperatures of the zones range from 12oC and 39 oC and 7.5oC and 27 oC, respectively. The altitude of East Shewa and East Gojjam zone ranges from 900 to 2300 and 800 to 4200 m above sea level (m.a.s.l.), respectively. A mixed farming system dominated by the extensive type of management system is a feature of East Shewa and East Gojjam zone, where crop and livestock production is the main source of livelihood for the household.
Adea WeredaFootnote2 is one of the 12 Weredas in the East Shewa Zone of Oromia Regional State. The Wereda administrative town is Bishoftu which is located 45 km away east of Addis Ababa. Whereas, Enemay Wereda is found in the East Gojjam Zone of the Amhara region at 265 km in the Northwest of Addis Ababa. Altitudes in Ada’a and Enemay Wereda range between 1500 to over 2000 meters and 1600 and 3200 m.a.s.l., respectively. The mean annual minimum and maximum temperature in Adea Wereda vary from 7.9oC to 28oC, respectively. Whilst the mean annual temperature of the Enemay Wereda is 21oC. The mean annual rainfall is recoded as 839 mm for Adea Wereda and 1150 mm for Enemay Wereda. Black clay soil, light sandy soil, stony soil, and a mixture of black and red light soil locally known as “Koticha”, ”Gombore”, “Abolse”, and “Cheri”, in that order, are the dominant type of soil of the Adea Wereda. Whereas black soil, red soil, and a mixture of black and red light soil predominantly characterized the soil type of Enemay Wereda. “Teff”, wheat, barley, maize, sorghum, and chickpea are the major crops grown in this Weredas. below shows the map of the study areas in Oromia and Amhara regions.
Figure 1. Map of the study areas.
3.2. Data sources and collection methods
For this study, both primary and secondary data were employed. The primary data were collected from sample farm households using a structured questionnaire administered by a cross-sectional survey in the year 2019/20. The study also used semi-structured checklists applied using key informant interviews and focus group discussions. The collection of the data offered substantial emphasis for the various aspects of cereal production, technology and institutional support services, improved seed multiplication and supply, biotic and abiotic stresses, climate change, and overall challenges of cereal production. Perceptions and reflections of farm households, development agents, agricultural experts, and researchers at different levels were taken into account for the study. Secondary data was also gathered from Zonal and Wereda level agricultural offices, CSA cereal production and productivity data, other policy documents, and specific studies carried out in Ethiopia to address the objectives of the study.
3.3. Sampling strategy
The study followed a multi-stage stratified sampling procedure to select the final sample of farm households for the study. First, major “teff” growing regions namely Oromia and Amhara regions were purposively selected given the growing importance of the crop worldwide. Second, one Wereda from each of the two regions namely Enemay Wereda from Amhara and Adea Wereda from Oromia were purposively selected given the high potential and typical enviroment for “teff” production in the country. Both Weredas are characterized by a mixed farming system where “teff”, wheat, barely, maize, sorghum, and pulses, in that order, are the primary crops and sources of livelihood for farm households who live in the study areas. Third, given available time, resources, the prevailing similar production system, a total of six Kebeles, three Kebeles per Wereda, were randomly selected from the total rural KebelesFootnote3 of the study Weredas, which is stratified based on their crop production potential as high potential and low potential. Hence, the study is considered four potential and two non-potential rural kebeles following probability proportion to size (PPS) sampling techniques. Finally, based on the formula developed by Kothari (Citation2004), the sample size of 392 farm households including 10% contingency was determined for the study. Out of 392, we excluded 14 observations due to missing information. Farm household is the unit of analysis and the cereal production process is the main focus area of this study.
3.4. Analytical approaches
3.4.1. Adoption of improved practices
The study considered packages of production technologies, such as the adoption of high-yielding cereal crop varieties, planting density, fertilizer rate, cluster farming and row planting. Farm Household decison on the aditon of this technologies, which can be denoted as , is depends on the difference between uility from adopting the technologies (
) and the utility from not adopting the technologies (
), hence, the adoption decision can be stated as
. Hence, the present study described and compare the adoption of the improved production techniques among smallholders using descriptive and inferential statistics.
3.4.2. Estimation of technical efficiency
In this study, the farm households’ efficiency score was estimated using a two-step estimation of stochastic meta-frontier framework following Huang et al. (Citation2014). Many studies (Alem et al., Citation2018; Ng’ombe, Citation2017) employed this approach to estimate, and compare the efficiency scores for smallholders. The approach is used to account for the prevailing differences between the sample study districts in terms of production technology, study-specific characteristics, and agro-ecologic conditions. Such method of addressing variation across study districts is supported by literature (Orea & Kumbhakar, Citation2004), because estimating the conventional stochastic frontier in the presence of unobserved heterogeneity in technologies leads to biased TE scores
Accordingly, three SFPs are estimated, two for Wereda level frontiers (Adea and Enemay Wereda) and one frontier based on the pooled sample following a two-step approach. In the first step, group-specific frontiers were estimated for Adea and Enemay Wereda and in the second step, a meta-frontier production function was estimated for pooled data. A stochastic group-specific production frontier is formulated as:
where, represents the value of total cereal crops (teff, wheat, barely, maize and sorghum) of the i-th sample farm household in the
Wereda,
is a kx1 vector of direct inputs of the i-th farm household, β
a vector of unknown parameters to be estimated.
denotes the random variation in output
) due to factors outside the control of the firm (measurement errors and other noises), and
is a non-negative technical inefficiency component of the error term that captures factors under the control of the farm.
is assumed to be independently and identically distributed as
and is independent of
. Whereas,
is assumed to follow truncated normal distribution at zero, i.i.d.
, where
denotes farm-specific or group-specific variables that may influence on-farm efficiency performance.
The estimation of the parameters in EquationEq. (1.1(1.1)
(1.1) ) and the farm household’s technical efficiency can be obtained using the maximum likelihood estimation method. The TE of the
farm household relative to the group
frontier can be computed as:
In EquationEq. (1.2(1.2)
(1.2) ) the inefficiency component
of the error term is the log difference between the maximum
and actual output
hence,
is the percentage by which actual output can be increased using the same inputs if the production is fully efficient (Kumbhakar & Wang, Citation2015). This implies that
gives the percentage of the output that is lost due to technical inefficiency. If the value of
close to zero, it shows full efficiency of the farm household.
Following Huang et al. (Citation2014), the stochastic meta-frontier that envelops all frontiers groups is defined as:
where, , which implies that
and the ratio of
group’s production frontier to the meta-frontier can be defined as the technology gap ratio (TGR) expressed as:
Technology gap ratio (TGR) of the farm household equal to one is interpreted as the farm household adopted the most advanced technology to produce cereal outputs. The technology gap component in EquationEq. (1.4
(1.4)
(1.4) ) is thus group, firm, and time-specific and depends on the accessibility and extent of adoption of the available meta-frontier production technology (Huang et al., Citation2014). As it is stated in Huang et al. (Citation2014), at a given input level
, the farm household’s observed output
of the
farm household relative to the meta-frontier consists of three components, that is:
where,
, the farm household’s technological gap ratio,
, is the farm household’s TE, and
, the random noise component.
The two-step approach to estimate the meta-frontier has two stochastic frontier production functions as defined below:
where, is the estimate of the group-specific frontier from EquationEq.(1.6
(1.6)
(1.6) ). Since the
are group-specific, the SFA is estimated two times, one for each Wereda. The output estimates from the two Weredas/groups are then pooled to estimate EquationEq. (1.7
(1.7)
(1.7) ). The meta-frontier should be larger than or equal to the group-specific frontier that is,
. The estimated TGR must always be less than or equal to unity:
where, =
are the estimated composite residual of EquationEq. (1.7
(1.7)
(1.7) ). The TE of the
farm household to the meta-frontier is equal to the product of the estimate of the TGR in EquationEq.(1.7
(1.7)
(1.7) ) and the individual farm household’s estimated TE in EquationEq.(1.2
(1.2)
(1.2) ), that is,
.
3.4.3. Empirical stochastic frontier model
The functional form of the Cobb-Douglas stochastic frontier model for the group-frontier with decomposed error terms at household level is specified as:
where, represents the natural logarithm of the aggregate value of cereals (teff, wheat, barley, maize and sorghum) expressed in Ethiopian Birr,
’s unknown parameters of conventional inputs to be estimated,
represents conventional inputs such as cereal cultivated land in ha, seed use in kg, fertilizer use in kg, labor in man days and draught power in ox-day, respectively.
is idiosyncratic error term distributed at i,i,d N(0,
and independent from
.
is a non-negative error component associated with technical inefficiency of smallholder households that follows truncated normal distribution at zero (
.
represents socio-economic, location and improved production techniques.
3.4.4. Effect of improved production techniques on technical efficiency
The effect of improved agricultural practices and farm-specific variables on the technical efficiency of households was assessed using the Tobit regression framework. Some authors support the use of the Tobit model in efficiency analysis as it can handle the characteristics of the distribution of efficiency measures and thus provide results that can guide policies to improve performance (Boubacar et al., Citation2016; Tipi et al., Citation2009).
Tobit model is first developed by Tobin (Citation1958) and widely applied to estimate consistent parameter estimates for censored and truncated data (Speelman et al., Citation2008). The standard Tobit model is specified as follows.
where, is the latent variable and
is an observed dependent variable,
are vectors of explanatory variables related to attributes of households or farms within the sample,
are unknown parameters, and is
an error term that is independently and normally distributed with mean zero and variance
(
and independent of
.
3.4.5. Empirical Tobit model
The empirical Tobit model adopted for this study is therefore held the following functional form:
Denoting as the observed dependent (censored) variable is represented as:
where, is the latent variable,
is observed dependent variable, in our case the efficiency scores for household
, and
are independent variables that consist of a range of variables (see Appendix A) that are hypothesized to affect the technical efficiency of the household.
are unknown parameters and
is the error term that is independently and normally distributed with mean zero and variance
(
and independent of
.
3.5. Explanation of variables used in the empirical models
The study employed conventional inputs and variables hypothesized to affect the level of technical efficiency. The variables are identified based on theoretical assumptions, empirical shreds of evidence, and the researcher’s knowledge of the farming system. The output variable is measured by the aggregated value of cereals produced by the farm households in Ethiopia Birr (ETB). Conventional inputs include cereal-cultivated land measured in hectares, the quantity of seed measured in kilograms, the quantity of fertilizer measured in kilograms, labor used in man-days, and draught power in oxen-day, respectively
The variables used in the inefficiency model were classified into three main groups, such as socio-economic, location-specific variables, and agricultural technologies (see Appendix A). We used these variables to estimate the first stage of group-specific frontiers. For the second stage of the meta-frontier, we employed variables that correspond to differences in terms of access to technology and other location-specific factors, between the study districts. These variables include access to high-yielding cereal crop varieties, land quality and stress incidences. Furthermore, we used five interventions related to agricultural technologies, such as high-yielding varieties, recommended seed and fertilizer rate, row planting, and participation in cluster farming. The technologies are selected because they have been receiving substantial emphasis to improve the production of smallholder farmers in rural Ethiopia. The study used recommended seed and fertilizer rates, which are standardized by the national research system on the basis of agro-ecologies. The rates for each cereal crop were decided using Crop Technology Packages and Crop Technology Guideline developed by the Ministry of Agriculture (MoA) and the Ethiopian Institute of Agricultural Research (EIAR) (see Appendix C). Moreover, we refined the recommended rates in consultation with agronomists and district agricultural experts to ensure the representativeness of the recommendations for the sample study districts. Soil types and planting methods were also taken into account.
4. Results and discussions
4.1. Descriptive statistics
From , about 95% of farm households were male-headed. Empirical studies (for example, Haileyesus & Mekuriaw, Citation2021; Zenga et al., Citation2018) reported comparable findings in Ethiopia. This may advance the adoption of improved technologies and thereby positively impact the technical efficiency in the study area. This is largely because male-headed households are believed to have improved access to agricultural technologies as compared to female headed households due to resource-related gender-based disparities. The age of farm households ranged from about 20–82 years with an average age of 45 years, which is comparable to the average age (46 years) reported by Kelemu (Citation2016). This means that the majority of the farm households in the study area were middle-aged farmers, implying farm productivity seems to reach optimum and start to diminish with age.
Table 1. Descriptive statistics
Land is a basic asset for smallholders in Ethiopia. On average, farm households in the study area cultivated 1.21 ha of land to produce different crops, which is greater than the average farm size (0.96 hectares) estimated by (Headey et al., Citation2014) for high-potential areas, and the national average farm size (0.9 hectares) of smallholders in Ethiopia (Rapsomanikis, Citation2015). Large landholding in the study area implies farm households appear to be surplus producers. Land quality index was used as an indicator for soil fertility, which takes soil fertility and plot slope into account. On average, farm households in the study area have 2.76, with a minimum of 1 and a maximum of 9. The average number of crops cultivated per farm household was found 3. To this end, literature underscores that growing a higher number of crops enables to improve soil fertility, reduce weeds, disease and pests, and hereby enhance farm efficiency (Ogundari, Citation2013). Livestock ownership is also another important wealth indicator in rural Ethiopia. The average number of livestock measured in terms of TLU was found to be 5.3, which is by far greater than the national average estimated around 3.7 TLU (Bachewe et al., Citation2008). Despite the good size of TLU, the farm households reported the number of livestock per household is decreasing from time to time due to expansion of cultivated land and limited availability of feed. Extension access is a key supply-side policy instrument to influence agricultural productivity in developing countries (Wossen et al., Citation2017). Concerning this, about 73% of the farm households had access to extension services during the cropping season. However, government sources showed that the number of full package beneficiaries is still very low (23%) due to mainly poor function of FTCsFootnote4 and low motivation of DAs, among others (MoA, Citation2017). This connotes that, despite a higher proportion of extension service users, the number of technology beneficiaries reported to be very low, which is mainly due to the limited access to alternative technologies. The farm households were located on average 2.08 km away from a nearby input market, which is the distance that the farm households should walk to access modern inputs. This distance was by far lower than the distance to the input market reported by Kelemu (Citation2016), 4.26 km. Among the sample farm households, 74% of them were members of the cooperative, whilst 81% used a mobile telephone.
provides the means and standard deviations of output and input variables. The majority of farm households were producers of “teff” (99%) followed by wheat (60%) and maize (19%). A higher size of the land was allocated for “teff” (1.08 ha) and wheat (0.5 ha), implying the crops are important sources of income and food security in the study area. The average yields of “teff”, wheat and maize were 1115 kg/ha, 1800 kg/ha, and 1349 kg/ha, respectively. The average yields in all of the cereal crops were found lower as compared to the national average reported in 2018/19 CSA reports, where the average productivity is 1700 kg/ha, 2700 kg/ha, and 3900 kg/ha, respectively (CSA, Citation2019). On average, farm households produce 49,535 ETB of cereal output, among which “teff” and wheat took the higher share, in ranking order.
Table 2. Mean values of the cereal output, input variables and stress incidence by crop type
On average, the farmers applied 35 kg/ha, 140 kg/ha, and 32 kg/ha of seed for “teff”, wheat, and maize, which is slightly higher than the recommended standard. Furthermore, farm households were used more quantities of chemical fertilizer in “teff” production as compared to the other crops. It appears to be due to teff and wheat has been produced for both food and cash in the study area. Nitrogen fertilizer was progressively used because of higher immediate returns perceived by the farm households. Overall, the farm household used 62 man-days and 15 oxen-days per hectare to produce cereal crops in the study area. On-farm stress incidence is measured by the proportion of the size of cereal cultivated land affected by biotic and abiotic stresses. Accordingly, about a higher proportion of the area of farmland is affected by stress incidences, where “teff”, maize, and wheat account for 53%, 38%, and 37%, in ranking order. The incidences of stress reported by this study are higher than the incidence estimated by Nisrane et al. (Citation2015) for “teff”, 11%. The surveyed farm households reported the incidence of stress is dynamic and unpredictable.
4.2. Adoption of improved inputs and production practices
presents the spread of the adoption of high-yielding varieties and production practices by crop type. It was computed in terms of the proportion of farm households adopting improved technologies. The data show that 35% of the surveyed farm households have adopted improved cereal crop varieties. Most of them used the improved varieties for “teff”, maize and wheat. From the total farm households who produced “teff”, maize, and wheat, only 30%, 28%, and 22% of them used high-yielding varieties, respectively. About 26% of the farm households reported they followed the recommended seed rate. Of the farm households who produced “teff”, close to 19% of them applied the recommended seed rate, while a relatively lower proportion of farm households (10%) who grew wheat used the recommended seed rate. The adoption studies in Ethiopia revealed mixed results. For example, a study by Gebru et al. (Citation2021) in semiarid northern Ethiopia showed that the adoption rate for improved teff and wheat estimated 16%, and 13.8%, respectively. The study further reported that, on average, about 3% and 5% of their farm area with improved ‘teff’ and wheat, in that order. Similar study in Ethiopian Arisi Zone revealed a 56% of the rate of adoption for wheat crop (Tesfaye, et al., Citation2016). The national level study by Shiferawa et al. (Citation2014) on improved wheat adoption showed that about 70% of households grew improved wheat varieties with, ao average, 83% of total wheat area. A study by Ahmed et al. (Citation2017) in East Hararghe Zone of Ethiopia found a 59.4% of rate of adoption for maize.
Table 3. Improved technologies adoption by crop type
Moreover, the result revealed that 37% and 55% of the farm households adopted the recommended rate of UREA and NPS, in that order. Crop-wise, a large proportion of farm households practiced the recommended rate of fertilizer for “teff” and wheat. The limited practice of row planting was also confirmed among the surveyed farm households. The results may suggest that still a large proportion of farm households have not used high-yielding varieties and most of them practice sub-optimal seed and fertilizer rates, which are lower and higher than the recommended standard. This is the reflection of many farmers in developing countries, and it is mainly due to limited access to modern inputs and relevant information (Amare et al., Citation2012; Stewart et al., Citation2015; Verkaart et al., Citation2017). Cluster farming is an intervention in which farmers consolidate their farmland to produce the same crops. Governments, NGOs, and private sectors promote cluster-based farming; however, only 25% of the farm households participated in cluster farming. A lower level of participation appears to be due to limiting factors related to institutional services, farmers’ organization, and individual and biophysical differences. The approach has been promoted without implementation guidelines, proper institutional structure, and trained staff on farmers’ organization.
The result of the intensity of adoption is summarized in below, which is measured by the proportion of the total area under improved technologies to the total area of cereal farms in the cropping year. The result shows that the overall intensity of adoption of high-yielding varieties for cereals was 23% with a statistically significant mean difference between the sampled study districts.Footnote5 About 24% (0.32 ha), 22% (0.15 ha), and 29.58% (0.07 ha) of the total area under “teff”, wheat and maize were covered by improved varieties, respectively. Whereas, about 24% (0.25 ha), and 36 % (0.17 ha) of the total area under “teff” and wheat were cropped with the recommended rate of UREA, in that order. With a slightly higher proportion of area, about 34% (0.35 ha) and 39% (0.17 ha) of area planted with “teff” and wheat were cropped with the required standard of NPS fertilizer rate. Except for maize, the farm households planted a significant proportion of their farmland with a broadcasting method of sawing and a small proportion of farm area covered with recommended seed rate. As per the qualitative responses, low level of adoption of improved technologies might be attributed to poor access to improved inputs, lack of awareness, higher price and low quality of improved seed, absence of alternative improved varieties that substitute old varieties, low level of participation in package training, a variation of extension service across areas.
Table 4. Intensity of adoption by crop type
4.3. Stochastic meta-frontier estimation
Before the estimation of the stochastic production frontier, we conducted various hypothesis tests. The first test is testing whether OLS residual has a left-skewed distribution or not. Accordingly, we found a negatively skewed value equals -0.530. The negative sign indicates that the distribution of the residuals is consistent with a production frontier specification (Kumbhakar & Wang, Citation2015). Skewness statistics are also found to be statistically significant at less than 1% significant level. We also assessed the negative-skewed distribution by examining the graph of OLS residuals. The graph confirms negative skewness and, hence, we have enough confidence to reject the null hypothesis of no negative Skewness in the data.
The second hypothesis test was choosing the proper stochastic production function specification form. The hypothesis tests were conducted based on the generalized log-likelihood ratio test (LR) () were
and
are the log-likelihood values under the null hypothesis
(Cobb Douglas function) and alternative hypothesis
(TL function), respectively, with a value of the degree of freedom computed based on the number of restrictions in the test. For that reason, as the calculated LR value is less than the critical value, we cannot reject the null hypothesis that the Cobb Douglas production functional form adequately represents the data. Moreover, the AIC value for the Cobb Douglas production function (301.31) is relatively lower than the AIC value of the Translog production function (304.46), implying CD is more appropriate in representing the data. Hence, for its consistent results, Cobb Douglas specification has been uniformly applied in all of the estimations. Various distributional assumptions on the error components are developed to estimate the parameters and inefficiency of the stochastic production function. Of these assumptions, the truncated normal distribution is assumed for the distribution of the inefficiency error term because it has the lowest Akaike Information Criterion (AIC)’s statistic as compared to the other distributional assumptions.Footnote6
The other most important hypothesis test was , which specifies no technical inefficiency in the sample. The value of likelihood ratio statistics, λ = 23.41, far exceeds the critical value of 8.273Footnote7 at 1% significant level. This value indicates that the null hypothesis of no technical inefficiency is rejected. This shows no full efficiency among the samples and technical inefficiency is one of the factors that affect the cereal outputs in the study area. On top of this, the rejection of the null hypothesis of no technical inefficiency confirmed the appropriateness of SPF over the OLS.
Once we rejected the null hypothesis of no technical inefficiency, we further investigated whether a unified conventional SPF could represent the overall data or a separate SPF should be used for the two sample study districts. This would help to meaningfully confirm the application of the stochastic meta-frontier approach. To determine this, we conducted an LR test, which is defined by , where,
,
, and
represents the log-likelihood values, which are obtained from the pooled data set of the overall stochastic frontiers and the sum of the values of the log-likelihood functions for the sample study frontiers, respectively. The degree of freedom was 22, calculated as the difference between the number of parameters estimated under pooled data and the parameters estimated in the respective study districts. Therefore, the result of the LR test [chi2 = 82.96 (p = .0000)] provides enough evidence to reject the null hypothesis of homogeneous production technology for the study. This implies that smallholder farmers in the sample study districts operate under different production technology and hence, SPF for the study districts should be separately estimated. The test result also profoundly confirmed the use of the stochastic meta-frontier approach to estimate the TE score among smallholder farmers in the respective study districts.
Following the test for homogeneous production technology, we carried out a hypothesis test to check whether or not the inefficiency effect model does not affect the technical inefficiency of smallholder farmers in the study area. Hence, the null hypothesis in all cases was rejected at a 1% significant level, representing the parameters of the inefficiency effect model are not simultaneously equal to zero. All of the hypothesis tests confirm the specification of stochastic production frontier is effective in estimating the efficiency scores.
The problem of heteroskedasticity that might exist inherently in the data was handled in the maximum likelihood estimator of the stochastic frontier model by using the observed information matrix (OIM) method during the estimation of the variance-covariance matrix (Abro et al., Citation2014). Multicollinearity problem was also checked and tested during variance inflation factor (VIF) and hence, we don’t find any multicollinearity problem during the estimation of process. Moreover, the Wald chi-square value [chi2 = 132.65 (p = .0000)] shows the model fits the data well, indicating the absence of wrong functional form specification.
4.4. Estimates of stochastic production frontiers
depicts the maximum likelihood estimate of the stochastic Cobb Douglas production function. The estimated value of gamma (γ) in all of the models was found greater than 0.80. This indicates that the inefficiency effects are likely to be highly significant in the analysis of the value of the farm households (Battese & Coelli, Citation1995). In this study, hence, more than 80% of the total variation in the output is primarily attributed to the existence of technical inefficiency. Except for the inputs, such as labor and oxen draught power, the estimated mean output elasticity of all inputs in the Meta-frontier were positive and significant at less than 1% level, indicating the inputs have a positive and significant effects on cereal output. This means that for example, keeping all other inputs constant, if the area of cereal farmland increased by 10%, cereal output will be increased by 4.2%. Similarly, if the use of seed and fertilizer increases by 10%, cereal output will be enhanced by 1.7% and 2.5%, respectively. Moreover, the sum of the parameters associated with all the inputs is less than one, implying a decreasing return to scale. Overall, the result of stochastic frontier estimation revealed that cereal output is more responsive to cultivated land than the use of fertilizer, seed, oxen draught power, and labor, in that order.
Table 5. Maximum likelihoods estimate of the parameters for SFPF model
4.5. Technical efficiency and technology gap ratio
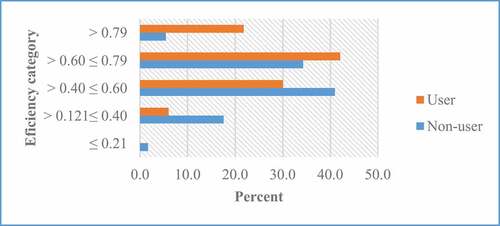
We computed the average value of TE and TGR of the meta-frontier of the pooled data, as reported in . Besides, the table presents the statistical t-test of mean TE difference between adopters of modern technologies and non-adopters. Overall the farm households have mean TE values of 58% that vary between 13% and 91%. The mean TE value shows that farm households produced 58% of the maximum production of the possible (frontier) output. The result further disclosed that if the farm households cultivated cereal at full efficiency level, they could increase their cereal output by 36%Footnote8 using the existing resources and production technologies. Moreover, the corresponding mean value of TGR denotes that, on average, farm households produce 90% of the potential output given the overall technology available in the study area. The difference in the mean TGR of the sampled study districts is statistically significant at 1%, which appears to be due to gaps in terms of access to improved technologies and information about high-yielding varieties (HYVs) and their associated better agronomic practices. The result also revealed that no farmers have a maximum value of TGR equal to unity (the stochastic frontier tangent to the meta-frontier), implying there are no farm households in the study area who adopt the most advanced cereal production technology. We also computed the variation of cereal output, which might be caused due to technical inefficiency. Accordingly, on average, the farm households lost 32,925 ETB per hectareFootnote9 due to technical inefficiency.
Table 6. Meta-level technical efficiency by technology adoption status of farm households
T-test results show that adopters of HYVs with the recommended practices have higher efficiency than non-adopters. The difference in mean TEs between adopters and non-adopters of HYVs and recommended seed rate is statistically significant at 1%. Moreover, the difference in mean TE values of adopters and non-adopters of HYVs with the recommended rate of seed , nitrogen fertilizer, and row planting is statistically significant at 1%. In the same way, on-farm demonstration experiments recommend farm households strictly follow the recommended seed rate. However, many farmers in developing countries prefer to use a higher seed rate than recommended, because they perceive it as a good strategy to control weeds and reduce the risk of crop production (Woldekiros, Citation2020). Similarly, farmers practiced the use of a high rate of nitrogen fertilizer in the study area expecting better yield gains. Interestingly, the study unfolds those farm households who applied nitrogen fertilizer over the recommended rate were found more efficient than others. F-test result also confirmed there exists a statistically significant difference in technical efficiency between farm households who used below (54%), as per (56%) and over the recommended rate (60%) of nitrogen fertilizer.
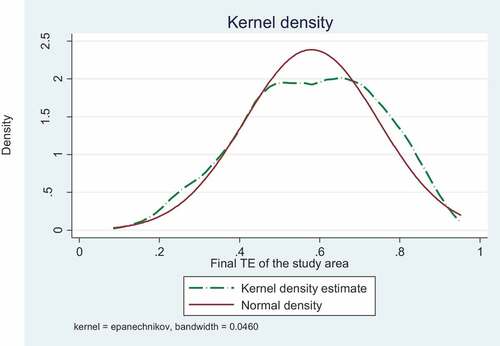
depicted the distribution of the efficiency scores of the farm households. The Kernel density distribution of the technical efficiency scores were also presented in Appendix D. About 51% of the farm households rest well above the mean value of technical efficiency score (59%). This means that given the current production technology, still there is substantial scope for improving the cereal output of farm households in the study area. The distribution further portrayed that the positive effect of the adoption of High Yielding Varieties (HYVs) on the efficiency of the farm households.
Figure 2. Efficiency distribution by adoption of HYVs.
4.6. Effects of improved technology on technical efficiency
presented the Tobit analysis of factors influencing the efficiency of farm households. The coefficients of the variables were estimated using Model-1 and Model-2. Model-1 is estimated based on technical efficiency score derived from independent stochastic frontiers of the sampled study districts, whereas the efficiency scores for Model-2 is taken from stochastic meta-frontier. The results of the Model 1 and Model-2 provide just about comparable results on the significant value of the coefficients. As can be seen from the estimation from Model-2, eight variables appear to have a statistically significant effect on technical efficiency.
Table 7. Factors explaining efficiency of smallholder farm households
Sex of the household head:The sex of the household head significantly affects technical efficiency in favor of male-headed households. The positive signs for the sex of household heads imply that male-headed households were more technically efficient than their female counterparts. This is might be because of the prevalent gender disparity in rural areas of Ethiopia in terms of access to productive resources and institutional supports. Female-headed households face gender-specific constraints, mainly the poor quality of farmland, limited access to institutional supports, and low level of assets and livestock ownership. Moreover, female-headed households have additional reproductive responsibility, which competes for women’s time and effort. These factors affect them to access improved technologies and improve their farming outputs. The result is consistent with the findings of Mango et al. (Citation2015); Gebrehiwot (Citation2017) that found a positive and significant effect on technical efficiency.
Age of the household head in years: The result shows that the age of the household head negatively and statistically affects the technical efficiency of farm households. The negative sign for the age of the household head indicates that the inefficiency increases with the age of the household head. Theoretically, farmers’ productivity generally increases and then decreases with age, meaning that younger and older farmers are lower than middle-age farmers (Tauer, Citation1995). This means that farm households in the middle-age may have the physical capability to acquire resources and information as compared to households in the younger and older age category. The result endorses the studies (Bizuayehu, Citation2014; Sekhon et al., Citation2010; Tiruneh & Geta, Citation2016) that found a negative effect of age on on-farm productivity.
Mobile telephone ownership: Mobile telephone ownership significantly determines the technical efficiency of smallholder farmers at less than 1% level. Smallholder households who have a mobile telephone were more efficient as compared to those who do not have one. The plausible explanation for the result is that mobile telephone ownership helps smallholder farmers to access information on the availability of conventional inputs and other improved agronomic techniques and thereby improve the level of technical efficiency. Similar results on the effect of a mobile telephone on smallholder household efficiency were also reported by Debebe et al. (Citation2015); Kelemu (Citation2016). For example, mobile telephone ownership increases the average technical efficiency of wheat-producing farmers in the range of 8–10% (Kelemu, Citation2016).
Cooperative membership: as hypothesized, membership in cooperatives positively and significantly affects the technical efficiency of farm households. The plausible explanation of the finding is related to membership in farmers groups enhancing household’s access to knowledge and information about improved technologies and better production practices thereby improving production efficiency. Development groups help their members to improve their production through farmers-to-farmers seed exchanges and peer group influence on best practices. The finding in this study also corresponds to other studies (Debebe et al., Citation2015). Wossen et al. (Citation2017) stated many paths through which cooperatives facilitate technology adoption and improve the welfare of farm households. Cooperative can relax the liquidity constraints, affect adoption by providing market information and better price, and pool different resources such as credit, information, and labor among members.
Distance to input center in km: The estimated coefficient related to the location of farm household regarding input centers, as expected, negatively and statistically significant. The hypothesis in this study is that farm households located near the input market tend to be more technically efficient than those located in remote areas. The probable reason might be the proximity to input centers increases farmers’ awareness of the availability and benefits of modern inputs. In addition to this, farm households located near input centers are encouraged to use recommended production practices and improve their efficiency. In line with the present study, studies (Kelemu, Citation2016; Lemessa et al., Citation2017) confirmed that proximity to the source of modern inputs is one of the determinants of crop output of farm households.
Stress incidence: Our analysis related to stress incidences or crop damage shows a negative and significant effect on the technical efficiency of farm households. This result is consistent with the findings of Nisrane et al. (Citation2015). From the total sample households, 63.73% of them reported the occurrence of different types of biotic and abiotic stresses that cause crop damage at different intensities. The thematic analysis of the qualitative data similarly confirmed the incidence of bad weather, unexpected rain, pests, diseases, flood, etc. increasingly and adversely affects cereal production in the study area. Experts and farmers consulted during the survey linked the disease and pest outbreaks with climate change. Most of the diseases significantly affect pulse crops and interrupt the crop rotation system, which is very important for soil fertility management. Mono-cropping of cereal crops on the other hand causes low crop yield and outbreaks of disease on cereal crops. The farm households reported the incidence of new crop diseases and pests mainly on “teff”, which are not formerly common in the area. The farm households also informed that changes in climate situation affect the crop variety choice given the rainfall distribution. Researchers and experts stated that crop pest and disease outbreaks, bad weathers, droughts, natural resource depletion, climate-change related risks, etc., growingly affect the performance of improved technologies. Similarly, the research and seed system has been constrained by a shortage of qualified staff, farmland, farm implements, laboratory chemicals, and other research infrastructures.
Use of HYVs and recommended seed rate: The use of improved cereal crop varieties and better management practices enhance the technical efficiency levels of farm households. The signs of the estimated coefficients for HYVs and seed rate are significant and positively affect the technical efficiency of farm households. The result on the adoption of HYVs is in line with the findings of (Bizuayehu, Citation2014). Honga et al. (Citation2019) also found that intercropping has a significant positive effect on technical efficiency. The study conducted by Chirwa, (Citation2007) showed that farm households using hybrid maize seed were more efficient that farm households using local seed. Despite the potential of modern technologies to improve farm efficiency, however, the performance of HYVs is affected by the type and quality of source seed and certified seeds. Poor performance of the seed system, the limited availability of high-quality improved seed, and the inefficiency of fertilizer use, the priority of the extension system to distribute inputs rather than provide technical advice, and the limited role of the private sector in the system were identified among the major challenges for farmers’ access to modern ecologies (Yu et al., Citation2011).
The thematic analysis of the qualitative findings revealed that seed multiplications on farms of smallholder farmers are one of the sources of poor seed quality for seeds of self-pollinated varieties. The public seed enterprises, which consists of Ethiopian Agricultural Business Corporation (ESE), Oromia Seed Enterprise (OSE), Amhara Seed Enterprise (ASE), and South Seed enterprise (SSE) have multiplied a considerable amount of seeds of self-pollinated varieties on fragmented farmers’ field on the basis of community-based informal seed multiplication scheme mainly due to shortage of farmland. ESE, OSE, and ASE have 5015 ha, 28,846 ha, and 1163 ha of own farms, respectively. From 60 to 70 thousand hectares of seed farm, which is expected to be inspected by seed regulatory authority across the country, 50% of the seed production is done on farmers’ fields (EIAR, Citation2020). On account of this, as documented by the Ethiopian Institute of Agricultural Research (EIAR, Citation2020), from the total seed farms of self-pollinated crops, the dominant proportion of the seed farms is either not inspected or not inspected at the recommended frequency. These findings explicitly highlight the substantial role of the supply of quality seed in addition to the efforts to improve farm households’ access to HYVs.
5. Conclusions and recommendations
The present study examined the effects of modern cereal crop varieties and recommended agronomic practices on the technical efficiency of farm households in cereal production. Our results have shown a low adoption rate of HYVs and improved agronomic practices. About 34% of farm households applied modern varieties and recommended rates of seed, fertilizer, and row planting at different scales of intensity. On average, about 19% of the total area under cereal crop were covered by modern varieties and recommended practices. The low level of adoption of HYVs and improved agronomic practices is mainly due to HYVs access constraints, poor quality of seed, and lack of awareness.
We have found a positive and significant coefficient for conventional inputs, such as land, seed, and fertilizer in cereal production, suggesting cereal output is more responsive to cultivated land, fertilizer, and seed, in that order than other inputs. The technical efficiency score was found 58%, suggesting the farm households can improve cereal productivity by about 36% through better use of available input resources and current technology. This result remarks that there is room to improve cereal productivity by improving the current technical efficiency of the farm households. Moreover, the results provide enough evidence that the technical efficiency of farm households is influenced by the adoption of HYVs and improved management practices. Hence, there is a great scope for improving the efficiency of farm households by promoting the adoption of modern technologies. Other sources of significant inefficiency factors include poor managerial abilities, mobile ownership, group membership and access to modern inputs.
Cereal crop production efficiency was also influenced by the level of stress incidence and its associated crop damage. The main factors for crop damage include floods, pests, diseases, climatic conditions, etc. The principal message emerging from these findings is that the need to improve the performance of public research and development systems to adequately support farm households to implement mitigation practices and use climate change responsive modern technologies. This could be achieved by improving the public sector efficiency and enhancing complementary investments in human capital, infrastructure, and research, and development (Dang & Pheng, Citation2015) as well as favorable price incentives to farm households to adopt new technologies (Timmer, Citation1988). Empirical evidence from the intensification of the green revolution also reinforces the argument. Much of the success of the green revolution was caused by the combination of high rates of investment in crop research, infrastructure, and market development, and appropriate policy support (Pingali, Citation2012), implying producers were able to harness the technologies and packages of inputs. Evidence in Asia suggests that the productivity growth in the post-green revolution period has been sustained through increased input use and more recently, through more efficient use of inputs (Pingali & Heisey, Citation1999). Hence, promoting the use of technological advances through public and private investment can be one of the policy instruments for the successful implementation of the cereal intensification strategy of the country.
The policy should strengthen the existing breeding, seed multiplication, and extension systems, so that, alternative HYVs with the required quality can be available to the farm households. Moreover, future interventions should aim at penetrating access of agricultural inputs to remote rural areas through revitalizing the role of cooperatives and local groups, hence, barriers in acquiring modern inputs and information regarding improved agronomic practices can be addressed. To this end, agricultural development efforts should emphasize mitigating the capacity gap of agricultural cooperatives in service provision through long- and short-term loan facilitation. Community-based seed production programs have been promoted to mitigate the gaps in the supply of improved seed by formal seed system. However, the institutional response requires a more integrated approach and strong linkage among key actors. The system should also be responsive to any risks caused by technology failures. Local seed producers and private seed companies should also be encouraged by improved access to financial services. In addition to this, the findings of the study stress the need to appropriate technology promotion strategies that should be responsive to the needs of different segments of the community. To address those human-related factors attributed to inefficiency, it is important to understand the origin of farm households’ managerial inabilities and how they can be improved. The agricultural information delivery system should also be strengthened through digital agriculture and the expansion of telecom services to remote rural areas. Moreover, future policies should focus on controlling and preventing those factors responsible for crop damages by relying on scientific advances in biotechnology in addition to conventional plant breeding and agronomic practices. Finally, virtual multi-stockholder information and knowledge platform under a long-term strategy of climate-smart agriculture may assist in addressing the adverse effects of climate change.
Acknowledgements
The authors of the study would like to extend an appreciation to farm households, development agents, subject matter specialists, researchers and data enumerators for their treasurable time during the interview process, the FGDs, and the KIIs. We also acknowledged Ministry of Agricultural (MoA), Zone and Wereda Level Agricultural Offices, Debre Zeit Agricultural Research Center (DZARC), and Debre Markos Agricultural Research Center (DMARC) for their unresearved support given during the collection of data for the study. Finally, we acknowledged the College of Development Studies, Addis Ababa University and Ethiopia Institute of Agricultural Research (EIAR) for their support.
Disclosure statement
No potential conflict of interest was reported by the author(s).
Data Availability Statement
The data used for the study are available from the corresponding author upon request.
Additional information
Funding
Notes on contributors
Fisseha Zegeye Birhanu
Fisseha Zegeye is currently a Ph.D. fellow in Addis Ababa University, College of Development Studies. He works for the Ethiopian Institute of Agricultural Research (EIAR). He has more than 13 years of research and teaching experience. His current research interests include development and innovation system, market and commercialization analysis, farming and livelihood system, food security and poverty, climate change, value chain, rural development, agriculture, technology, science, etc.
Abrham Seyoum (Ph.D.) is an Associate Professor at Center for Rural Development Studies, Addis Ababa University.
Dawit Alemu (Ph.D.) is a Senior Agricultural Economist and Director for BENEFIT Partnership Program.
Notes
1. Research based recommended practices are mainly planting density/seed rate, fertilizer rate, cluster farming and row planting
2. “Wereda” is an administration unit equivalent to district, whilst “Kebele” is the lowest administration region in Ethiopia.
3. Kebeles in the respective study weredas were stratified into high potential and low potential strata in consultation with experts assigned by wereda level agricultural offices.
4. FTCs are farmers’ training centers one of Ethiopia’s strategies to support smallholders in Ethiopia. They were established throughout the country to train the farmers on the use of technological packages. Development agents (Das) who are assigned at each FTC facilitate the farmers’ training centers.
5. A higher proportion of cereal farmland is covered by improved seed in Adea wereda than Enemay wereda with a statistically significant mean difference at less than 1 percent significant level.
6. Akaike’s Information Criterion (AIC) value for truncated-normal, half normal and exponential distribution is 254.7212, 264.8045 and 273.7771, respectively
7. The critical values for the analysis were obtained from of Kodde and Palm (Citation1986)
8. The optimum possible output level that farm households can producing using the existing resources and production technology can be computed as 1- (mean TE/Maximum TE) multiplied by 100.
9. The yield gap due to technical inefficiency variation is derived by first calculating the potential output from TE = Actual output/Potential output, and the Yield gap is computed by subtracting actual yield of farm households from the potential output.
10. The total value of cereal crop is computed based on the volume of output and the price of the crops. The price for the crops were obtained from 2018/19 price data collected by CSA from the study areas.
11. Man-day will be calculated based on regular and common working hours in the study areas, which is equivalent to 8 hours and converted into adult equivalent unit using appropriate conversion factors (See Appendix B) to account for age and gender differences across family members of the farm household.
12. Land quality index is constructed based on multiplying the plots slope and the fertility indicators of the plots, implying a low index value indicates better land quality, while high index value would indicate the lowest quality evaluated at household level (Nisrane et al., Citation2015).
References
- Abro, Z. A., Alemu, B. A., & Hanjra, M. A. (2014). Policies for agricultural productivity growth and poverty reductionin rural Ethiopia. World Development, 591, 461–33. http://dx.doi.org/10.1016/j.worlddev.2014.01.033
- Ahmed, M. H., Geleta, K. M., Tazeze, A., & Andualem, E. (2017). The Impact of improved maize varieties on farm productivity and wellbeing: Evidence from the East Hararghe Zone of Ethiopia. Development Studies Research, 4(1), 9–21. https://doi.org/10.1080/21665095.2017.1400393
- Aigner, D., Lovell, C., & Schmidt, P. (1977). Formulation and Estimation of Stochastic Frontier Production Function Models. Journal of Econometrics, 6(1), 21–37. https://doi.org/10.1016/0304-4076(77)90052-5
- Alem, H., Lien, G., Hardaker, J. B., & Guttormsen, A. (2018). Regional diferences in technical efficiency and technological gap of Norwegian dairy farms: A stochastic meta-frontier model. Applied Economics, 51(4) , 1–14. https://doi.org/10.1080/00036846.2018.1502867
- Alemu, B. A., Nuppenau, E.-A., & Boland, H. (2009). Technical efficiency across agro-ecological zones in Ethiopia: The impact of poverty and asset endowements. Agricultural Journal, 4(4), 202–207. https://medwelljournal.com/abstract/?doi=aj.2009.202.207
- Amare, M., Asfaw, S., & Shiferaw, B. (2012). Welfare impacts of maize–pigeonpea intensification in Tanzania. Agricultural Economics, 43(1) , 1–17. https://doi.org/10.1111/j.1574-0862.2011.00563.x
- Andor, M., & Hesse, F. 2011. A monte carlo simulation comparing DEA, SFA and twosimple approaches to combine efficiency estimates. CAWM Discussion Paper No. 51, University of M ̈unster.
- Bachewe, F., Minten, B., Tadesse, F., & Taffesse, A. S., 2008. The evolving livestock sector in Ethiopia. Growth by heads, not by productivity, Addis Ababa, Working Paper 122. International Food Policy Research Institute (IFPRI) and Ethiopian Development Research Institute (EDRI).
- Battese, G. E., Rao, D. S. P., & O’Donnell, C. J. (2004). A metafrontier production function for estimation of technical efficiencies and technology gaps for firms operating under different technologies. Journal of Productivity Analysis, 21(1), 91–103. https://doi.org/10.1023/B:PROD.0000012454.06094.29
- Battese, G. E., & Rao, D. S. P. (2002). Technology gap, efficiency, and a stochastic metafrontier function. International Journal of Business and Economics, 1(2), 87–93.
- Battese, G., & Coelli, T. (1995). A model for technical inefficiency effects in a stochastic frontier production function for panel data. Empirical Economics, 20(2), 325–332. https://doi.org/10.1007/BF01205442
- Battese, G. (1992). Frontier production functions and technical efficiency: A survey of empirical applications in agricultural economics. Agricultural Economics, 7(3–4), 185–208. https://doi.org/10.1016/0169-5150(92)90049-5
- Bizuayehu, S. (2014). Technical efficiency of major crops in Ethiopia: Stochastic frontier model. Academia Journal of Agricultural Research, 2(6), 147–153. https://doi.org/10.13140/RG.2.2.25688.34569
- Boubacar, O., Hui-qiu, Z., Rana, M. A., & Ghazanfar, S. (2016). Analysis on Technical Efficiency of Rice Farms and Its Influencing Factors in South-western of Niger. Journal of Northeast Agricultural University, 23(4), 67–77. 10.1016/s1006-8104(17)3000-0
- Byerlee, D., Spielman, D. J., Alemu, D., & Gautam, M., 2007. Policies to Promote Cereal Intensification in Ethiopia: A Review of Evidence and Experience, Discussion Paper 00707, Washington, DC: IFPRI.
- Chamberlin, J., & Schmidt, E. (2012). Ethiopian Agriculture: A Dynamic Geographic Perspective. In P. A. Dorosh & S. Rashid (Eds.), Food and Agriculture in Ethiopia: Progress and Policy Challenges (pp. 21–52). University of Pennsylvania Press.
- Charnes, A., Cooper, W., & Rhodes, E. (1978). Measuring the Efficiency of Decision Making units. European Journal of Operational Research, 2(6), 429–444. https://doi.org/10.1016/0377-2217(78)90138-8
- Chen, Z., Huffman, W., & Rozelle, S., 2016. Farm Technology and Technical Efficiency: Evidence from Four Regions in China, s.l.: Economics Working Papers (2002–2016), Iowa State University.
- Chirwa, E.W 2007 Sources of technical efficiency among smallholder maize farmersin southern Malawi. African Economic Research Consortium (AERC) Working Paper 172, Nairobi, Kenya
- Coelli, J., Rao, P., O’Donnell, C., & Battese, G. (2005). An introduction to efficiency and productivity analysis (Second ed.). Springer.
- Coelli, T. (1995). Recent Developments in Frontier Modeling and Efficiency Measurement. Australian Journal of Agricultural Economics, 39(3), 219–245. https://doi.org/10.1111/j.1467-8489.1995.tb00552.x
- CSA. (2016). Demographic and Health Survey.
- CSA, 2019. Agricultural Sample Survey 2018/19 (2011 E.C.). Volume I report On Area and Production Of Major Crops (Private Peasant Holdings, Meher Season)
- CSA, 2020. Agricultural Sample Survey 2019/2020 (2012 E.C.). Report on Crop and Livestock product utilization. Volume VI
- Dang, G., & Pheng, L. S. (2015). Theories of Economic Development. In Infrastructure Investments in Developing Economies, (pp. 11–26) ( XIV, ed.). Springer Science+Business Media. https://doi.org/10.1007/978-981-287-248-7_2:.
- Debebe, S., Haji, J., Goshu, D., & Edriss, A.-K. (2015). Technical, allocative, and economic efficiency among smallholder maize farmers in Southwestern Ethiopia: Parametric approach. Journal of Development and Agricultural Economics, 7(8), 283–292. https://doi.org/10.5897/JDAE2015.0652
- Debertin, D. (1966). Agricultural Production Economics (2 ed.). Rope: Macmillan Publishing.
- Debreu, G. (1951). he Coefficient of Resource Utilization. Econometrica, 19(3), 273–292. https://doi.org/10.2307/1906814
- Dhungana, B., Nuthall, P., & Nartea, G. (2004). Measuring the economic inefficiency of Nepalese rice farms using data envelopment analysis. The Australian Journal of Agricultural and Resource Economics, 48(2), 347–369. https://doi.org/10.1111/j.1467-8489.2004.00243.x
- Diao, X., & Pratt, A. N. (2007). Growth options and poverty reduction in Ethiopia - An economy-wide model analysis. Food Policy, 32(1), 205=228. https://doi.org/10.1016/j.foodpol.2006.05.005
- Diriba, G., 2020. Agricultural and Rural Transformation in Ethiopia. Obstacles, Triggers and Reform Considerations. Policy Working Paper 01/2020. Addis Ababa, Ethiopia.
- EIAR. (2007). Crop technology Utilization Manual. Addis Ababa, Ethiopia.
- EIAR. (2020). Status of Seed Quality Control and Assurance in Ethiopia. Required Measures for Improved Performance.
- FAO. (2017). Productivity and Efficiency Measurement in Agriculture: Literature Review and Gaps Analysis. In Publication prepared in the framework of the Global Strategy to improve Agricultural and Rural Statistics (pp. 1–77). Food and Agriculture of the United Nations.
- Farrell, M. (1957). The measurement of productive efficiency. Journal of the Royal Statistical Society, 120(3), 253–290. https://doi.org/10.2307/2343100
- Ferede, S., Getachew, A, Aemiro, K, Tesfahun , A. 2020. Farming Systems Characterization and Analysis in East Gojjam Zone: Implications for research and development (R&D) interventions, Research Report No. 127. Ethiopian Institute of Agricultural Research (EIAR).
- Fried, H., Lovell, C., & Schmidt, S. (2008). Efficiency and Productivity . In H. Fried, C. Lovell, and S. Schmidt (Eds.), The Measurement of Productive Efficiency and Productivity Growth (pp.1–107). Oxford University Press .
- Gebrehiwot, K. G. (2017). The impact of agricultural extension on farmers’ technical efficiencies in Ethiopia: A stochastic production frontier approach. South African Journal of Economic and Management Sciences, 20(1), 1–8. https://doi.org/10.4102/sajems.v20i1.1349
- Gebru, M., Holden, S. T., & Alfnes, F. (2021). Adoption analysis of agricultural technologies in the semiarid northern Ethiopia: A panel data analysis. Agricultural and Food Economics, 9(12), 1–16. https://doi.org/10.1186/s40100-021-00184-6
- Geffersa, A. G., Agbola, F. W., & Mahmood, A. (2019). Technology adoption and technical efficiency in maize production in rural Ethiopia. African Journal of Agricultural and Resource Economics, 14(3), 184–201. https://doi.org/10.22004/ag.econ.301041
- Haileyesus, D., & Mekuriaw, A. (2021). The adoption impact of wheat-chickpea double cropping on yield and farm income of smallholder farmers in Central Highlands of Ethiopia: The case of Becho district. Heliyon, 7(6), 1–10. https://doi.org/10.1016/j.heliyon.2021.e07203
- Hayami, Y., & Ruttan, V. W. (1970). Agricultural productivity differences among Countries. The American Economic Review, 60(5), 895–911.
- Hayami, Y., & Ruttan, V. (1971). Agricultural development: An international perspective. John Hopkins University Press.
- Hayami, Y. (1969). Sources of agricultural productivity gap among selected Countries. American Journal of Agricultural Economics, 51(3), 564–575. https://doi.org/10.2307/1237909
- Headey, D., Derejeb, M., & Taffesse, A. S. (2014). Land constraints and agricultural intensification in Ethiopia: Land constraints and agricultural intensification in Ethiopia. Food Policy, 47(1), 91–96. http://dx.doi.org/10.1016/j.foodpol.2014.01.008
- Honga, Y., Heerink, N., Zhao, M., & Werf, W. V. D. (2019). Intercropping contributes to a higher technical efficiency in smallholder farming: Evidence from a case study in Gaotai County, China. Agricultural Systems, 173(1), 317–324. https://doi.org/10.1016/j.agsy.2019.03.007
- Huang, C. J., Huang, T.-H., & Liu, N.-H. (2014). A new approach to estimating the metafrontier production function based on a stochastic frontier framework. J Prod Anal, 42(3), 241–254. https://doi.org/10.1007/s11123-014-0402-2
- IFAD. (2013). Smallholders, food security, and the environment.
- Kalirajan, K. P., & Shand, R. T. (1999). Frontier production functions and technical efficiency measures. Journal of Economic Surveys, 13(2), 149–172. https://doi.org/10.1111/1467-6419.00080
- Kelemu, K. (2016). Impact of mobile telephone on technical efficiency of wheat growing farmers in Ethiopia. International Journal of Research Studies in Agricultural Sciences (IJRSAS), 2(7), 1–9. https://doi.org/10.20431/2454-6224.0207001
- Kodde D A and Palm F C. (1986). Wald Criteria for Jointly Testing Equality and Inequality Restrictions. Econometrica, 54(5), 1243. https://doi.org/10.2307/1912331
- Koopmans, T. (1951). An analysis of production as an efficient combination of activities. In T. Koopmans (Ed.), Activity Analysis of Production and Allocation, Proceeding of a Conferenc (pp. 33–97). John Wiley and Sons Inc.
- Kothari, C. (2004). Research Methodology: Methods and techniques (2 ed.). New Age International.
- Kumbhakar, S. C., Wang, H.-J., & Horncastle, A. P. (2015). A Practitioner’s Guide to Stochastic Frontier Analysis Using Stata. Cambridge University Press.
- Kumbhakar, S., & Wang, H. (2015). A practitioner’s guide to stochastic frontier analysis using Stata. Cambridge University Press.
- Kumbhakara, S. C., & Tsionas, E. G. (2006). Estimation of stochastic frontier production functions with input-oriented technical efficiency. Journal of Econometrics, 133(1), 71–96. https://doi.org/10.1016/j.jeconom.2005.03.010
- Leeuw, F., & Vaessen, J. (2009). Impact Evaluations and Development. NONIE Guidance on Impact Evaluation. In . Washington DC.: World Bank 1–148 .
- Lemessa, S. D., Yismawu, M. A., Daksa, M. D., & Watabaji, M. D. (2017). Risk adjusted production efficiency of maize farmers in Ethiopia: Implication for improved maize varieties adoption. Turkish Journal of Agriculture - Food Science and Technology, 5(9), 1099–1107. https://doi.org/10.24925/turjaf.v5i9.1099-1107.1339
- Mango, N., Makate, C., Hanyani-Mlambo, B., Siziba, S., & Lundy, M. (2015). A stochastic frontier analysis of technical efficiency in smallholder maize production in Zimbabwe: Thepost-fast-track land reform outlook. Cogent Economics & Finance, 3(1), 1–14. https://doi.org/10.1080/23322039.2015.1117189
- Mardani, M., & Salarpour, M. (2015). Measuring technical efficiency of potato production. INFORMATION PROCESSING IN AGRICULTURE 2, 2(1), 6–14. https://doi.org/10.1016/j.inpa.2015.01.002
- Meeusen, W., & van Den Broeck, J. (1977). Efficiency estimation from cobb-douglas production functions with composed error. International Economic Review, 18(2), 435–444. https://doi.org/10.2307/2525757
- Minten, B., Stifel, D., & Tamru, S., 2012. Structural Transformation in Ethiopia: Evidence from Cereal Markets, Addis Ababa, Ethiopia: Ethiopia Strategy Support Program II Working Paper 39. International Food Policy Research Institute (IFPRI).
- MoA, 2010 Crop Production Package. Addis Ababa, Ethiopia
- MoA. (2017). Agricultural Extesnion Strategy of Ethiopia.
- MoFED. (2003) . Rural development policy and strategies. Addis Ababa, Ministry of Finance and Economic Development (MoFED). FDRE.
- Ng’ombe, J. N. (2017). Technical efficiency of smallholder maize production in Zambia: A stochastic meta-frontier approach. Agrekon, 56(4), 347–365. https://doi.org/10.1080/03031853.2017.1409127
- Nisrane, F., Koru, B., & Seyoum, A., 2015. Productivity and efficiency of smallholder teff farmers in Ethiopia, Addis Ababa, Ethiopia: Working Paper 79. Ethiopian Strategy Support Program (ESSP), EDRI, and IFPRI.
- NPC. (2016). Growth and Transformation Plan II (GTP II) (2015/16-2019/20), Volume I: Main Text.
- O’Donnell, C. J., Rao, D. S. P., & Battese, G. E. (2008). Metafrontier frameworks for the study of firm-level efficiencies and technology ratios. Empirical Economics, 34(2), 231–255. https://doi.org/10.1007/s00181-007-0119-4
- Ogundari, K., & Bolarinwa, O. D., 2018. Agricultural Innovations,Production, and Household Welfare in Africa. Working Paper Series No 294, Abidjan, Côte d’Ivoire: African Development Bank Group .
- Ogundari, K. (2013). Crop diversification and technical efficiency in food crop production A study of peasant farmers in Nigeria. International Journal of Social Economics, 40(3), 276–288. https://doi.org/10.1108/03068291311291536
- Orea, L., & Kumbhakar, S. C. (2004). Efficiency measurement using a latent class stochastic frontier model. Empirical Economics, 29(1), 169–183. https://doi.org/10.1007/s00181-003-0184-2
- Oyetunde-Usman, Z., & Olagunju, K. O. (2019). Determinants of food security and technical efficiency among agricultural households in Nigeria. Economies, 7(103), 1–13. https://doi.org/10.3390/economies7040103
- Pingali, P. L. (2012). Green Revolution: Impacts, limits, and the path ahead. Green Revolution: Impacts, Limits, anBill & Melinda Gates Foundation, Agricultural Development, Seattle, 109 (31), 12302–12308. WA 98102,https://doi.org/10.1073/pnas.0912953109
- Pingali, P., & Heisey, P., 1999. Cereal crop productivity in developing Countries, CIMMYT Economics Paper 99–3. Mexico D.F: CIMMYT:
- Rapsomanikis, G. 2015. The economic lives of smallholder farmers. An analysis based on household data from nine counrties. Rome, Italy: Food and Agriculture Organization of the United Nations.
- Rashid, S., 2010. Staple Food Prices in Ethiopia. Prepared for the COMESA policy seminar on “Variation in staple food prices: Causes, consequence, and policy options”, 25-26 January 2010 under the African Agricultural Marketing Project (AAMP) Maputo, Mozambique: COMESA.
- Rasmussen, S. (2011). Production Economics: The Basic Theory of Production Optimisation (1 ed.). Springer-Verlag .
- Sekhon, M., Mahal, A. K., Kaur, M., & Sidhu, M. (2010). Technical efficiency in crop production: A region-wise analysis. Agricultural Economics Research Review, 23(2), 367–374. http://dx.doi.org/10.22004/ag.econ.97017
- Senbeta, A. N., Daselegn, S. G., Ahmed, Y. E., & Bukul, B. B. (2020). Crop production system and their constraints in East Shewa Zone, Oromia National Regional State, Ethiopia. International Journal of Energy and Environmental Science, 5(2), 30–39. https://doi.org/10.11648/j.ijees.20200502.11
- Seyoum, A., Dorosh, P., & Asrat, S., 2011. Crop Production in Ethiopia: Regional Patterns and Trends. ESSP II Working Paper No. 0016. Addis Ababa, Ethiopia: Ethiopia Strategy Support Program II (ESSP II), International Food Policy Research Institute (IFPRI).
- Shephard, W. (1953). Cost and production functions. Princeton University Press.
- Shiferawa, B., Kassieb, M., Jaletac, M., & Yirgad, C. (2014). Adoption of improved wheat varieties and impacts on household food security in Ethiopia. Food Policy, 44(C), 272–284. http://dx.doi.org/10.1016/j.foodpol.2013.09.012
- Speelman, S., D’Haese, M., Buysse, J., & D’Haese, L. (2008). A measure for the efficiency of water use and its determinants, a case study of. Agricultural Systems, 98(1), 31–39. https://doi.org/10.1016/j.agsy.2008.03.006
- Spielman, D. J., Mekonnen, D. K., & Alemu, D. (2012). Seed, Fertilizer, and Agricultural Extension in Ethiopia. In P. A. Dorosh & S. Rashid (Eds.), Food and Agriculture in Ethiopia: Progress and Policy Challenges (pp. 84–122). University of Pennsylvania Press.
- Stewart, R., Langer, L., Da Silva, N. R., Muchiri, E., Zaranyika, H., Erasmus, Y., Randall, N., Rafferty, S., Korth, M., Madinga, N., & Wet, T. (2015). The effects of training, innovation and new technology on African smallholder farmers’ economic outcomes and food security: A systematic review. Campbell Systematic Reviews, 11(1), 1–224. s.l. https://doi.org/10.4073/csr.2015.16
- Storck, H., Emana, B., Adnew, B., Borowicciki, A., & Shimelis , W. (1991). Farming system and resouce economics in the tropics. In Farming system and farm management practices of smallholders in the Hararghe. Vol. II. Wissenschaftsverlag Vauk Kiel, Germany, Highland.
- Tauer, L. (1995). Age and farmer productivity. Review of Agricultural Economics, 17(1), 63–69. https://doi.org/10.2307/1349655
- Tenaye, A. (2020). Technical efficiecy of smallholder agriculture in developing Countries: The case of Ethiopia. Economies, 8(34), 1–27. https://doi.org/10.3390/economies8020034
- Tesfaye, S, Bedada, B, & Mesay, Y. (2016). Impact of improved wheat technology adoption on productivity and income in Ethiopia. African Crop Science Journal, 24(1), 125–135. http://dx.doi.org/10.4314/acsj.v24i1.145
- Timmer, C. P. (1988). The Agricultural Transformation. In H. Srinivasan, &T. Chenery (Eds.), Handbook of development economics, 1, (pp. 275–231). Elsevier Science Publishers B.V.
- Tipi, T., Yildiz, N., Nargeleçekenler, M., & Çetin, B. (2009). Measuring the technical efficiency and determinants of efficiency of rice (Oryza sativa) farms in Marmara region, Turkey. New Zealand Journal of Crop and Horticultural Science, 37(2), 121–129. https://doi.org/10.1080/01140670909510257
- Tiruneh, W. G., & Geta, E. (2016). Technical efficiency of smallholder wheat farmers: The case of Welmera district, Central Oromia, Ethiopia. Journal of Development and Agricultural Economics, 8(2), 39–51. https://doi.org/10.5897/JDAE2015.0660
- Tobin, J. (1958). Estimation of Relationships for limited dependent Variables. Econometrica, 41(1), 24–36. https://doi.org/10.2307/1907382
- Todaro, M., & Smith, S. (2010). Economic Development (11 ed.). Pearson Education, Inc.
- Toma, E., Dobre, C., Dona, I., & Cofas, E. (2015). DEA applicability in assessment of agriculture efficiency on areas. Agriculture and Agricultural Science Procedia, 6(1), 704–711. https://doi.org/10.1016/j.aaspro.2015.08.127
- UN, 2015. Department of economic and social affairs, population division, world population prospects: The 2015 revision, key findings. Working Paper No. ESA/P/WP.241,
- UN, 2019. World Population Prospects 2019: Highlights (ST/ESA/SER.A/423).: United Nations.
- Urgessa, T. (2015). The determinants of agricultural productivity and rural household income in Ethiopia. Ethiopian Journal of Economics, 24 (2), 66–91. Vol. XXIV No 2
- Verkaart, S., Munyua, B. G., Mausch, K., & Michler, J. D. (2017). Welfare impacts of improved chickpea adoption: A pathway for rural development in Ethiopia? Food Policy, 66(1), 50–61. https://doi.org/10.1016/j.foodpol.2016.11.007
- Woldekiros, B. (2020). Effects of row spacing and seed rate on yield and yield components of bread wheat (Triticum Aestivum L.) in Mid Altitude of Sankura District, South Ethiopia. International Journal of Research in Agriculture and Forestry, 7(1), 10–13.
- Wongnaa, C. A., & Awunyo-Vitor, D. (2018). Achieving sustainable development goals on no poverty and zero hunger: Does technical efficiency of ghana’s maize farmers matter? Agriculture and Food Security, 7(71), 1–13. https://doi.org/10.1186/s40066-018-0223-z
- World Bank, 2007. Agriculture for Development: World Development Report 2008
- World Bank. (2016). Ethiopia’s Great Run: The Growth Acceleration and How to Pace It.
- Wossen, T., Abdoulaye, T., Alene, A., Haile, M. G., Feleke, S., Olanrewaju, A., & Manyong, V. (2017). Impacts of extension access and cooperative membership on technology adoption and household welfare. Journal of Rural Studies, 54(1), 223–233. https://doi.org/10.1016/j.jrurstud.2017.06.022
- Wu, Y. (2008). Productivity, Efficiency and Economic Growth in China (2 ed.). Palgrave MaCmillan.
- Yu, B., Nin-Pratt, A., Funes, J., & Gemessa, S. A., 2011. Cereal Production and Technology Adoption in Ethiopia. Discussion Paper 01131, Development Strategy and Governance Division, IFPRI.
- Zenga, D., Alwang, J., Norton, G., Jaleta, M., Shiferaw, B., & Yirga, C. (2018). Land ownership and technology adoption revisited: Improved maize varieties in Ethiopia. Land Use Policy, 72(1), 270–279. https://doi.org/10.1016/j.landusepol.2017.12.047
Appendix A:
Definition of variables and the hypothesized effects of improved practices on technical efficiency
Appendix B:
Conversion factor for man-equivalent
Appendix C:
Recommended seed and fertilizer rate by crop type
Appendix D:
Kernel density distribution of technical efficiency
Figure D1. Kernel density distribution of technical efficiency.