
 ?Mathematical formulae have been encoded as MathML and are displayed in this HTML version using MathJax in order to improve their display. Uncheck the box to turn MathJax off. This feature requires Javascript. Click on a formula to zoom.
Abstract
The study examines the vital connection between stock returns and oil price changes for oil exporting/importing countries separately. We present evidence employing granger causality, impulse response and error variance decomposition based on panel vector autoregression. The results of panel granger causality suggested that after oil price crash owing to covid-19 pandemic, the interdependence between oil and stock price changes increased. Similar results were revealed by impulse response graphs and forecast error variance decomposition. Specifically, in the period marked by the rapid outbreak of the covid-19 pandemic, causality from oil to stocks increased. Although we found that both oil exporting and oil importing countries were affected in a similar way, oil price changes had a larger impact on oil exporting countries. The findings of the present study have implications for investors and fund managers. By incorporating crude oil price in the prediction models, the accuracy of stock returns forecast can be improved.
PUBLIC INTEREST STATEMENT
Oil is a major input for various industries and therefore oil prices influence almost all the sectors of the economy. Since stock markets reflect economic health, oil–stock relations are of importance for all–from general investors to policymakers. In this study, we provide evidence about oil–stock relations for oil-importing and oil-exporting countries before and after the announcement of Covid-19 as pandemic. The study finds that after WHO declared Covid-19 a pandemic, the oil–stock relations changed. In the post-declaration period, the interdependence between oil price changes and stock returns increased. It implies that after covid-19 became pandemic, changes in stock prices became more sensitive to oil price changes and vice versa. In addition, post-pandemic announcement the impacts of shocks in oil/stock prices have larger impacts on one another and such impacts persist for a greater number of days. This suggests that stock price forecasts can be improved by considering the likely changes in oil prices.
1. Introduction
The COVID-19 pandemic has created mayhem all across the globe and it has directly or indirectly affected almost every single entity living on this planet (Pattnaik et al., Citation2020). The first COVID-19 case was detected in China in November, 2019, it has spread across the 200 countries of the world (Hassan et al., Citation2020). Primarily a health emergency and declared as the “pandemic’ by the World Health Organization (WHO), the COVID-19 crisis has done extensive destruction to the economies around the globe and has disrupted almost every section of the society including economic sector (Rabbani et al., Citation2020a). The pandemic has brought the economic downturn at the unprecedented speed and scale (Sachs et al., Citation2020). The economic cost brought in the pandemic is difficult to calculate and it is almost incalculable (Rabbani et al., Citation2021a). The world economy shrank by 4.3% in 2020 which can only be matched with the great depression and two world wars (Salisu et al., Citation2020). The damage done by the pandemic is beyond any number as it is expected to leave a long-lasting impact on the psychology of the investors and entrepreneurs (Hassan et al., Citation2021). It is likely to worsen the global economic situation due to the growing uncertainty and anxiety among the masses as it is expected that the road to recovery will be long and far (Lipshitz & Walter, Citation2020). It is evident from the above discussion that the impacts of COVID-19 on stock market, crude oil and foreign exchange prices are not an exception (Salisu et al., Citation2020). Between February and March 2020, during the peak time of COVID-19 when the virus was spreading rapidly and economic activities were at halt due to the lockdown imposed by the governments to stop the spread of the virus, the stock market and oil prices took a hit and shrank by a significant margin (Aydın & Ari, Citation2020). The stock market in the United States went down by 32% and the United Kingdom by 27.9% and Italy’s by 29.3% (Dharani et al., Citation2022; Salisu et al., Citation2020). The pandemic has created a panic among the investors leading to the oil price crash and volatility in the financial markets (Albulescu, Citation2020). The market reactions were negatives during the early days of COVID cases (Naeem et al., Citation2022). During the first 50 to 50 days of the detection of first confirmed cases, there was more panic and uncertainty and markets showed negative reactions in respective countries (Ashraf, Citation2020). The market reaction to the pandemic in terms of zero interest and various stimulus packages by the governments created more panic and worries in the worldwide financial world. Still there is no economy which can be termed as the ideal in response to the COVID-19 pandemic (M. R. Rabbani et al., Citation2021c; Rabbani et al., Citation2020b, Citation2021b). The recovery still looks far reaching and it will take a herculean task to get back to the normal situation as the damage is huge and it is expected to leave a long-lasting impact on the social, mental, physical and financial well-being of the individuals and organizations (Karim et al., Citation2021, Citation2021; Pankaje et al., Citation2022; Rabbani et al., Citation2022; Sitara et al., Citation2021b).
The efficiency of foreign exchange market has declined during the peak COVID-19 period. Barring Swiss Franc and Canadian dollars, all other currencies were very volatile when COVID cases were increasing between March and April 2020 (Aslam et al., Citation2020). The intensity of interdependency between the oil price, changes in exchange rate and stock returns vary over the period and it is strictly dependent on the market factors (Yang et al., Citation2017).
The debate on causal relationship between the oil price movements and stock returns precedes the emergence of COVID-19 (Antonakakis et al., Citation2017; Bouri, Citation2015; Maghyereh & Awartani, Citation2016; Salisu et al., Citation2020; Wang et al., Citation2013). It has been more than a year since the first COVID-19 case was reported in Wuhan Province of China (Khan et al., Citation2021). It was initially anticipated that the adverse movement of oil prices, foreign exchange and stock indices will produce only short term economic impact (Czeczeli et al., Citation2020; Zimon et al., Citation2020). But, it is now realized that the COVID-19 is far from over and it produce the results which will be far reaching for the generations to remember (Eichenauer & Sturm, Citation2020; Karim et al., Citation2021)
We organize our paper in such a way to offer the following contributions to the existing strand of literature. First, this paper investigates how causal linkages between crude oil and stock market change for major oil exporting and oil importing countries immediately before and after the breakout of the COVID-19 pandemic. Second, using impulse response and forecast error variance decomposition based on panel vector autoregression, we examine how shocks to oil and stock returns influence each other before and after the outbreak of the pandemic.
The remaining paper proceeds as follows: We review the relevant literature in the second part. Part three presents the description of data. Part four presents the research methodology used for the study, part five discusses the empirical findings of the study and finally in section six, we provide concluding remarks, future scope of the study and policy implications of the findings.
2. Review of literature
The research on linkage between the oil price change and its impact on stock prices started with the work of (Chen et al., Citation1986) and (Jones & Kaul, Citation1996). These are the early studies in the field of movement of oil prices as an indicator of stock price changes. After that, there is plenty of literature examining the different aspects of oil price movement and its impact on the stock market. Some of the most notable works are done by (Antonakakis et al., Citation2017; Basher et al., Citation2018; Boldanov et al., Citation2016; Bouri, Citation2015; Maghyereh & Awartani, Citation2016; Mokni, Citation2020; Shanken & Weinstein, Citation2006; Wang & Liu, Citation2016). (Sukcharoen et al., Citation2014) concluded that, there is a weak dependence between the oil prices and stock indices in most cases. They further concluded that this is not the in case of large oil producing and oil consuming countries such as the USA and Canada. For large oil producing and consuming countries like the USA and Canada, there exists strong dependence between the oil prices and stock indices. The same finding is obtained by the (Akoum et al., Citation2012). They concluded that in the GCC (Gulf Cooperation Council) countries, the majority being producers of oil, there is a lack of dependence between the oil prices and stock returns in the short run. However, in the long run they co-move together. (Degiannakis et al., Citation2018) did a comprehensive overview of the stock returns, oil prices and exchange rate movement. The findings suggest that the oil prices respond positively to the aggregate demand shocks and oil shock negatively affects the US dollar index. Similar findings are obtained by (Singhal et al., Citation2019), where they concluded that the oil prices negatively influence the exchange rate in the long run whereas in the short run no interdependency is found. The stock prices of both the groups of countries, oil exporting as well as oil importing countries react disproportionately to the changes in the oil prices (Salisu & Isah, Citation2017). There is bi-directional spillover between the two markets, that is, between the oil shock and stock market (Salisu & Oloko, Citation2015). The COVID-19 pandemic will open new doors and avenues in terms of stock returns and oil prices (Ashraf, Citation2020; Onali, Citation2020; Sharif et al., Citation2020).
The results of the fresh studies based on the experimental examinations suggests that prices of oil do have an impact on the stock returns (Boldanov et al., Citation2016; Filis et al., Citation2011; Memmel, Citation2020; Wang & Liu, Citation2016; Wang et al., Citation2013). A comprehensive table is presented below for the review of relevant literature.
As can be seen from the preceding discussion, our study differs with the previous studies in three ways. First, instead of applying the time series techniques, we have used a panel data approach to eliminate the limitations of time series and to get robust results (Salles et al., Citation2019). Second, we perform distinct analyses for oil exporting and oil importing countries before and after the outbreak of COVID-19. This way the results can be compared for two sets of countries. Finally, the post COVID-19 revelation period is taken up to December 2020 which is the largest so far as other studies have taken very small periods and consequently their results are questionable.
3. Data
In this study, we use daily closing prices of the leading stock indices of 14 countries along with the daily price history of Brent crude oil. The sample period ranges from 1 January 2019 to 31 December 2020. Out of the 14 countries, 5 are net oil exporting countries and 9 are net oil importing countries. For choosing the countries for which crude oil plays a significant role. However, we drop Kuwait and Venezuela as both are not even included in “S&P Dow Jones Emerging Markets Index”. Among oil exporting countries, we include Saudi Arabia (Tadawul All Share Index), Russia (MOEX Russia Index), Canada (S&P/TSX Composite Index), Mexico (S&P/BMV IPC), and Norway (OBX Index). For oil importing countries, we consider the United States (S&P 500), the United Kingdom (FTSE), France (CAC), Germany (DAX), Spain (IBEX 35), China (Shanghai Composite), Japan (Nikkei 225), India (Nifty 50) and South Korea (Kospi). We carry out the whole series of analyses for two sub-periods. The first sub-period starts from 1 January 2019, and ends on 6 March 2020, that is, immediately before the oil price crash. The second sub-period ranges from 9 March 2020 till 31 December 2020.
shows average, minimum, and maximum values of crude oil and stock indices. In the first period, the average price of the Brent crude oil is $63.4 while in the second period it is around $39.8. The stock indices of all the countries except for China, Japan, Russia, Korea, and the United States have lower averages during the second period. Stock indices of all the countries except for China hit bottom during the second time. The Chinese market hit bottom earlier as the negative impacts of COVID-19 pandemic had made their way much earlier in the country. A comparison of the maximum values in the two time periods reveals that for half of the countries, the stock indices could not get to the previous highs.
presents descriptive statistics of daily percentage returns for the stock indices of oil exporting countries. The same also presents the descriptive statistics for the daily percentage changes in oil prices. Panel 1 displays the summary measures for the first subperiod and Panel 2 presents the same measures for the second subperiod. presents the similar measures for oil importing countries. An examination of reveals that for both sets of countries standard deviation is higher in the second period. All the countries have negative skewness during both the periods except India and Mexico in the first period and Japan in the second period. Kurtosis is also higher in the second period for all countries except China. Oil price changes also have larger variability, negative skewness, and higher kurtosis during the second period. Standard deviation measures the variability of the data, skewness measures the asymmetry of the probability distribution, Kurtosis measures how heavily the tails of a distribution differs from a normal distribution and mean of the data is the average or central value of the finite set of numbers (Alam et al., Citation2021; Mandel, Citation2012).
4. Methodology
The present study employs the Panel Vector Autoregression (PVAR) initially proposed by (Holtz-Eakin et al., Citation1988). Later, Love and Zicchino (Citation2006) implemented Panel VAR in the Generalised Method of Moments (GMM) framework. A recent implementation of Panel VAR can be found in Abrigo and Love (Citation2016) and Salisu et al. (Citation2020). In our case, the panel VAR consists of two endogenous variables, that is, stock returns and oil price changes. Specifically, the PVAR is given as:
Where,
,is return for ith index at time t;
is return on crude oil at time t; α and β are parameters to be estimated;
, and
are country-specific effects; and,
and
are error terms.
As suggested by (Holtz-Eakin et al., Citation1988) we estimate EquationEquations (1)(1)
(1) and (Equation2
(2)
(2) ) using GMM in the framework of panel vector autoregression for efficiency gains. In addition, we estimate the PVAR equations separately for oil exporting and oil importing countries for the two time periods.
5. Results and discussion
First, we employ (Levin et al., Citation2002) test to determine whether the variables under consideration have a unit root. The results for stock and oil returns for the two time periods are given in separately for oil exporting and oil importing countries. As expected, the test results reveal that both stock returns and oil returns don’t have a unit root for both the time periods.
After confirming that the variables under consideration are stationary, we estimate panel VAR with 3 lags of the endogenous variables. Then, we proceed to perform panel granger causality and present the results in . Panel A of presents the results of granger causality for oil exporting countries while Panel B presents the same results for oil importing countries. From , there is bidirectional granger causality between stock returns and oil price changes for oil exporting as well as for oil importing countries and for both the time periods. However, for oil exporting countries, granger causality from oil to stock in the first period is not very strong as the test statistic is only marginally significant with p-value of 0.0460.
To gain deeper insights about the impacts of oil and stock returns on one another, we proceed to analyse impulse response function (IRF) and forecast error variance decomposition (FEVD) based on panel vector autoregression of EquationEquations (1)(1)
(1) and (Equation2
(2)
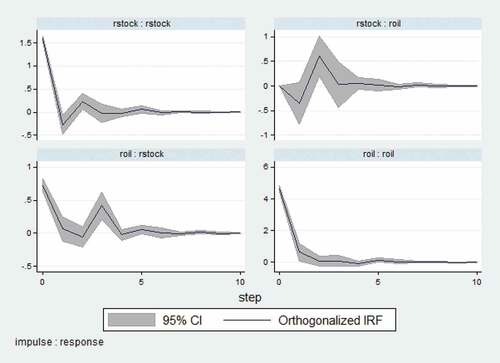
(2) ). shows the IRF graphs for oil exporting countries for the first time period and shows the IRF graphs for the second time period. The top-right graph in titled “rstock: roil” presents the response of oil returns to a unit shock to stock returns. This graph shows that a unit shock to stock returns has an oscillating impact on oil returns with a positive impact on oil returns in the first step which becomes negative in the second step and so on. The bottom left panel of presents the response of stock returns to a unit shock to oil returns. This graph reveals that a unit shock to oil return has a positive impact on stock returns for three steps and then the impact dies out. Examination of (IRF for oil exporting countries for a second time) reveals that a unit shock to stock returns initially has a negative impact which becomes positive on the next day and then dies out. The bottom left graph in shows that a unit shock to oil returns initially has a large positive contemporaneous impact on stock returns and then for next 2 steps the effect is negligible and again in the third period the effect is substantially large and positive. Thus, suggest that the impact of oil price changes is larger in the second period.
Figure 1. Impulse response graphs for first time period for oil exporting countries.Source. Authors.
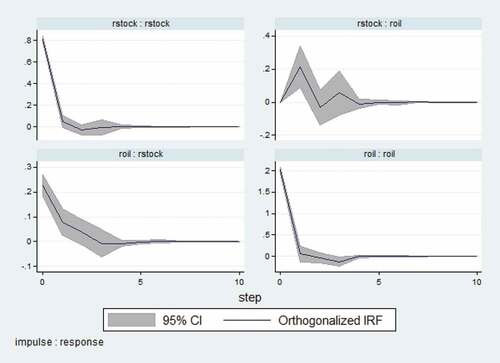
Figure 2. Impulse response graphs for second time period for oil exporting countries.Source. Authors.
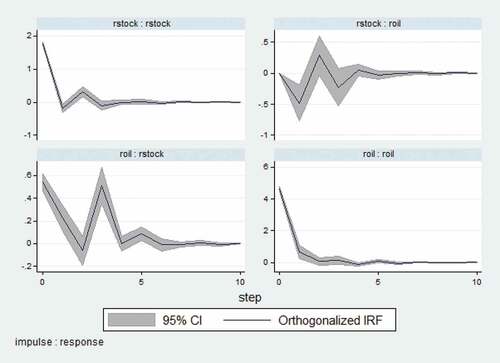
present the IRF for oil importing countries for the two time periods. An examination of the figures reveals that in the first time period shocks to stock returns have a positive impact on oil returns while in the second time period these effects are oscillating and larger. Similarly, the shocks to oil returns have a larger impact on stock returns in the second period.
Figure 3. Impulse response graphs for first time period for oil importing countries.Source. Authors.
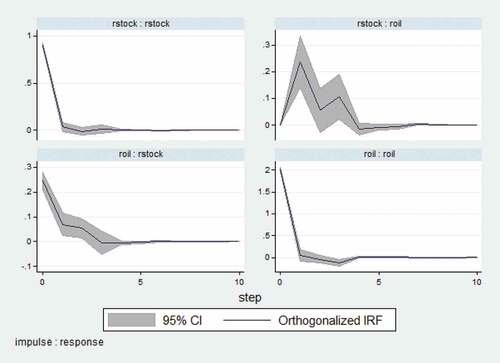
Figure 4. Impulse response graphs for second time period for oil importing countries.Source. Authors.
In , we present the forecast error variance decomposition (FEVD) for oil exporting and oil importing countries and for the two time periods. We present 1-step, 5-step and 10-step estimates of FEVD. reveals that stock returns explain only a very small portion of forecast error variance for oil returns in both the periods for both sets of countries. On the other hand, during the second time period, oil returns explain a larger proportion of forecast error variance of stock returns. In addition, the table reveals that for oil exporting countries 21.02% of error variance is explained by oil returns. While for oil importing countries the same figure stands at 15.88%.
6. Conclusion
Oil is a major input for various industries and therefore oil prices influence almost all the sectors of the economy. The study provides evidence about oil–stock relations for oil-importing and oil-exporting countries before and after the announcement of Covid-19 as pandemic. The study finds that after the World Health Organization (WHO) declared Covid-19 a pandemic, the oil–stock relations changed. In the post-declaration period, the interdependence between oil price changes and stock returns increased. It implies that after covid-19 became pandemic, changes in stock prices became more sensitive to oil price changes and vice versa. In addition, post-pandemic announcements the impacts of shocks in oil/stock prices have larger impacts on one another and such impacts persist for a greater number of days. This suggests that stock price forecasts can be improved by considering the likely changes in oil prices.
Disclosure statement
No potential conflict of interest was reported by the author(s).
Additional information
Funding
Notes on contributors

Hana Bawazir
Dr. Mustafa Raza Rabbani holds a Ph.D. in Banking and Financial Services from the prestigious Jamia Millia Islamia, University, New Delhi, India. Dr. Rabbani is a passionate researcher and in the last 2 years he has published more than 30 peer-reviewed research papers in the international journal of repute published by Emerald, Elsevier, Springer, Indesrscience, and indexed in Scopus, Web of Science (WoS) and ABDC listed, etc. He is serving as an Assistant Professor at the Department of Economics and Finance, University of Bahrain. His work has been published in a variety of international journals including Energy Economics, Research in International Business and Finance (RIBAF), Journal of Islamic and Middle eastern Finance and Management, Journal of Islamic Accounting and Business Research, Heliyon Business and Economics, Environmental Science and Pollution Research, Economic Research etc.
References
- Abrigo, M. R. M., & Love, I. (2016). Estimation of panel vector autoregression in Stata. Stata Journal, 16(3), 778–14. https://doi.org/10.1177/1536867x1601600314
- Akoum, I., Graham, M., Kivihaho, J., Nikkinen, J., & Omran, M. (2012). Co-movement of oil and stock prices in the GCC region: A wavelet analysis. Quarterly Review of Economics and Finance, 52(4), 385–394. https://doi.org/10.1016/j.qref.2012.07.005
- Alam, M., Rabbani, M. R., Tausif, M. R., & Abey, J. (2021). Banks’ performance and economic growth in India: A panel cointegration analysis. Economies, 9(1), 38. https://doi.org/10.3390/economies9010038
- Albulescu, C. T. (2020). Coronavirus and oil price crash. arXiv. https://doi.org/10.2139/ssrn.3553452
- Antonakakis, N., Chatziantoniou, I., & Filis, G. (2017). Oil shocks and stock markets: Dynamic connectedness under the prism of recent geopolitical and economic unrest. International Review of Financial Analysis, 50(C), 1–26. https://doi.org/10.1016/j.irfa.2017.01.004
- Ashraf, B. N. (2020). Stock markets’ reaction to COVID-19: Cases or fatalities? Research in International Business and Finance, 54, 101249. https://doi.org/10.1016/j.ribaf.2020.101249
- Aslam, F., Aziz, S., Nguyen, D. K., Mughal, K. S., & Khan, M. (2020). On the efficiency of foreign exchange markets in times of the COVID-19 pandemic. Technological Forecasting and Social Change, 161(April 2019), 120261. https://doi.org/10.1016/j.techfore.2020.120261.
- Aydın, L., & Ari, I. (2020). The impact of Covid-19 on Turkey’s non-recoverable economic sectors compensating with falling crude oil prices: A computable general equilibrium analysis. Energy Exploration and Exploitation, 38(5), 1810–1830. https://doi.org/10.1177/0144598720934007
- Bai, S., & Koong, K. S. (2018). Oil prices, stock returns, and exchange rates: Empirical evidence from China and the United States. North American Journal of Economics and Finance, 44(October), 12–33. https://doi.org/10.1016/j.najef.2017.10.013
- Basher, S. A., Haug, A. A., & Sadorsky, P. (2018). The impact of oil-market shocks on stock returns in major oil-exporting countries. Journal of International Money and Finance, 86(C), 264–280. https://doi.org/10.1016/j.jimonfin.2018.05.003
- Boldanov, R., Degiannakis, S., & Filis, G. (2016). Time-varying correlation between oil and stock market volatilities: Evidence from oil-importing and oil-exporting countries. International Review of Financial Analysis, 48(C), 209–220. https://doi.org/10.1016/j.irfa.2016.10.002
- Bouri, E. (2015). Oil volatility shocks and the stock markets of oil-importing MENA economies: A tale from the financial crisis. Energy Economics, 51, 590–598. https://doi.org/10.1016/j.eneco.2015.09.002
- Chen, N.-F., Roll, R., & Ross, S. A. (1986). Economic forces and the stock market. The Journal of Business, 59(3), 383. https://doi.org/10.1086/296344
- Czeczeli, V., Kolozsi, P. P., Kutasi, G., & Marton, Á. (2020). Economic exposure and crisis resilience in exogenous shock: The short-term economic impact of the covid-19 pandemic in the EU. Public Finance Quarterly, 65(3), 321–347. https://doi.org/10.35551/PFQ_2020_3_1
- Degiannakis, S., Filis, G., & Arora, V. (2018). Oil prices and stock markets: A review of the theory and empirical evidence. Energy Journal, 39(1), 85–130. https://doi.org/10.5547/01956574.39.5.sdeg
- Dharani, M., Hassan, M. K., Rabbani, M. R., & Huq, T. (2022). Does the Covid-19 pandemic affect faith-based investments? Evidence from global sectoral indices. Research in International Business and Finance, 59, 101537. https://doi.org/10.1016/j.ribaf.2021.101537
- Eichenauer, V., & Sturm, J.-E. (2020). The economic policy measures of Switzerland at the beginning of the COVID-19 pandemic. Perspektiven Der Wirtschaftspolitik, 21(3), 290–300. https://doi.org/10.1515/pwp-2020-0027
- Elder, J., & Serletis, A. (2010). Oil price uncertainty. Journal of Money, Credit and Banking, 42(6), 1137–1159. https://doi.org/10.1111/j.1538-4616.2010.00323.x
- Filis, G., Degiannakis, S., & Floros, C. (2011). Dynamic correlation between stock market and oil prices: The case of oil-importing and oil-exporting countries. International Review of Financial Analysis, 20(3), 152–164. https://doi.org/10.1016/j.irfa.2011.02.014
- Guesmi, K., & Fattoum, S. (2014). Return and volatility transmission between oil prices and oil-exporting and oil-importing countries. Economic Modelling, 38, 305–310. https://doi.org/10.1016/j.econmod.2014.01.022
- Hassan, M. K., Rabbani, M. R., & Abdullah, Y. (2021). Socioeconomic impact of COVID-19 in MENA region and the role of Islamic finance. International Journal of Islamic Economics and Finance (IJIEF), 4 (1), 51–78. 10.18196/ijief.v4i1.10466
- Hassan, M. K., Rabbani, M. R., & Ali, M. A. (2020). Challenges for the Islamic Finance and banking in post COVID era and the role of Fintech. Journal of Economic Cooperation and Development, 43(3).
- Holtz-Eakin, D., Newey, W., & Rosen, H. S. (1988). Estimating vector autoregressions with panel data. Econometrica, 56(6), 1371. https://doi.org/10.2307/1913103
- Jones, C. M., & Kaul, G. (1996). Oil and the stock markets. Journal of Finance, 51(2), 463–491. https://doi.org/10.1111/j.1540-6261.1996.tb02691.x
- Karim, S., Naeem, M. A., Rabbani, M. R., & Meero, A. R. (2021). Examining the role of gender diversity on ownership structure-sustainable performance nexus: Fresh evidence from emerging markets. Environmental Science and Pollution Research, 1–16.
- Karim, S., Rabbani, M. R., & Khan, M. A. (2021). Determining the key factors of corporate leverage in Malaysian service sector firms using dynamic modeling. Journal of Economic Cooperation and Development, 42(3), 1–20.
- Khan, S., Hassan, M. K., & Rabbani, M. R. (2021). An artificial intelligence-based islamic fintech model on Qardh-Al-Hasan for COVID 19 affected SMEs. Islamic Perspective for Sustainable Financial System. Istanbul University Press: Istanbul, Turkey.
- Levin, A., Lin, C. F., & Chu, C. S. J. (2002). Unit root tests in panel data: Asymptotic and finite-sample properties. Journal of Econometrics, 108(1), 1–24. https://doi.org/10.1016/S0304-4076(01)00098-7
- Lipshitz, C., & Walter, I. (2020). Public pension reform and the 49th parallel: Lessons from Canada for the U.S. Financial Markets, Institutions and Instruments, 29(4), 121–162. https://doi.org/10.1111/fmii.12133
- Love, I., & Zicchino, L. (2006). Financial development and dynamic investment behavior: Evidence from panel VAR. Quarterly Review of Economics and Finance, 46(2), 190–210. https://doi.org/10.1016/j.qref.2005.11.007
- Maghyereh, A., & Awartani, B. (2016). Oil price uncertainty and equity returns: Evidence from oil importing and exporting countries in the MENA region. Journal of Financial Economic Policy, 8(1), 64–79. https://doi.org/10.1108/JFEP-06-2015-0035
- Mandel, J. (2012). The statistical analysis of experimental data. Courier Corporation.
- Memmel, C. (2020). What drives the short-term fluctuations of banks’ exposure to interest rate risk? Review of Financial Economics, 38(4), 674–686. https://doi.org/10.1002/rfe.1100
- Mokni, K. (2020). Time-varying effect of oil price shocks on the stock market returns: Evidence from oil-importing and oil-exporting countries. Energy Reports, 6, 605–619. https://doi.org/10.1016/j.egyr.2020.03.002
- Naeem, M. A., Rabbani, M. R., Karim, S., & Billah, M. (2022). Religion vs ethics: Hedge and haven properties of Sukuk and green bonds for stock markets pre- and during COVID-19. International Journal of Islamic and Middle Eastern Finance and Management. In press.
- Onali, E. (2020). COVID-19 and stock market volatility. SSRN Electronic Journal. https://doi.org/10.2139/ssrn.3571453
- Pankaje, N., Rahiman, H. U., Rabbani, M. R., Kulal, A., Toushif, A., & Irfana, S. (2022). COVID-19 and its impact on educational environment in India. In Environmental science and pollution research. In Press.
- Pattnaik, D., Hassan, M. K., Kumar, S., & Paul, J. (2020). Trade credit research before and after the global financial crisis of 2008 – A bibliometric overview. Research in International Business and Finance, 54, 101287. https://doi.org/10.1016/j.ribaf.2020.101287
- Rabbani, M. R., Abdulla, Y., Basahr, A., Khan, S., & Moh’d Ali, M. A. (2020a). Embracing of fintech in Islamic finance in the post COVID era. 2020 International Conference on Decision Aid Sciences and Application (DASA) (IEEE), 1230–1234.
- Rabbani, M. R., Abdullah, Y., Bashar, A., Khan, S., & Ali, M. A. M. (2020b). Embracing of fintech in Islamic finance in the post COVID era. 2020 International Conference on Decision Aid Sciences and Application (DASA), Sakheer, Bahrain, https://doi.org/10.1109/DASA51403.2020.9317196., 1230–1234.
- Rabbani, M. R., Ali, M. A. M., Rahiman, H. U., Atif, M., Zulfikar, Z., & Naseem, Y. (2021b). The response of Islamic financial service to the covid-19 pandemic: The open social innovation of the financial system. Journal of Open Innovation: Technology, Market, and Complexity, 7 (2), 1–18. 10.3390/joitmc7020136
- Rabbani, M. R., Bashar, A., Nawaz, N., Karim, S., Ali, M. A. M., Khan, A., Rahiman, H., & Alam, S. (2021a). Exploring the role of Islamic fintech in combating the after-shocks of COVID-19: The open social innovation of the Islamic financial system. Journal of Open Innovation: Technology, Market, and Complexity, 7 (2), 136. 10.3390/joitmc7020136
- Rabbani, M. R., Bawazir, H., Khan, S., Karim, S., & Chebab, D. (2022). Smart contract-based Islamic Fintech model for Mudaraba financing. International Journal of Business Innovation and Research. In press.
- Rabbani, M. R., Khan, S., & Atif, M. machine learning based p2p lending Islamic fintech model for Small and Medium Enterprises (SMEs) in Bahrain. (2021c). International Journal of Business Innovation and Research, 1(1), 1. Forthcoming. https://doi.org/10.1504/IJBIR.2021.10040857
- Sachs, J. D., Horton, R., Bagenal, J., Ben Amor, Y., Karadag Caman, O., & Lafortune, G. (2020). The lancet COVID-19 Commission. The Lancet, 396(10249), 454–455. https://doi.org/10.1016/S0140-6736(20)31494-X
- Salisu, A. A., Ebuh, G. U., & Usman, N. (2020). Revisiting oil-stock nexus during COVID-19 pandemic: Some preliminary results. International Review of Economics and Finance, 69, 280–294. https://doi.org/10.1016/j.iref.2020.06.023
- Salisu, A. A., & Isah, K. O. (2017). Revisiting the oil price and stock market nexus: A nonlinear Panel ARDL approach. Economic Modelling, 66, 258–271. https://doi.org/10.1016/j.econmod.2017.07.010
- Salisu, A. A., & Oloko, T. F. (2015). Modeling oil price–US stock nexus: A VARMA–BEKK–AGARCH approach. Energy Economics, 50, 1–12. https://doi.org/10.1016/j.eneco.2015.03.031
- Salles, R., Belloze, K., Porto, F., Gonzalez, P. H., & Ogasawara, E. (2019). Nonstationary time series transformation methods: An experimental review. Knowledge-Based Systems, 164, 274–291. https://doi.org/10.1016/j.knosys.2018.10.041
- Shanken, J., & Weinstein, M. I. (2006). Economic forces and the stock market revisited. Journal of Empirical Finance, 13(2), 129–144. https://doi.org/10.1016/j.jempfin.2005.09.001
- Sharif, A., Aloui, C., & Yarovaya, L. (2020). COVID-19 pandemic, oil prices, stock market, geopolitical risk and policy uncertainty nexus in the US economy: Fresh evidence from the wavelet-based approach. International Review of Financial Analysis, 70, 101496. https://doi.org/10.1016/j.irfa.2020.101496
- Singhal, S., Choudhary, S., & Biswal, P. C. (2019). Return and volatility linkages among international crude oil price, gold price, exchange rate and stock markets: Evidence from Mexico. Resources Policy, 60(January), 255–261. https://doi.org/10.1016/j.resourpol.2019.01.004
- Sitara, K., Akhtar, M. U., Tashfeen, R., Raza Rabbani, M., Rahman, A. A. A., & AlAbbas, A. (2021b). Sustainable banking regulations pre and during coronavirus outbreak: The moderating role of financial stability. Economic Research-Ekonomska Istraživanja, 1–18.
- Sukcharoen, K., Zohrabyan, T., Leatham, D., & Wu, X. (2014). Interdependence of oil prices and stock market indices: A copula approach. Energy Economics, 44, 331–339. https://doi.org/10.1016/j.eneco.2014.04.012
- Wang, Y., & Liu, L. (2016). Crude oil and world stock markets: Volatility spillovers, dynamic correlations, and hedging. Empirical Economics, 50(4), 1481–1509. https://doi.org/10.1007/s00181-015-0983-2
- Wang, Y., Wu, C., & Yang, L. (2013). Oil price shocks and stock market activities: Evidence from oil-importing and oil-exporting countries. Journal of Comparative Economics, 41(4), 1220–1239. https://doi.org/10.1016/j.jce.2012.12.004
- Yang, L., Cai, X. J., & Hamori, S. (2017). Does the crude oil price influence the exchange rates of oil-importing and oil-exporting countries differently? A wavelet coherence analysis. International Review of Economics and Finance, 49, 536–547. https://doi.org/10.1016/j.iref.2017.03.015
- Zimon, G., Sobolewski, M., & Lew, G. (2020). An influence of group purchasing organizations on financial security of SMEs operating in the renewable energy sector-case for Poland. Energies, 13(2926), 11. https://doi.org/10.3390/en13112926
Appendices
Table A1. Average levels of stock price and crude oil
Table A2. Descriptive statistics for oil exporting countries and crude oil
Table A3. Descriptive statistics for stock index returns of oil importing countries
Table A4. Results of panel unit root test
Table A5. Results of granger-causality
Table A6. Forecast error variance decomposition