
 ?Mathematical formulae have been encoded as MathML and are displayed in this HTML version using MathJax in order to improve their display. Uncheck the box to turn MathJax off. This feature requires Javascript. Click on a formula to zoom.
Abstract
This study focused on analyzing the determinants of technology upgrading and productivity growth in cassava production of farms in Dak Lak province from 2015 to 2018. Using the Data Envelopment Analysis method (DEA) to obtain the Malmquist indices of the total factor productivity (TFPCH) and decomposing it into technical efficiency change (EFCH) and technological change (TECHCH), we found a general improvement in productivity of the farms. Meanwhile, general technology upgrading was observed, but the technical efficiency of the farms was reduced. From logistic regression analyses, it is shown that institutional factors such as technical training and accessibility to banks and economic factors such as capital stock of farms increase the probability of productivity growth in the farms. However, technical training is the only factor that significantly contributed to the likelihood of the technology upgrading of the farms. In particular, we did not find household characteristics such as gender, ethnicity, schooling, and experience in cassava production significantly impact the farms’ technology upgrading and productivity growth.
PUBLIC INTEREST STATEMENT
This study analyzed technological upgrading and productivity growth determinants in cassava production in Dak Lak province, Vietnam. We found that institutional factors such as technical training and accessibility to banks and economic factors such as capital stock increase productivity in the farms. However, specialized training is the only factor that significantly contributed to the likelihood of the technology upgrading. In particular, we did not find household characteristics such as gender, ethnicity, schooling, and experience in cassava production significantly impact the farms’ technology upgrading and productivity growth. We, therefore, suggest that gender or ethnicity-oriented approaches can be excluded from technical extension programs for cassava production growers in the study sites.
1. Introduction
Cassava (Manihot esculenta Crantz) is a tropical plant species cultivated mainly in South America, Africa, and Asia for multiple purposes, including alcohol production for biofuels, cattle feed, and use in food. In Africa, cassava has been seen as a robust poverty reduction crop. In one study, it was found that more than two-thirds of the total production of cassava was consumed daily (Cock, Citation1982). Cassava production has proved to be more suitable for cultivation by poorer farmers than other crops because it requires low input cost and is easy to take care of. Besides, cassava grows well across a broad ecological spectrum and tolerates poor soil, unfavorable weather, and diseases more than other crops (Nweke, Citation2004). In Asia, cassava has become an important cash crop for smallholder income and rural livelihood instead of a subsistence food crop. In many Asian countries, cassava has been classified as an industrial and energy crop and planned to increase cassava production volume at the national level. The rapid spread of commercial cassava cultivation has led to significant land-use changes in the Southeast Asian region (De Koninck & Rousseau, Citation2012; Lefroy, Citation2014). Cassava production has increased rapidly in Asian countries. In 2013, the total output of Vietnamese cassava production was 9.74 million tons, with an annual growth rate of 16% from 2004 to 2013. In 2018, Vietnam grew over 500,000 ha of cassava, generated over USD 1 billion in export earnings, and became the world’s second-largest exporter of cassava products. In the same year, Indonesia grew 1,000,000 ha of cassava, but this country remained the second-largest importer of cassava starch (Smith et al., Citation2018). The high price of cassava products creates livelihood opportunities for many smallholders in ASEAN countries. However, China’s new alternative agricultural policies could change the future of the cassava market. A shift from cassava to maize as input for biofuel production in China may lead to a significant decline in demand for cassava products from ASEAN countries (Smith et al., Citation2018).
Technology improvement of farms can improve the productivity and profitability of cassava production. The learning ease and the relative advantage are the essential characteristics of a technology when smallholders consider improving their current technology. A multitude of studies over the years has tried to provide insights into how a wide range of agricultural technologies have been adopted and have attempted to identify numerous factors relating to adoption decisions. For example, Akudugu et al. (Citation2012) classified the determinants of agricultural technology adoption into three categories: economic, institutional, and social factors. Economic factors such as the size of land, additional income, and costs associated with innovations generally play vital roles (Cramb et al., Citation2017; Mwangi & Kariuki, Citation2015). Rogers (Citation1995) pointed out that reliable sources of information on innovations and the accessibility to this information are significant. Thus, organizations such as agricultural extension units or farmers’ clubs are often considered reliable sources for enhancing the diffusion of agricultural innovations. Institutional support to help farmer-to-farmer learning has also been found to be a vital contributor to technological changes. Finally, social factors such as household characteristics are generally found to influence technology adoption decisions, and these include factors such as a farmer’s education level, age, gender, and overall size of the household.
Unlike previous studies, this paper focuses on measuring the improvement of technology (technology upgrading) of cassava production without focusing on any specific technology introduced to farmers. This progress in the technology may come from endogenous household factors such as characteristics or economic conditions of households, or it may be an outcome of exogenous factors such as agricultural extension services or credit policies. Investigating the determinants of the technology upgrading in cassava production can provide insights for policymakers in the farming sector. Also, determinants of productivity improvement and the capability to benchmark the best farms are analyzed in this paper.
2. Methods and data
A two-stage procedure has been applied in this paper: the results of Data Envelopment Analysis (non-parametric benchmarking approaches) in the first stage and parametric modeling in the second stage. First, we calculated Malmquist indices of the total factor productivity (TFPCH). We decomposed it into technological change (TECHCH) and technical efficiency change (EFCH) for cassava farms by applying a CCR (Charnes et al., Citation1978) model using panel data in the period 2015–2018. Secondly, these indices were recoded as binary dependent variables and regressed with a set of social, economic, and institutional factors. Specifically, we applied logistic regression in this stage. It is expected that this procedure might help explain the determinants of technology upgrading and technical efficiency improvement and the productivity of cassava farms.
2.1. Malmquist indices
Technical efficiency refers to the ability to combine inputs to produce specific outputs, which is commonly used in economics. Technical efficiency is the ability of a decision-making unit (DMU) to maximize its outputs with a vector of given inputs or to minimize its inputs to have a vector of given outputs. There are several ways to calculate technical efficiency, including parametric and non-parametric methods (Battese & Coelli, Citation1995; Charnes et al., Citation1978). Among the non-parametric methods, DEA is widely used in empirical studies.
Data Envelopment Analysis (DEA) includes several quantitative models for performance evaluation and benchmarking that measure the relative efficiency of decision-making units (DMUs) using linear programming. These models have been widely applied in research in management, economics, education, and health care (Cinemre et al., Citation2006). DEA is a non-parametric method because it requires no assumption regarding the weights of the underlying production function. The DEA models, proposed by Charnes et al. (Citation1978) (or CCR) and Banker et al. (Citation1984) (or BCC), based on the linear planning problem, are formulated as follows:
We consider decision-making units denoted by DMUj
. Each DMUj uses a vector of inputs
to produce
outputs
. The primal linear programming for CCR and BCC models with input-oriented methods can be written as follows:
Subject to
where and
are respectively the ith input and rth output of the DMUo under evaluation for its efficiency score calculation.
This DEA model will be the CCR model when L ≥ 0 and U < ∞ are included as linear programming constraints. This model is sometimes called the CRS (Constant Returns to Scale) DEA model. The BCC model is obtained if L = 1 and U = 1. This model is also called VRS (Variable Returns to Scale) DEA model.
Färe et al. (Citation1994) specified the Malmquist total factor productivity index (TFPCH) based on DEA models. This index can be decomposed into two components: the first component measures the technical efficiency change without any effect of the frontier shift, and the second one measures the difference in the technological frontier. By following Coelli et al. (Citation1998) and Färe et al. (Citation1994), the production technology can be defined by the technical relationship between the quantities of physical inputs and the amounts of the output of goods.
where are a non-negative input vector (
) and a non-negative output vector,
) respectively in the period t). However, the level of output a DMU can produce will increase subject to technological changes over a period. Express differently; technological improvement affects the ability of a DMU to combine inputs and outputs optimally.
The productivity of a DMU may increase over time subject to either a technical efficiency improvement or a technological improvement, or both. The technological improvement causes the production possibility frontier to shift to the right, as more outputs are obtainable from the same level of inputs. The technical efficiency improvements measure the DMU’s capability of catching up with their frontier. As presented by Färe et al. (Citation1990); (Citation1993); Citation1994) and following Worthington (Citation2000), the productivity index between the period and the period
can be measured and decomposed into the technical efficiency change and the technological change as follows:
In Equationequation (3)(3)
(3) , M is the productivity of a DMU using the technology in the period t + 1, compared with the productivity of the DMU using the technology in the period t. The subscript I denotes an input-orientation of DEA. D denotes the input distance functions. If the value of TFPCH is greater than 1, productivity growth is observed between the two periods. Following Färe et al. (Citation1993), TFPCH can be rewritten as follows:
or
where
The EFCH measures the extent of the catching-up capability of the DMU under consideration with the best DMUs on the frontier (Coelli et al., Citation1998). Put differently, EFCH measures the individual improvement in technical efficiency when the frontier is unchanged. TECHCH measures the shift of the frontier between two periods. An index of greater than 1 implies an innovation in its representative aspect.
2.2. Econometric model specification
We used a quantitative model to study the interactions between independent variables with a binary dependent variable to derive determinants for technical efficiency, technology, and productivity improvement. In this paper, three dependent variables were considered (TFPCH, EFCH, and TECHCH). Because TFPCH, EFCH, and TECHCH are continuous, these indices were recorded as follows:
The probability that an innovation (Y = 1) occurs in such relationships can be presented by a function of a set of non-stochastic explanatory variables and a vector of unknown parameters. In this paper, logistic regressions were used to describe these relationships. Explanatory variables were selected based on previous research related to technological innovations and adoption in agriculture, including holders’ characteristics, economic factors, and institutional services. In this paper, the logistic regression specification is as follows:
Where X is a vector of independent variables, by taking the log of both sides of Equationequation (7)(7)
(7) , the logit form of the logistic regression is obtained:
2.3. Data for analysis
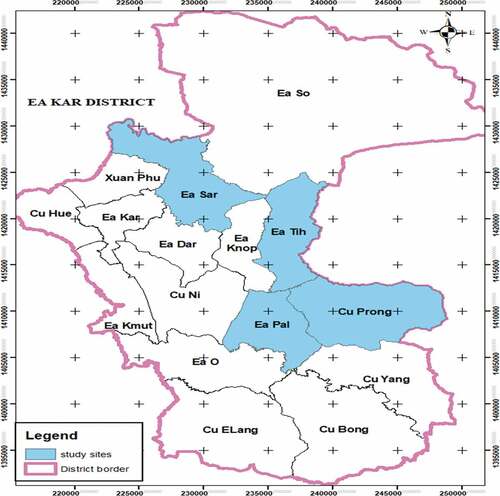
We selected the Ea Kar district in Dak Lak province, the “center” of the cassava production region, as study site locations. From 2015 to 2018, several national and international programs were implemented to convey skills and attitudes to farmers, especially cassava growers. Notably, an international project for cassava production development was conducted by the Australian Centre for International Agricultural Research (ACIAR) provided farmers with technical training and high-yield cassava varieties.Footnote1 In addition, this project also focused on identifying actors along the cassava value chain to derive measures to upgrade it. At the district level, the District Extension Unit, Women’s Unions, and Farmers’ Associations were also involved in agricultural extension activities to facilitate innovation in cassava production for smallholders in this region. For the reasons mentioned above, it was expected that the overall impact of these efforts would improve the productivity and technology of cassava farms.
shows the study site locations. We applied the rule-of-thumb sample size in logistic regression, that is, the events per variable (EPV) of more than 10 (Smeden et al., Citation2018). Thus, we determined a sample size of 240 households to survey (EPV = 20). The data were collected using a structured questionnaire through two waves of surveys in 2015 and 2018. The farms were selected with a stratified sampling method. Notably, these farms were randomly selected based on a list of households growing cassava in four selected communes: Ea Sar, Ea Tih, Cu P’rong, and Ea Pal of EaKar District, Dak Lak province ().Footnote2 The second survey wave was carried out with the same farms in 2018. After removing irrelevant and missing data, we obtained panel data of 200 farms.Footnote3
Figure 1. Map of survey sites. Source: Authors’ drawing.
The questionnaire was constructed to collect data regarding the demographic characteristics of the households. In addition, we also collected data regarding cassava production, economic aspects, and institutional supports in cassava production.
3. Results and discussion
3.1. Characteristics of surveyed households
In , 200 households (farms) were grouped according to their cassava farm’s size: small-scale farms () and large-scale farms (
).
Table 1. Farm holder’s characteristics of Eakar DIstrict, Dak Lak province (2018)
The scale of farms was relatively diverse, with an average size of cassava farms of 1.14 ha. Most farmers, accounting for at least 98 percent of farmers in all communes, sold fresh cassava to a starch factory (DAKFOCAM) located in the district’s center. Cassava productivity was about 23.17 MT/ ha in the fresh roots and differed slightly following the farm’s size (Smith et al., Citation2018). We can classify the cassava growers into the majority ethnic groups (Kinh, Tay, and Thai) and the minority ones (other ethnicities).Footnote4 The majority of ethnic groups accounted for 85 percent of surveyed farmers. The general education level of cassava growers (householder’s head) was 9.32 years, similar to the average level of education in the overall district. Most households had extensive experience in cultivating cassava (above seven years of experience).
3.2. Technical efficiency and Malmquist indices of farms
A DEA model was applied with one output -cassava fresh root yield (MT/farm), to derive efficiency scores and Malmquist indices. Four inputs of the DEA model included cassava seeds (bundles/household), fertilizer cost (thousand VND/farm), pesticide costs (thousand VND/farm), and labor (days/farm). It is worth noting that farms (also called households) are considered DMUs in this paper, so all inputs and outputs are farm-based. We used the DEAP program (Version 2.1) to estimate these scores. The efficiency scores obtained from DEA are presented in 2.
In , CRS Technical Efficiency (TECRS) is the score computed from the model of CRS (CCR model). TECRS measures the level of a farm in utilizing available inputs and its ability to overcome external factors for the best possible output (Helal & Elimam, Citation2017). VRS Technical Efficiency (TEVRS) is the score derived from the model of VRS (BCC model). TEVRS denotes the exploitation of the farms’ management for its available input (internal) to produce the best outputs. Scale Efficiency (SE) signifies the efficiency of a household in overcoming the external factors, which negatively affect the level of output (Helal & Elimam, Citation2017). The relationship between these efficiencies is SE = TECRS/TEVRS.
Table 2. Technical efficiencies calculated in CCR and BCC models in 2015 and 2018
In 2015, the geometric mean of TECRS was 0.775, which means cassava-growing farmers could have changed their farming techniques and possibly have saved 22.5% of the inputs while keeping their cassava yield unchanged. Put differently, for the crop year of 2015, with the usage of only 77.5% of the inputs (fertilizer cost, cassava seeds, labor, and pesticide cost) in a suitable way; the cassava farms could have been efficient. Similarly, in 2018, they could have saved 18.3 % by purely adjusting their technical practices in cassava farming but still have been capable of producing the same output. When the TECRS is broken down, the averages of pure technical efficiencies (TEVRS) for the cassava farms are 85.2% (2015) and 87.0% (2018). The efficiency scale (SE = 0.911 in 2015 and 0.942 in 2018) has shown that the technical efficiencies of farms were slightly affected by external factors. Besides, households became better at dealing with external factors as the averages of SE increased over the period.
From Equationequation (5)(5)
(5) , the total factor productivity change index can be decomposed into technical efficiency and technological change indices. The Malmquist index method was used to measure these indices.
In , it is shown that the total factor productivity of households generally increased over the period 2015–2018. However, on average, the productivity of large farms increased while those of small farms remained unchanged. The technology applied in cassava production generally improved because the average of TECHCH is greater than 1. Also, the technological progress in large farms (TECHCH = 1.11) was higher than that in small ones (TECHCH = 1.07). However, it shows a deterioration in the performance of the farms in the catching-up effect of the best practice on the frontier because EFCH is less than one.
Table 3. Technical efficiency, technology, and productivity changes of cassava farms
3.3. Determinants of the improvement of productivity, efficiency, and technology
For the three indices (TFPCH, EFCH, and TECHCH), an index greater than one implies that progress was observed in the aspect under consideration. Thus, TFPCH, EFCH, and TECHCH can be recorded and used as dependent variables for logistic regressions. As Mwangi and Kariuki (Citation2015) and Rogers (Citation1995) discussed, the set of explanatory variables was selected from households’ characteristics, economic factors, and institutional factors. Specifically, our explanatory variables are presented in .
Table 4. Dependent and independent variables in logit models
shows the results of logistic regressions to estimate the impact of independent variables on the probability of an improvement of total factor productivity, technical efficiency, and technology. Many previous works found that farm holders’ characteristics were significant determinants of technology innovation (Martínez-García et al., Citation2015; Ogada et al., Citation2014; Adetola, Citation2009). However, in our case with cassava, we did not find enough evidence to conclude that households’ characteristics such as gender, ethnicity, and education of the household’s head are directly related to the probabilities for improvements in TFPCH, EFCH, or TECHCH. This result can be explained through the characteristics of cassava. Most cassava varieties are highly adaptable to many different climates, grow well in poor soils, and have good resistance to pests and diseases. Thus, the growers can quickly adopt new techniques or new high-yield varieties, regardless of their characteristics.
Table 5. Binary logistic regression models
Also, most of the economic factors, such as the number of laborers (LABORS), distance to farms (DISTANCE), and experience with cassava production (EXPERIENCE), did not significantly determine the improvements of technical efficiency, technology nor productivity of cassava farms. However, institutional factors (TRAINING, ACCESSBANKS, and CAPITALSTOCK) were significant determinants of the probability of improvements in the total factor productivity of the farms.
Notably, we found that TRAINING was the only significant factor that increases the likelihood of pushing the frontier to the right. In other words, the probability of technology upgrading (measured by recoded TECHCH) was positively influenced by technical support via a form of technical training on cassava production. The households who attended the training were found to be more likely to experience progress in the technology applied in their production. Crop diversification (DIVERSECROPS) and a land area of cassava farms (AREACASS) reduced the possibility of innovative technology in cassava production. This is likely because less attention was paid to cassava crops than to other profitable crops by farms with higher crop diversification and a larger area of cassava.
Capital availability (CAPITALSTOCK) and the accessibility to the bank (ACCESSBANK) increased the improvement of farms’ catching-up capability and productivity. Still, they did not statistically enhance the chances for technology upgrading. The land area of cassava farms (AREACASS) and crop diversification (DIVERSECROP) negatively affected the capability of catching up with the best performance of cassava farms (measured by recoded EFCH). Furthermore, crop diversification (DIVERSECROP) was negatively related to improving the total factor productivity of cassava farms. Also, training (TRAINING), capital availability (CAPITALSTOCK), as well as accessibility to banks (ACCESSBANKS) increased the productivity of the households.
4. Conclusion
We have applied the two-stage procedure to analyze the panel data of 200 cassava farms in Dak Lak province, Vietnam, to derive determinants of the possibility for improvements in technical efficiency, technology, and productivity. Our primary positive or non-null result is that only technical support facilitated by training plays a crucial role in increasing the likelihood of technology upgrading in cassava production. This carries the implication that policies on cassava production development should emphasize technical support via training for cassava growers. Other works (e. g. Rogers, Citation1995; Adetola, Citation2009; Ogada et al., Citation2014; Martínez-García et al., Citation2015; Mwangi & Kariuki, Citation2015,; Cramb et al., Citation2017) have shown there may exist other, or multiple determinants of agricultural improvement in technology. Our data and model do not necessarily contradict this, as it should be borne in mind that our present conclusion is based only on the situation involving cassava culture, which, as we noted earlier, was somewhat unique in that after planting, inputs, and maintenance for this crop are minimal.
We also found that the bank accessibility and capital stock of households significantly increased the possibility for the productivity and the technical efficiency improvements of the farms, rather than pushing the frontier to the right or creating progress in technology. Besides, crop diversification and the land area of cassava under cultivation were found to negatively affect the chances for cassava production technology upgrading. However, households’ characteristics were not found to be significant determinants of the likelihood of improvements in productivity, technical efficiency, or the technology of the cassava farms. We, therefore, suggest that gender or ethnicity-oriented approaches can be excluded from technical extension programs for cassava production growers in the study site.
Disclosure statement
No potential conflict of interest was reported by the author(s).
Additional information
Funding
Notes on contributors
Vo Xuan Hoi
Vo Xuan Hoi (MA), Nguyen Duc Quyen (MA) are lecturers and Ph.D. students at Tay Nguyen University, Vietnam. Their research interests include microfinance, rural development, and enterprise risk management.
Do Thi Thanh Xuan
Do Thi Thanh Xuan (MA), Bui Ngoc Tan (MA), Nguyen Thi Phuong Thao (MA), Le The Phiet (Ph.D.), and Nguyen Van Dat (Ph.D.) are senior lecturers of economics at Tay Nguyen University, Vietnam. Their research interests center around poverty reduction, livelihood, rural development, business management.
Thai Thanh Ha
Thai Thanh Ha (Ph.D.) is an associate professor of business management at Foreign Trade University, Vietnam. His research interests focus on operational management, entrepreneurship, and CRM.
Le Duc Niem
Duc Niem (Ph.D.) is an associate professor of economics, Tay Nguyen University, Vietnam. His research interests focus on economic modeling, entrepreneurship, and international trade. He participated in Project AGB/2012/078 entitled Developing value chain linkages to improve smallholder cassava production systems in Vietnam and Indonesia (ACIAR).
Notes
1. A component of the project named “Developing value-chain linkages to improve smallholder cassava production systems in Vietnam and Indonesia” was conducted in Ea Kar District (from 2016 to 2020).
2. A list consisting of 1,790 households was made based on data from People’s Commitees of 4 selected communes.
3. We obtained 230 and 200 responses in the first wave and the second wave respectively. As a result, the final sample size was 200 households.
4. Kinh is officially recognized as the ethnic majority of Vietnam. However, we included Kinh, Tay and Thai into the majority group because they are similar in culture and production abilities.
References
- Adetola, I. (2009). Factors influencing irrigation technology adoption and its impact on household poverty in Ghana. Journal of Agriculture and Rural Development in the Tropics and Subtropics, 109(1), 51–13 https://www.jarts.info/index.php/jarts/article/view/73/66.
- Akudugu, M. A., Guo, E., & Dadzie, S. K. (2012). Adoption of modern agricultural production technologies by farm households in Ghana: What factors influence their decisions? Journal of Biology, Agriculture and Healthcare, 2(3), 1–13 https://www.iiste.org/Journals/index.php/JBAH/article/view/1522/1454.
- Banker, R. D., Charnes, A., & Cooper, W. W. (1984). Some models for estimating technical and scale inefficiencies in data envelopment analysis. Management Science, 30(9), 1078–1092. https://doi.org/10.1287/mnsc.30.9.1078
- Battese, G. E., & Coelli, T. J. (1995). A model for technical inefficiency effects in a stochastic frontier production function for panel data. Empirical Economics, 20(2), 325–332. https://doi.org/10.1007/BF01205442
- Charnes, A., Cooper, W. W., & Rhodes, E. (1978). Measuring the efficiency of decision making units. European Journal of Operational Research, 2(6), 429–444. https://doi.org/10.1016/0377-2217(78)90138-8
- Cinemre, H. A., Ceyhan, V., Bozoğlu, M., Demiry Ürek, K., & Kılıç, O. (2006). The cost efficiency of trout farms in the Black Sea region, Turkey. Turkey Aquaculture, 251(2–4), 324–333. https://doi.org/10.1016/j.aquaculture.2005.06.016
- Cock, J. (1982). Cassava: A Basic Energy Source in the Tropics. Science, 218(4574), 755–762. https://doi.org/10.1126/science.7134971
- Coelli, T., Rao, D. S. P., & Battese, G. E. (1998). An introduction to efficiency and productivity analysis. Kluwer Academic.
- Cramb, R., Manivong, V., Newby, J. C., Sothorn, K., & Sibat, P. S. (2017). Alternatives to land grabbing: Exploring conditions for smallholder inclusion in agricultural commodity chains in Southeast Asia. The Journal of Peasant Studies, 44(4), 939–967. https://doi.org/10.1080/03066150.2016.1242482
- De Koninck, R., & Rousseau, J. F. (2012). Gambling with the Land: The Contemporary Evolution of Southeast Asian Agriculture. NUS Press.
- Färe, R., Grosskopf, S., Lindgren, B., & Roos, P. (1993). Productivity developments in Swedish hospitals: A malmquist output index approach. In A. Charnes, W. W. Cooper, A. Y. Lewin, and L. M. Seiford (Eds.), Data envelopment analysis: Theory, methodology and applications. Kluwer 253–272 .
- Färe, R., Grosskopf, S., Norris, M., & Zhang, Z. (1994). Productivity growth, technical progress, and efficiency change in industrialized countries. The American Economic Review, 84(1), 66–83 http://www.jstor.org/stable/2117971.
- Färe, R., Grosskopf, S., Yaisawarng, S., Li, S. K., & Wang, Z. (1990). Productivity growth in Illinois electric utilities. Resources and Energy, 12(4), 383–398. https://doi.org/10.1016/0165-0572(90)90030-M
- Helal, S. M. A., & Elimam, H. (2017). Measuring the efficiency of health services areas in Kingdom of Saudi Arabia using data envelopment analysis (DEA): A comparative study between the years 2014 and 2006. International Journal of Economics and Finance, 9(4), 172–184. https://doi.org/10.5539/ijef.v9n4p172
- Lefroy, R. D. B. (2014). Non-rice crops in rice-based farming systems in Mainland Southeast Asia. Trajectories of rice-based farming systems in Mainland Southeast Asia. University of Queensland. Working Paper No. 4.
- Martínez-García, C. G., Ugoretz, S. J., Arriaga-Jordán, C. M., & Wattiaux, M. A. (2015). Farm, household, and farmer characteristics associated with changes in management practices and technology adoption among dairy smallholders. Tropical Animal Health and Production, 47(2), 311‐316. https://doi.org/10.1007/s11250-014-0720-4
- Mwangi, M., & Kariuki, S. (2015). Factors determining adoption of new agricultural technology by smallholder farmers in developing countries. Journal of Economics and Sustainable Development, 6(5 208–216 https://www.iiste.org/Journals/index.php/JEDS/article/view/20710/21632).
- Nweke, F. (2004). New challenges in the cassava transformation in Nigeria and Ghana. Environment and production technology division (EPTD). International Food Policy Research Institute, Washington, D.C., USA Discussion Paper No. 118.
- Ogada, M. J., Mwabu, G., & Muchai, D. (2014). Farm technology adoption in Kenya: A simultaneous estimation of inorganic fertilizer and improved maize variety adoption decisions. Agricultural and Food Economics, 2(1), 1–18. https://doi.org/10.1186/s40100-014-0012-3
- Rogers, E. M. (1995). Diffusion of Innovations (4th ed.). The Free Press.
- Smeden, M., Moons, K. G., Groot, J. A., Collins, G. S., Altman, D. G., Eijkemans, M. J., & Reitsma, J. B. (2018). Sample size for binary logistic prediction models: Beyond events per variable criteria. Statistical Methods in Medical Research, 28(8), 2455–2474. https://doi.org/10.1177/0962280218784726
- Smith, D., Newby, J., & Cramb, R. (2018). Developing value-chain linkages to improve smallholder cassava production in Southeast Asia. University of Queensland Discussion Paper Number 3.
- Worthington, A. C. (2000). Technical efficiency and technological change in Australian building societies. Abacus, 36(2), 189–197. https://doi.org/10.1111/1467-6281.00059
