
 ?Mathematical formulae have been encoded as MathML and are displayed in this HTML version using MathJax in order to improve their display. Uncheck the box to turn MathJax off. This feature requires Javascript. Click on a formula to zoom.
Abstract
Since globalisation accelerated in the early 1990s, income inequality has increased in most developed countries and in some middle-income countries, including China and India. Also, inequality has declined in most countries of Latin America and the Caribbean and in many Sub-Saharan African and South Asian countries. This observation corroborates the neoclassical models of convergence that predict that, in the long-run, income distribution will tend to converge across countries. In this study, I examined whether there has been convergence in inequality between 2000 and 2015. To this end, I constructed a large panel of Gini indices of 142 countries and tested for the existence of convergence clubs using the econometric methodology proposed by Phillips and Sul. The results indicate that there is no uniform convergence to one club. Instead, I found that countries’ income inequalities are converging into five different clubs. This finding is different from those reported by the few existing c ross-country studies on convergence in inequality. Furthermore, the analysis reveals strong evidence that between-club inequality increases, while within-club inequality decreases over the years. Between-club inequality is found to be determined by population growth, population density and the ratio of physical to human capital.
PUBLIC INTEREST STATEMENT
In this research, the extraction of carotenoids from gac fruit pericarp assisted with ultrasonic was study. The extraction with high temperature did not increase carotenoid contents. The optimal condition of ultrasonic-assisted extraction was obtained by using absolute ethanol as an effective solvent and extracting at 75°C for 15 min. This carotenoid extract possessed the highest antioxidant activity and carotenoid level. Moreover, the improvement of extraction yield was received while the structure and properties of carotenoids were not affected as confirmed by FTIR. The extract of gac fruit pericarp did not suppress pro-inflammatory cytokine and nor did it affect the level of anti-inflammatory cytokine.
1. Introduction
The issue of income inequality and the effects that it poses on the economies of nations has become one of the most critical preoccupations for scholars and policymakers who intervene in the field of human development (Espoir & Ngepah, Citation2021a). Understanding the deep causes, consequences and most importantly the trend of inequality over time and across countries has become central to defining policy measures that ensure that income is better distributed among the whole population (Dabla-Norris et al., Citation2015). The United Nations Sustainable Development Goal 10 is to reduce inequality within and among countries. The achievement of this goal implies two things. First, efforts should be deployed in reducing inequalities and ensuring no one is left behind. Second, achieving an egalitarian society through income distribution, therefore ensuring converge across countries and over time. According to the United Nations World Social Report (WSR) 2020, income inequality has increased in most developed countries and in some middle-income countries, including China and India, since 1990. Countries where inequality has increased are home to more than two-thirds (71 per cent) of the population of the world. The WSR also shows that increasing inequality is not a universal trend as the Gini coefficient of income inequality has declined in most countries of Latin America and the Caribbean (LAC) and in many Sub-Saharan African (SSA) and South Asian (SA) over the last two decades. Despite some positive signs toward income distribution, inequality still persists. Also, the advent of the Covid-19 pandemic has deepened existing inequalities in many countries of the World and particularly in developing countries (Francis et al., Citation2020), hitting the poorest and most vulnerable communities the hardest. Despite the recent increase between and within countries inequality due to the Covid-19 pandemic, the trends of income inequality during the pre-Covid-19 pandemic period seem to be in support of the hypothesis of convergence in relative income distributions as championed by the neoclassical growth models. Thus, this study seeks to re-investigate whether the recent trends in income inequality for the past two decades have led to convergence across countries of the world.
Testing for convergence in income inequality across countries of the world is still necessary for a couple of reasons. First, robust econometric inferences from testing the convergence in income inequality can be employed to determine new orientations in countries or regions where inequality has been stubborn to reduction policies. Second, the results obtained from a new and more robust methodology of convergence in income inequality may enable scholars, private stakeholders and public policymakers to know whether idiosyncratic country-specific factors such as sociocultural conditions (culture, practice and religion), cross-country economic structure and institutional factors (particularly governance) can also to some extent explain the differences in the reduction of inequality across nations. In other words, this implies that whenever there is evidence of convergence, it simply signifies that idiosyncratic country-specific factors might not significantly justify the differences in the reduction of inequality across countries. Third, an adoption and implementation of uniformised policy at the regional level might be a sufficient condition to realise a given threshold of reduction in inequality across countries for the region. If there is evidence of convergence, this could simply mean that earlier regional policies of income inequality reduction have been sufficient and should be continued.
Furthermore, the existing literature indicates only a few studies on the convergence in income inequality across countries. Because of this, a couple of definitional and methodological issues are found to be uncovered. To the best of my knowledge, all the existing cross–country studies have empirically investigated the convergence in income inequality using the -convergence and
-convergence method. Others have employed the conventional unit root convergence and cointegration test methods and the fixed effects dynamic panel models. Nevertheless, each of these methods has its advantages and disadvantages. For example, it has been shown that conventional
-convergence and
-convergence method may absolutely be biased (Tian et al., Citation2016). Convergence is observed if poor countries grow faster than rich countries. However, Lichtenberg (Citation1994) indicates that if the growth rate of poor countries is much higher than that in rich countries, to an extent that the rich countries are surpassed at the end with an even greater gap, the conventional
-convergence method will be inaccurate. Another argument is that white noise created during the processing of data may also bias the test statistic (t-test). Additionally, Pesaran (Citation2007) contends that if the technological progress is stochastic, per-capita GDP will not pass the
-convergence test, even though the underlying stochastic process of the economy is convergent and ergodic. Finally, Lau (Citation2010) reveals that when cross-section regression is performed to test
-convergence, this may commit Galton’s fallacy of regression to the mean and implies not only biased estimates, but also invalid test statistics. Thus, when low-income countries grow at a faster rate than high-income countries and surpass them with an even greater income gap at the end of the year of observation, the
-convergence test will be biased. In order to overcome these estimation problems, I therefore applied the club convergence test developed by Phillips et al. (Citation2007), Phillips & Sul (Citation2009)) to 142 countries of the World between 2000 and 2015, to investigate the club convergence of Gini coefficient (proxy for income inequality). Consequently, this study attempts to fill the gap in the existing literature by using the methodological approach developed by Phillips et al. (Citation2007), Phillips & Sul (Citation2009)) which helps to overcome the econometric problems associated with previous studies in testing for convergence in income inequality. This study is relevant as it contributes to the global knowledge of convergence in inequality in three key ways:
(i) As initially highlighted by Chambers and Dhongde (Citation2016), the biggest challenge to testing cross-country convergence in income inequality has been the lack of reliable data. Existing studies have investigated convergence in income inequality with sample groups that included less than 100 countries. The only study that constructed a larger panel of Gini indices of 81 countries is that of Chambers and Dhongde (Citation2016). When small samples are used to examining convergence, all the countries in the sample may display tendences to converge, especially if countries are selected from similar regions (Abramovitz, Citation1986; Soete, Citation1985). This may not necessary be the case with larger sample groups as it is more likely that a group of countries of the sample group may be converging while another diverging. Given this observation, this current study contributes by examining convergence in income inequality using a larger panel of Gini indices of 142 countries. The panel was constructed from the Standardised World income inequality Database (SWIID).Footnote1 Hence, the findings from such a large sample were considered to be reliable enough in the sense that large samples are consistent and provide robust empirical results and valuable policy implications.
(ii) Contrary to all cross-country studies that investigated convergence in income inequality using either OLS or fixed effects and dynamic panel techniques on the and
-convergence models (Bénabou, Citation1996; Bleaney & Nishiyama, Citation2003; Chambers & Dhongde, Citation2016; Clark, Citation2019; Dhongde & Miao, Citation2013; Ravallion, Citation2003), this current study utilised a new methodology proposed by Phillips et al. (Citation2007), Phillips & Sul (Citation2009)) to test for convergence in income inequality. This methodology was specifically selected for this study due to numerous advantages it has over other methodologies that I discussed. First, the Phillips et al. (Citation2007), Phillips & Sul (Citation2009)) methodology does not start from the traditional time-series assumption that the stationarity of the variables under consideration or the presence of common factors are necessary. Second, this methodology is within the family of nonlinear time-varying factor models. Third, the methodology integrates the possibilities of transition heterogeneity or transition divergence. Fourth, the methodology is capable of detecting the existence of club convergence or club formation in which different convergence paths can be distinguished among different countries involved in the process of convergence. Fifth, the methodology is able of merging clubs when the clustering process tends to overestimate the number of clubs to more than they should be in reality. All the previous cross-country studies did not take into account all these characteristics because of their methodological limitations. Hence, this study offers a more robust cross-country analysis by employing the Phillips et al. (Citation2007), Phillips & Sul (Citation2009)) methodology to test for convergence in income inequality.
(iii) While all the existing cross-country studies are limited to investigating the convergence in income inequality, this current study contributes by bringing the analysis a one step further by attempting to answer the question concerning factors that determine club formation. In this respect, our study contributed by examining the macroeconomic determinants of club formation using ordered logit model. To the best of our knowledge, this is the first cross-country study to have explored the determinants of club clustering at the world level. This analysis is pertinent from policy point of view because the reasons why countries converge, diverge or cluster into groups could be identified, thereby allowing us to shed more light on the factors behind the similarities or differences in inequality patterns among the countries.
Overall, the results indicate the absence of 1 income inequality convergence pattern at the world level. Instead, I found that countries’ income inequalities are converging into 5 different clubs. More specifically, I found that 111 countries out of 142 are converging into 3 different high-convergence clubs (clubs 3, 4 and 5 in ) countries converging into 1 moderate-convergence club, 20 countries converging into 1 low-convergence club and 2 countries that do not converge in any of the 5 convergence clubs. Furthermore, the analysis reveals strong evidence that between-club income inequality increases, while within-club income inequality decreases under the study period. Finally, the ordered response model (ordered logit model) confirms the pivotal role of initial conditions (initial Gini and initial per capita GDP) and thus corroborates the hypothesis of club convergence.
Table 1. List of countries grouped into different regions
Table 2. Variables, notation and summary statistics
Table 3. Inequality and final club convergence/divergence results, and club merging at the world level
Table 4. Club summary statistic
The remainder of this study is structured as follows: Section 2 provides the related literature review, Section 3 presents the Phillips et al. (Citation2007), Phillips & Sul (Citation2009)) methodology, data source and the model used to examine the determinants of club clustering. Section 4 presents and discusses the empirical results. Section 5 provides the conclusion of the study.
2. Literature review
Several studies have attempted to examine the convergence hypothesis using the per capita income framework (see, Barro et al., Citation1991; Mankiw et al., Citation1992; Rattsø & Stokke, Citation2014; Royuela & Garcia, Citation2015; Temple, Citation1999). Compared to the large literature on convergence in per capita incomes across countries, empirical literature on convergence in income inequality is relatively scarce. Most empirical evidence of convergence in income inequality are focused on country-specific case studies. For Lin and Huang (Citation2011, Citation2012) use -convergence method on the fixed-effects model to investigate income inequality convergence in a panel of United States (U.S.) and found that income inequality across the U.S. has converged over the years. Tian et al. (Citation2016) and Apergis et al. (Citation2018) investigate income inequality convergence in China and U.S, respectively, using club clustering methods developed by Phillips and Sul (Citation2007). Tian et al. (Citation2016) discovered the existence of two convergence clubs. The first was a higher income club consisting of Inner Mongolia and seven east-coast provinces (Shanghai, Tianjin, Jiangsu, Zhejiang, Guangdong, Shandong, and Fujian), and the second was a low-income club consisting of the remaining provinces. For the case of the U.S., Apergis et al. (Citation2018) report evidence of convergence in income inequality in the 1970s and early 1980s, but divergence in subsequent years. Ivanovski et al. (Citation2020) investigate stochastic convergence in income inequality across Australian states and territories since the end of World War II by means of the Lagrange Multiplier (LM) and Residual Augmented Least-Squares Lagrange Multiplier (RALS-LM) unit root tests that allow for endogenously determined structural breaks. These authors found that income inequalities were converging to a stable steady-state in the majority of the Australian states. Other country-specific case studies on convergence in income inequality are those of Marina (Citation2000), Panizza (Citation2001), Goerlich and Mas (Citation2004), Gomes (Citation2007), Kosfeld et al. (Citation2006), Christopoulos and Tsionas (Citation2007), and Ezcurra and Pascual (Citation2009); Espoir and Ngepah (Citation2021a).
For cross-country case studies, Bénabou (Citation1996) is the first to have analysed income inequality convergence utilising a sample group of 33 countries for the periods 1970–1980, 38 countries for the periods 1980–1990 and 25 countries for the periods 1970–1990. Overall, the findings of his study are unclear. On the one hand, Bénabou found significant evidence of convergence for the periods 1970–1980, and separately for the periods 1980–1990. On the other hand, when the author considered the full periods 1970–1990, he found no evidence of convergence. Ravallion (Citation2003) reexamines Bénabou’s findings using new dataset of 21 countries. By means of -convergence method, the author found a negative relationship between the initial Gini index and the subsequent change in the Gini index. Similarly, Bleaney and Nishiyama (Citation2003) consider convergence in income inequality by exploring possible differences between advanced (OECD countries) and developing countries. These two authors’ findings reveal that income inequality among OECD countries converged significantly faster compared to developing countries. Among European Union countries, both Ezcurra and Pascual (Citation2005) and Tselios (Citation2009) found significant evidence of convergence in income inequality. Alvaredo and Gasparini (Citation2015) found evidence supporting convergence in the Gini coefficients among developing countries between 1981 and 2010. Dhongde and Miao (Citation2013) compile extensive data on Gini indices over a period of 25 years (from 1980 to 2005) for developed and developing countries and estimate a dynamic panel model using the Generalised Method of Moment (GMM) estimator to test for convergence in income inequality. They found that during 1980- and 2005-income inequality converged across countries, and the speed of convergence in Gini indices was faster than the conventional 2% per year speed of convergence in per capita income. Most recently, Chambers and Dhongde (Citation2016) use a large panel of Gini indices covering 81 countries between 1990 and 2010 to reexamine the hypothesis of convergence in income distributions between developed and developing countries. These authors used Ordinary Least Squares (OLS) and GMM estimators and found significant statistical evidence that income inequality declined in countries where inequality was reported initially high, while inequality increased in countries that had initial low inequality. They also show that this pattern holds for both developed and developing countries, even though developed countries’ relative income inequalities have converged at a high speed. Lastly, Clark (Citation2019) uses data of 46 countries from the Luxembourg Income Study (LIS) during the 1990–2015 period and found that a country’s initial Gini is negatively related to subsequent change in the Gini coefficient (
-convergence method).
3. Research methodology and data
In this section, I begin by discussing the steps involved in testing for convergence, club clustering and club merging of countries. Overall, there are three steps that allow to determine whether there is convergence or divergence in the variable of interest. The three steps can be applied both at the world and club level. In addition, once convergence or divergence is established, the methodological procedure (that I explain below) makes it possible to determine the relative transition curves of each country to the common steady state.
3.1. Log t convergence test
Close to six decades ago since the seminal work of Solow (Citation1956) on growth convergence, economists have used different methods to test for the convergence hypothesis, either in per capita income or in any other macroeconomic variable. In the literature, the well-known two of those methods are the -convergence and
-convergence. However, the consistency and efficiency of the results from these two methods have been recently criticized. It has been shown that the use of the two methods yield bias estimate due to Galton’s fallacy and the natural increase in variance (Tian et al., Citation2016).Footnote2 Because of this reason, to test for convergence in inequality, our procedure adopts the so-called log t test, which is a new econometric framework to convergence testing developed by Phillips et al. (Citation2007). These two authors suggest a model specification in which the dependent variable
is decomposed into two different components. The first is the common factor,
, and the second is the idiosyncratic factor loading,
. The second component also absorbs the traditional idiosyncratic error term,
. An important element to be mentioned at this stage is that, both the common factor
and idiosyncratic factor loading
varies across the years (
). Adapting this to the topic of this study, the
determines the common income inequality transition path based on the following relation:
where acts as a unit-specific parameter of the distance to the common income inequality transition path
. For the purpose of testing for convergence, the relative transition coefficient
must be constructed, given by log Gini (proxy used for income inequality measurement) for a country (
) in relation to the panel average at time
. This can be expressed as follows:
As can be observed from EquationEq. (2(2)
(2) ), the common component
has been eliminated. Thus, the relative transition coefficient (
) is considered to be a measure that defines the relation of the factor loading
for a given country (
) to the panel average
. In this study, I used EquationEq. (2)
(2)
(2) to estimate the coefficient of
for each single country.
However, convergence in income inequality means that a country’s aggregate Gini coefficient approaches the sample average over the years. In other words, this signifies that the transition coefficient converges in the direction of
as
. This is also equivalent to convergence of the coefficient
toward unity as
. Lastly, convergence means that the cross-sectional variance of
, denoted by
, converges towards a value of zero as
. To summarise these properties for the case of time series-cross sectional data as is in EquationEq. (1)
(1)
(1) and (Equation2
(2)
(2) ), convergence is determined by the following conditions:
When convergence is tested using EquationEq. (3)(3)
(3) to (5), Phillips et al. (Citation2007) recommended a careful attention due to possible decrease in the cross-sectional variance of the sample group even if the overall convergence is not present and only local convergence in certain subgroups can be detected. To account for such potential nonstationary transitional behavior, Phillips et al. (Citation2007) suggested a semiparametric modeling of
as follows:
where denotes the part of the country-specific factor loading
that is time-invariant,
is a slowly varying increasing function (with
,
is a weakly autocorrelated random error variable assumed to be strictly exogeneous (
), and
is the speed of convergence. Based on the considerations stated in EquationEq. (6
(6)
(6) ), Phillips et al. (Citation2007) suggested an algorithm that test for convergence and club clustering based on the log t convergence test. They proposed to apply this test on a simple time-series regression involving a one-sided t-test. For our own case, for instance, the null hypothesis of convergence in inequality can be tested using the log t convergence test as follows:
Empirically, the testing procedure of convergence involves the following three steps:
Compute the cross-sectional variance ratio as captured by ratio of
(as it is in EquationEq. (5)
Perform an OLS regression of the following form:
3. One-sided t-test for using
(
= 2
) and a Heteroskedasticity and Autocorrelation Consistent (HAC) standard error.
From EquationEq. (8(8)
(8) ), note that z (z
(0,1)) is a truncation parameter that shortens the regression by a certain fraction of the first observations. Through Monte Carlo simulations, Phillips et al. (Citation2007) recommended to set z =0.3 and
for samples up to
. Phillips et al. (Citation2007) also provided the standard critical values that can be used to assess the rejection or not of the null hypothesis of convergence at the 5% level of significance. That is, reject
if, and only if,
. In the next sub section, I present the procedure for club clustering/convergence, while that of club merging algorithm is provided in the appendix.
3.2. Club clustering algorithm
For a sample group that does not converge overall, the log t test is rejected (). However, this does not mean that there is no club clustering of countries. A club clustering algorithm was developed by Phillips et al. (Citation2007) to detect both convergence clubs and diverging regions. The algorithm is completed through the following steps:
Step 1. Last observation ordering: The observations of the panel members (countries) must be sorted in descending order with respect to the last observations. This is crucial since evidence of convergence will, in most cases, be observed in the recent years. Nevertheless, another approach of ordering can be implemented. If the time series () is characterised by significant volatility even after applying log transformation, the ordering can be operated based on time-series averages of the final observations. In our own case, the first approach was employed since the rate of change in income inequality series, in most countries, are very slow and hence, the series do not exhibit substantial outliers.
Step 2. Core group formation: Under this step, the log t test is performed for the first countries. If the calculated
, then both countries establish the core group
. The same procedure is repeated for
plus the next country. If
>
, thus, the country is added to
. This procedure is repeated as long as
>
, for all
. To ensure that convergence is achieved for the corresponding group, in this study, I selected the regression that generates the maximum convergence t-statistic
, that is
>1.645.
Step 3. Filter individuals for club membership: After the core group was formed as explained in step 2, I conducted a log t tests on
with each remaining country. All countries for which
was found greater than a certain critical value
(
) satisfied the membership condition and were added to the core convergence group.
Step 4. Recursion and Stopping: Under this step, I performed the log t regression for the specific countries for which < −1.645 in the previous step. When failed to reject the null hypothesis, those countries were grouped in a different convergence club. When the null hypothesis was rejected, I repeated steps 1 to 3 on the remaining countries to determine if the group could be split into convergence clusters. If there was no
in Step 2 for which
> − 1.645, I then concluded that the remaining countries presented divergent behaviour.
However, although the Philip and Sul club clustering algorithm allows countries with similar characteristics to converge to a common steady state level, the algorithm does not provide a possibility to capture countries dynamism to move from one club to another. Although the transition dynamism is not the aim of this study, it has to be noted that this is the mayor challenges associated with this algorithm.
3.3. Ordered logit model
As presented above, the approach of Phillips et al. (Citation2007) allows to determine club formation. However, the approach does not provide information about factors that determine convergence and most specifically club formation (Azariadis, Citation1996; Galor, Citation1996; Von Lyncker & Thoennessen, Citation2017). Bartkowska and Riedl (Citation2012) suggested a two-step procedure that enables not only to test and identify convergence and club formation, but also investigate factors that possibly could explain the latter. In the first step, Bartkowska and Riedl (Citation2012) proposed to implement the Phillips et al. (Citation2007) procedure and identify club formation. In the second step, they proposed to apply an ordered logistic regression model to investigate variables that drive club formation. In terms of income distribution of a country’s economy, club convergence hypothesis suggests that the starting conditions matter. On the other hand, structural characteristics (such as economic policy choice and geographical factors) are said by conditional convergence studies to determine the long-run trajectory, independent of the initial conditions (Tian et al., Citation2016). Therefore, this current study applied the two-step procedure as proposed by Bartkowska and Riedl (Citation2012). I incorporated in the ordered regression equation both the initial conditions and some structural characteristics as explanatory variables. For robustness of our estimates, I also incorporated a proxy variable for geographic factors. By employing an ordered logit model, I considered that there exists an underlying latent variable that drives the choice between different clubs. This can be formulated as follows:
where is the unobserved dependent variable,
is a vector of explanatory variables that determine club membership for countries and
is an error term, which follows a logistic distribution. The variable that is observed is the ordinal variable
, where
denotes the maximum number of identified clubs.
=
, is a constant vector and
is a vector of parameter to be estimated through Maximum Likelihood (ML). As known in the literature, the sign and the magnitude of the coefficients of
has no sensible economic interpretation. Consequently, I calculated the conditional probability that a given country joins a given convergence club. This conditional probability can be obtained by estimating the following logistic function:
However, the significance of variables in determining club membership was examined by calculating the marginal effects of the predicted probabilities. The marginal effects allow to determine the probability that an average country belongs to the respective club when there is a unit change in the explanatory variable, when all other variables are held fixed at their sample averages.
3.4. Data
The main source of data for this study is the Standardised World Income Inequality Database (SWIID) and the variable of interest is the country Gini coefficient, which is used as proxy variable for income inequality. Two key reasons justified the preference of this database over the others (for example, the World Bank PovcalNet, the World inequality Database, etc.). First, this is the only available database of inequality that contains information spanning a very long period starting from 1960 to date, and the database includes close to 200 countries of all the regions of the World. Second, the reported Gini coefficients are associated with their standard deviations, which makes it possible to measure the degree of uncertainty in the data, basically due to less availability of underlying data to calculate inequality measures in some countries for some years. Therefore, this can be interpreted as information on the quality of the underlying data. In addition to SWIID, I collected data from the World Bank database and Penn World Table (PWT) for the different variables used to investigate the determinants of club clustering as is explained in the ordered logit section.
Using data availability as the selection criterion, I constructed a panel that considers 142 countries grouped into six regions of the world over the period 2000–2015 (T = 16). Our panel was large enough to test for convergence in income inequality at the world level as compared to some studies such as that of Ravallion (Citation2003) that used 21 countries and Chambers and Dhongde (Citation2016) that used 81 countries selected from the World Bank PovcalNet database. Using a larger sample group as is the case in this study yielded robust results. presents the list of countries contained in each region. presents the variables, notation, source, and summary statistic of the variables used for testing convergence and determinants of club convergence for the full panel and for the different regions.
As can be observed from , the variable used to test for convergence in income inequality is the country’s Gini coefficient. The calculated average Gini coefficient for the full sample is 46.37. At regional level, our calculation shows that Sub-Saharan Africa is the region with the highest level of inequality (average Gini of 49.49), followed by Latin America and the Caribbean (average Gini of 48.11). The region with the lowest average Gini coefficient is South Asia (average Gini of 41.37). In order to get an initial understanding about the distribution of inequality and its trend, the density functions for the regional distribution of the Gini coefficient over the periods 2000–2015 were estimated ().Footnote3 As can be seen from , the results show certain differences in the external shape of the densities among regions. Densities of SA and EAP are centered around 41 and 42%, MENA around 43 and 45%, and the rest of the regions are centered around 46 and 51%. These characteristics are indicative of the existence of a process of convergence in regional income inequality, mainly due to the performance of regions that are situated at the lower (SA and EAP) and upper end (SSA, LAC, ENA and ECA) of the distribution of income inequality.
Figure 1. Smoothed kernel density estimates for the Gini coefficient across world regions for the full period 2000–2015.Source: generated by author using Gini coefficient data constructed from SWIID dataset.
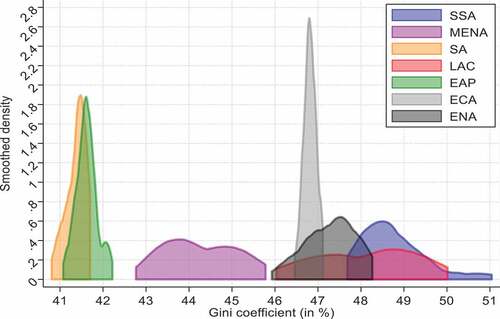
Figure 2. Kernel densities estimates for the Gini coefficient across world regions for the years 2000 and 2015.Source: generated by author using Gini coefficient data constructed from SWIID dataset.
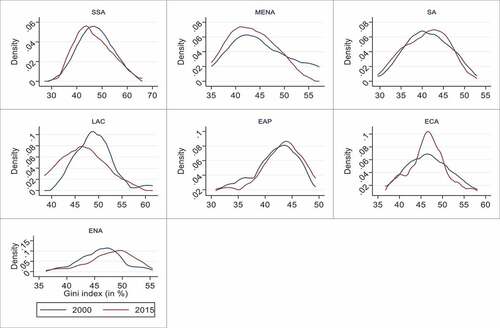
displays the estimated kernel densities for the Gini index for the different world regions in 2000 and 2015. The plot allows to visualise how the distribution of income inequality evolves over these years. It is worth mentioning that the densities of the Gini coefficient move to the left from 2000 to 2015 in the majority of the regions (SSA, MENA, SA, LAC and ECA), which in fact results in a shift in income inequality for the full sample during this time period. For the regions of EAP and ENA, it is observed that the densities moved to the right-hand side during the same period. These shifts in the densities of income inequality for the countries of these regions reinforce the suspicion of existing convergence in income inequality levels across countries as discussed in the introduction.
An alternative way of analysing inequality data in our full sample is the scatter plot presented in . The slope of the fitted line represents the estimated coefficient of an unconditional convergence regression. The estimated coefficient is statistically significant and yields a weak speed of convergence of
=0.01 (1%).Footnote4 This estimate is much smaller than existing empirical evidence on unconditional convergence procedures, with convergence rates close to 2% per annum reported by Ravallion (Citation2003) and 5.3% reported by Chambers and Dhongde (Citation2016). Nevertheless, it is clear from that fitting lines for regions in given countries would disclose faster
convergence, specifically in the case of conditional convergence.
Figure 3. Scatter plot of initial log of inequality and annual growth rate during 2000–2015 period, Num of obs = 142.
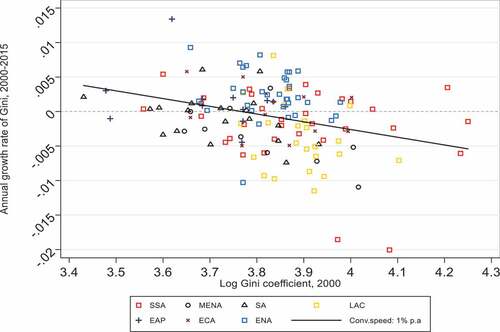
One last observation drawn from the scatter plot is the existence of within-country heterogeneity. For instance, the logarithm of Gini coefficient in 2000 and the subsequent growth rate significantly differ within SSA region. Additionally, the scatter plot reveals that SSA is a specific case due to the fact that the majority all of its country’s observations (except three), are located below the fitted line. This suggests that the average growth rates (−8.60%) for SSA region is situated below the sample average (−3.30%). By contrast, most of the countries’ observations of ENA region are situated above the fitted line, except three. However, it is not clear whether these observations are the result of divergence, weak convergence or transitional dynamics. Hence, a more rigorous analysis that is executed with a more robust methodology is needed for more clarity of this outcomes.
As indicated in section 3.3, after the clubs have been identified, I additionally investigate the factors (determinants) that led to the formation of the clubs. In this regard, I consider different variables such as the initial level of Gini coefficient, the initial level of GDP per capita used as proxy for different levels of development, the ratio physical to human capital accumulation, population density used as a proxy for geographic factors and population growth. I specifically included in the regressions the growth rate of the population as it is shown in the literature that this variable can be a major determinant for clubs’ formations since steady state among nations may differ with different rates of growth of population (Basel et al., Citation2020; Solow, Citation1956). All these variables were used in the ordered logit regressions.
4. Empirical results
4.1. Inequality convergence clubs
In this section, I discuss the empirical results. The analysis follows three key steps. First, I identify the clubs using the Phillips et al. (Citation2007) methodology. Second, I analyse the transitional behavior within the club and across the clubs. Third, I analyze the determinants of club formation. The estimation performed the log t test to the whole panel as across 142 countries for the period 2000–2015, as given in EquationEq. (6)(6)
(6) . I started by ranking countries’ Gini coefficients for the last 5 years (2011 −2015). I defined z as 1/3 as suggested by Phillips et al. (Citation2007).
Thus, the estimation begun from the 6th year (2005) and I obtain 11 observations. To avoid potential inefficiency that would have been generated because of autocorrelation and heteroscedasticity, I utilised Newey and West (Citation1987)Footnote5 method. The results obtained are summarized in . The estimated value of t-statistic is −137.95. This value is far less than the 5% critical value of −1.65 and is statistically significant at the 1% level. Thus, the null hypothesis of global convergence is strongly rejected. This finding shows that income distribution (inequality) among the 142 countries does not converge to a unique transition path. This outcome is different to that of Ravallion (Citation2003), Chambers and Dhongde (Citation2016), and Clark (Citation2019 who used convergence method and reported evidence of convergence in income inequality across countries. Indeed, when one uses
convergence method, it is clear that global convergence is more likely to be reported (also see the results in ). However, as shown in the methodology section,
convergence method yields less accurate results due to Galton’s fallacy and the natural increase in variance (Tian et al., Citation2016).
shows the full-panel relative transition curves for the world, which was computed using the specification in EquationEq. (2)(2)
(2) . These curves present the behaviour/performance of income inequality for all the countries in the sample relative to the panel average. According to theory, if there is global convergence (that is at the world level), the relative transition path tends to equal unity for all countries. On the other hand, if there is club convergence, that is, when a couple of countries converge to different steady-states, the relative transition paths of the members of each club converge to different equilibria. Looking at the full-panel transition paths for the world, it can be observed that countries display significant transition behaviour over the period of the study (2000–2015).
Figure 4. Inequality transition path of the World as a whole.
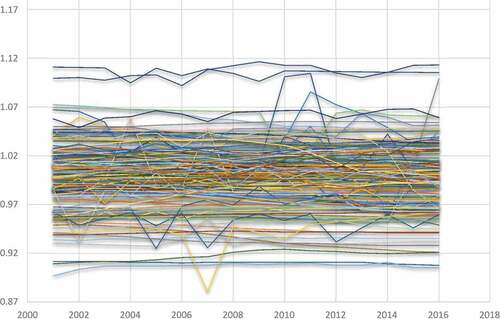
Two types of transition behaviour are observed from . There are countries in the full-sample that present transition paths above 1 and those below 1. This means that the world governments or regions seem to have decided and implemented both similar and dissimilar policies for the distribution of income among individuals. Nevertheless, nonconvergence in the distribution of income (inequality) of the 142 countries does not cast-off the possibility of club clustering or club formation. I therefore investigate the possibility of observing club formation or club clustering using Phillips et al. (Citation2007) club clustering algorithm, results of which are also presented in . Six different clubs were identified to contain countries that converge. I also found one non-convergent group that is constituted by Namibia and South Africa. The fact that these two countries are found diverging from common transition paths of other six clubs is not astonishing, simply because the two countries are among the World most unequal nations in which inequality levels are reported to continuously increase in the recent years. Club 1 is formed by four countries, club 2 by 28 countries and club 6 with five countries. This gives the possibility of forming big clubs that may include more countries. In order to test if there are potential clubs that could be merged, I performed the club merging test. I employed Phillips and Sul (Citation2009) method of club merging. Note that the club merging algorithm for diverging countries do not lead to any amalgamation of clubs clustering. The results of the club merging are also shown in .
Based on the results in , it is evident that the calculated t-statistic on the initial clubs 1 and 2, initial clubs 4 and 5, initial club 5 and 6, as well as on the non-convergent group are smaller in magnitude than −1.645, suggesting that merging of these specific clubs is not doable. In contrast, the calculated t-statistic on the initial clubs 2 and 3, and initial clubs 3 and 4 are greater in magnitude than—1.645. Therefore, I applied merging test and end up with five groups as the final possible clubs registering convergence and one non-convergent group. The results of the final club classification are also contained in . Looking at the estimates of the final club classification, I observe that each of the t-statistic is greater than—1.65, except the non-convergent group. This simply implies the convergence of 140 countries to five different clubs. The calculated value of for all the clubs (club 1 to 5) lies between 0 and 2, suggesting conditional convergence within the club. The calculated value of
for club 4 (
=0.446), club 3 (
=0.391), and club 5 (
=0.375) are the highest among the five converging clubs. Following Phillips and Sul (Citation2009), I conclude that club 4, club 3 and club 5 are stronger convergence clubs compared to club 1 and 2. The calculated speed of convergence in percentage for club 4 is 22.3% (
), for club 3 is 19.5%, and for club 5 is 18.8%. These speed of convergence shows that countries belonging to club 4, 3 and 5 are approaching one another faster in relative terms compared to countries in club 1 with 6.6% and club 2 with 1.1%.
4.2. Explaining inequality transition behavior
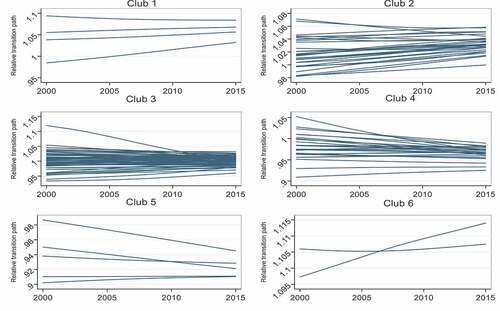
Phillips and Sul (Citation2009) introduced the idea of transition path curve to understand the transition trajectory of different convergent clubs. In this study, I examined the transition path of the six final clubs but also the inside transition path of each country in the club. displays the relative transition paths for countries inside their respective club. The transition path is obtained through the relative transition coefficient , as defined in EquationEq. (2)
(2)
(2) . In other words, this means that the transition path is obtained through the cross-sectional mean of the relative transition paths of the countries of each club. The plot in indicates that the transition paths for all clubs form a funnel, except that of club 6, which is the club where there is no convergence. The pattern of relative transition paths within the clubs is quite heterogeneous, which signifies that the transition and convergence process is different across countries inside a certain club. For instance, the relative time-constant transition paths indicate that countries in club 3, which is the club with the largest number of countries (32 countries), display less strong convergence within their club. Another important point I observed from is that the transition mostly occurred during the period between 2000 and 2009, and contraction of the curves is less visible in the period 2010–2015. The slow pace that is observed in the transition curves during the later period (2010–2015) may possibly be due to the effects of the financial crisis of 2008/09, which are said to have widen inequality between and within countries (Camacho & Palmieri, Citation2019; George et al., Citation2015).
Figure 5. Relative transition path by club during 2000–2015, N = 142.
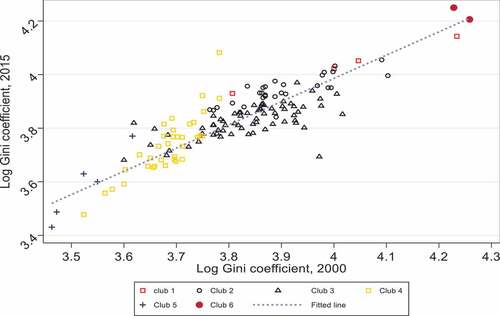
shows club formations in a two-way scatter plot of the logarithm of the Gini coefficient in 2000 compared to that of the Gini coefficient in 2015. Note that the distance separating each data point and the fitted linear line represents the mean growth rate of the Gini coefficient over the period 2000–2015. As can be seen from this figure, clubs are vertically staggered according to their inequality levels. Countries that belong to higher-inequality convergence clubs also have higher income inequality growth rates on average (these are countries that had low initial inequality). On the other hand, countries that had high-income inequality levels in 2000 also had lower growth rates of Gini coefficient within the clubs. These findings suggest the existence of catch-up effects in the sense that countries converge to different steady states. Furthermore, the figure also displays a horizontal order of clubs. The lower/higher is the level of income inequality in 2000, the lower/higher is the income inequality convergence club on average (see club 3, 4 and 5). This obviously is additional evidence of the club convergence hypothesis. Lastly, shows the process of within-club convergence depicted in . Inequality inside each club is relatively lower in 2000 than in 2015. For example, the Gini coefficient (in logarithm) for club 4 lies between 3.5 and 3.8 in 2000, but increasing to the range 3.5–4.1 in 2015.
Figure 6. Scatter plot of club formation, N = 142.
4.3. Explaining between and within-club inequality behaviour
I followed Tian et al. (Citation2016) approach to analyse and explain the between and within-club income inequality behaviour during the period 2000–2015. Phillips et al. (Citation2007) club convergence algorithm shows that the limit of income inequality indices of all member countries in the same club equals to 1, suggesting that the long-run steady state level will be identically reached by all club members. In terms of income distribution, the highest income inequality index in each club was used as the potential inequality level for the club to measure the between and within-club income inequality behaviour. I began by measuring the between-club income inequality behaviour. For this I focused on club 3 and 4 as these two have the fastest convergence rates among the converging clubs. I used the ratio of the mean Gini coefficient in the two clubs (solid black line) and the ratio of the potential Gini coefficient in the two clubs (solid gray line).Footnote6 As can be seen from , both indicators exhibit different fluctuations in the late 1990s and the early 2000s (for the ratio of mean Gini, the fluctuation is are around 1.10 and for the ratio of potential Gini, the fluctuation is around 0.93). Around this period, the later increases and peaks at approximately 1.12 in the end 2004, while the former increases significantly since 2000 and reach at approximately 1.26 in 2003 before declining to 1.12 in the end 2004. Then, both indicators follow an upward trend after 2004, suggesting increasing income inequality within the two clubs. Moreover, the figure reveals that the later becomes much higher than the former after 2010, indicating that income inequality between clubs rises sharply if all regions reach their own steady state levels.
Figure 7. Trend of between- and within-club inequality.
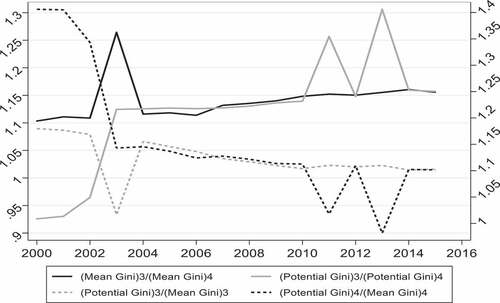
The final step was to measure the within-club income inequality behaviour. To do this I calculated the ratio of the potential Gini coefficient (highest Gini coefficient in each club) to the mean Gini coefficient for each club. The results indicated that the ratio of club 3 steadily declined from 1.10 to 0.94 between 2000 and 2003, while the ratio of club 4 declined from 1.40 to 1.05 between 2000 and 2003. After this period, both indicators continued to decrease, indicating a significant reduction in income inequality within clubs over the years.
4.4. Convergence factor testing
In Section 2.3, I introduced the ordered logit model to examine the determinants of club clustering. (in the appendix) presents a summary statistic of the variables employed in the ordered logit regression. It is worth noting that the variables included in the estimations were essentially due to the availability of the data. However, a close look at these variables indicates substantial variations among the 5 clubs. In the case of club 3 and 4 for example, the average value of initial Gini is 46.92%, while that of club 4 is 41.14%. The average initial per capita GDP, which is used to compare the level of development between countries, is U. S dollars 12,645.63 in club 3 and 6144.09 in club 4. The average population growth rate also differs significantly across countries of the clubs. In club 3, this rate increases at only 1.2% per year, while that in the club 5 increases at almost 2% per year. The increase in the ratio physical to human capital during 2000–2015, is 143% in club 3 and 230% in club 5. Moreover, the population density which is used as a measure of geographic factors is on average 334 people per square meter in club 3, while that of club 4 is 182 people per square meter.
reports the results of our calculated marginal probabilities for the model. Note that the categorical variable “club membership” is the dependent variable for this regression and varies from 1 to 5. Overall, the pattern for the results shows that initial income inequality and initial per capita GDP, are significant drivers of club membership in 2 clubs (club 2 and 4), while these variables do not have any significant effect on club formation in 3 clubs (club 1, 3 and 5). The interpretation of this result is that an increase of a 1% of the initial Gini coefficient in 2000 increases a country’s probability of belonging to club 2 by 8.97% (column 2) and decreases a country’s probability of belonging to club 4 by 48% (column 4). The results with respect to the ratio physical to human capital are also informative. They indicate that this ratio is an important determinant of countries converging into club 2, 3 and 4 only. An increase of a one-unit in the ratio physical to human capital increases a country’s probability of joining club 2, 3 and 4 by 5, 11 and 4.6%, respectively. For the 2 other clubs (club 1 and 5), this variable seems to do not have any significant impact.
Table 5. Determinants of club convergence, 2000–2015
Other interesting results are those of population growth and population density. For the case of population growth, it is found that this variable determines the possibility of countries not joining club 2, 3 and 4. Most particularly, an increase in the population growth rate decreases the likelihood of countries to converge into the income inequality steady state of club 2 by 30%, club 3 by 14% and club 4 by 12%. Furthermore, an increase in the population density by one more person reduces the likelihood of countries to converge into club 1, 4 and 5, respectively, by 53, 19 and 53%. On the other hand, an increase in the population density by one more person increases the likelihood of some countries to converge into club 2 by 25% and club 3 by 9%. This finding simply indicates that the structure of the population plays a significant role for countries converging into income inequality club. In sum, through the findings of our regressions, I conclude that population growth rate, population density and the ratio physical to human capital are key driving forces of income distributions divergence across countries. These findings are consistent with the prediction of Solow (Citation1956) model. Thus, cross-country central governments should urgently define common policies that specifically target to stabilise the current trends in the population growth. More specifically, policies that aim at reducing the population in countries with high growth rate should be urgently define as this may increase the likelihood of countries converging into different inequality convergence clubs.
5. Summary and conclusion
Numerous versions of neoclassical models predict that, in the long-run, income inequality will tend to decline in highly unequal countries and increase in low-income inequality countries. However, recent trends of income inequality since the 1990s show that income inequality is indeed increasing in high and middle-income countries and decreasing in low-income countries. This observation is increasingly becoming a subject of empirical investigation in the world of academics. Do relative income inequalities across countries tend to converge to a common steady state over time?
A growing number of studies attempt to answer the above question using specific-country cases and reach to conclusion indicating that income inequality does converge within a country over time (see, Marina, Citation2000; Panizza, Citation2001; Goerlich & Mas, Citation2004; Gomes, Citation2007; Kosfeld et al., Citation2006; Christopoulos & Tsionas, Citation2007; Ezcurra & Pascual, Citation2009; Lin & Huang, Citation2011; Tian et al., Citation2016;; Apergis et al., Citation2018). Empirical evidence on cross-country case studies also exists but are few. The majority of those studies answer this question by using traditional methods such as and
convergence methods. The findings from those studies indicate that income inequalities also converge across countries of the world. Despite this conclusion, it is worth nothing that the methods used to examining convergence are shown to produce inaccurate results due to Galton’s fallacy of regression to the mean (Lau, Citation2010) and several other reasons that I presented in the introduction of this study. Hence, this current study provided new evidence regarding the convergence in countries’ income inequalities (Gini coefficients) at the world level from the period of 2000 to 2015.
To answer the question of whether relative income inequalities across countries and over time tend to converge to a common steady state, this study adopted a nonlinear time-varying factor model and the log t test proposed by Phillips et al. (Citation2007). This methodological approach proceeded by examined whether the transition coefficient (), which determines the distance to a common inequality steady state (
), converges toward the panel mean (
) as
. Contrary to
and
convergence methods, the procedure of Phillips et al. (Citation2007) allowed us not only to capture transitional heterogeneity, but also divergence from the actual inequality path. Additionally, I utilised the Phillips et al. (Citation2007) club clustering algorithm, which enabled us to group countries into different convergence clubs based on the results of the log t test. Our main results indicate the absence of convergence in inequality at the world level. Instead, our empirical analysis found that cross-country income inequalities converge into 5 different convergence clubs. Most specifically, I found that income inequality of 140 countries (check ) were converging into 5 different steady states of inequality over the period 2000–2015 and that of 2 countries (South Africa and Namibia) were diverging. This finding revealed two things: (1) the lack of uniform income distribution policy for the world as a whole—(2) countries are implementing more than 5 different distribution policies, leading to different steady states of income distribution. This conclusion is supported by the finding of different speed of convergences as reported in . An extended analysis of inequality transition path revealed that between-clubs’ inequality was increasing, while within-club was declining over time.
Finally, I took a step further to investigate possible approaches to alleviate the inequality gap between clubs. To this end, I investigated the determinants of club convergence using an ordered response regression framework. The underlying preoccupations were to analyse the effectiveness of some selected macroeconomic variables in determining a country’s membership in a given club. Our results indicate that population growth rate, population density and the ratio physical to human capital are the major factors that determine club membership. Most specifically, I found that high population growth rate reduces the possibility of converging into club 2, 3 and 4. An increase in population density was found reducing the possibility of joining club 1, 4 and 5, and at the same time, it was increasing the possibility of converging into club 2 and 3. Moreover, An increase in the ratio physical to human capital was found associated with more possibility of converging into club 2, 3 and 4. As a way to narrow countries income distributions gap, I now propose to central governments, especially those of African countries to urgently put in place common policies that aim at controlling the population in countries with high growth rate as this may increase the likelihood of countries converging into different income inequality convergence clubs. The population control policy may produce significant results in terms of poverty and income inequality in Africa. Moreover, policymakers should continue to accomplish or aim at achieving and attaining high ratio of physical to human capital and this by accelerating political and economic reforms that fever cross-country flow of capital. I also recommend that policymakers, especially those from the multilateral organisations, should harmonise the distributional policy to reduce the between countries inequality.
In light of a convergence club that covers both developing and developed countries with similar Gini levels, it is essential to mention that this current study treated the grouping based on the average Gini. Some countries with a low level of development were found grouped into the same clubs as countries with a high level of development. All the clubs I identified do not mean the same level of development. Thus, policymakers should be cautious in implementing policies to reduce inequality across the different countries. Another limitation of this study is that I did not explore the dynamic issue of income inequality, which is crucial as it is possible to have movements between the clubs. Future studies are therefore encouraged to explore the dynamics of income inequality in relation to different club clustering.
Opposing interest
The School of Economics and Econometrics of the University of Johannesburg had no role in the design of the study; in the collection, analyses, or interpretation of data; in the writing of the manuscript, and in the decision to publish the results.
Disclosure statement
No potential conflict of interest was reported by the author.
Additional information
Funding
Notes on contributors
Delphin Kamanda Espoir
Delphin Kamanda Espoir is a lecturer at the School of Economics at the University of Johannesburg. He received his PhD in Economics in 2021 from the University of Johannesburg, South Africa. The author does research in various areas such as: Growth and Development Economics, International Trade and Regional Economic Communities, Energy and Environmental Economics.
Notes
1. The SWIID is a cross-sectional time-series data that was produced by Solt for the first time in 2009. it contains comparable Gini indices of disposable and market income inequality for more than 190 countries for a period starting from 1960 to the present. More details regarding the SWIID are provided in the data section an at: https://fsolt.org/swiid/
2. Although the -convergence and
-convergence methods are now less employed in studies that are more robust to the analysis of convergence, the two methods can still be used as benchmark. This allows to compare the results obtained by robust econometric methods such as the Log t test.
3. Our estimation procedure used the Epanechnikov kernel functions in all the calculations. The smoothing parameter was determined following the methodology of Silverman (1986).
4. Beta convergence is evident when countries with high initial inequality register smaller increases (or larger decreases) in inequality, while countries with low initial inequality register a greater increase (or smaller decrease) in inequality.
5. Newey and West (Citation1987) method was employed with the rule of a log order L ==
=2
6. Note that the potential Gini coefficient for club 3 was found within Panama (mean Gini of 52.58%), while the potential Gini coefficient for club 4 was found within Burkina Faso (mean Gini of 47.53).
References
- Abramovitz, M. (1986). Catching up, forging ahead, and falling behind. The Journal of Economic History, 46(2), 385–32. https://doi.org/10.1017/S0022050700046209
- Alvaredo, F., & Gasparini, L. (2015). Recent trends in inequality and poverty in developing countries. In A. Atkinson, and F. Bourguignon (Eds.), Handbook of income distribution (Vol. 2 (Elservier), pp. 697–805).
- Apergis, N., Christou, C., Gupta, R., & Miller, S. M. (2018). Convergence in income inequality: Further evidence from the club clustering methodology across states in the U.S. International Advances in Economic Research, 24(2), 147–161. https://doi.org/10.1007/s11294-018-9675-y
- Azariadis, C. (1996). The economics of poverty traps part one: Complete markets. Journal of Economic Growth, 1(4), 449–486. https://doi.org/10.1007/BF00150197
- Barro, R. J., Sala-I-Martin, X., Blanchard, O. J., & Hall, R. E. (1991). Convergence across states and regions. Brookings Papers on Economic Activity, 1991(1), 107–182. https://doi.org/10.2307/2534639
- Bartkowska, M., & Riedl, A. (2012). Regional convergence clubs in Europe: Identification and conditioning factors. Economic Modelling, 29(1), 22–31. https://doi.org/10.1016/j.econmod.2011.01.013
- Basel, A., Gopakumar, K. U., & Rao, R. P. (2020). Testing club convergence of economies by using a broad-based development index. GeoJournal. https://doi.org/10.1007/s10708-020-10198-0
- Bénabou, R. (1996). Inequality and growth. In B. Bernanke & J. J. Rotemberg (Eds.), NBER macroeconomics annual 11 (pp. 11–73). MIT Press.
- Bleaney, M., & Nishiyama, A. (2003). Convergence in income inequality: Differences between advanced and developing countries. Economics Bulletin, 4(22), 1–10. http://www.accessecon.com/pubs/EB/2003/Volume4/EB-03D30002A.pdf
- Camacho, M., & Palmieri, G. (2019). Do economic recessions cause inequality to rise? Journal of Applied Economics, 22(1), 304–320. https://doi.org/10.1080/15140326.2019.1620982
- Chambers, D., & Dhongde, S. (2016). Convergence in income distributions: Evidence from a panel of countries. Economic Modelling, 59 (C) , 262–270. https://doi.org/10.1016/j.econmod.2016.07.019
- Christopoulos, D. K., & Tsionas, E. G. (2007). Are regional incomes in the USA converging? A non-linear perspective. Regional Studies, 41(4), 525–530. https://doi.org/10.1080/00343400601120254
- Clark, R. (2019). The Goldilocks effect: Convergence in national income distributions, 1990–2015. Social Science Research, 79, 141–159. https://doi.org/10.1016/j.ssresearch.2019.01.003
- Dabla-Norris, E., Kochhar, K., Ricka, F., Suphaphiphat, N., & Tsounta, E. (2015). Causes and consequences of income inequality: A global perspective. IMF, Strategy, Policy, and Review Department https://www.imf.org/external/pubs/ft/sdn/2015/sdn1513.pdf.
- Dhongde, S., & Miao, X. (2013). Cross-country convergence in income inequality. Working Papers 290, ECINEQ, Society for the Study of Economic Inequality.
- Espoir, D. K., & Ngepah, N. (2021a). Income distribution and total factor productivity: A cross-country panel cointegration analysis. GeoJournal, 86(6), 2607-2638., 18(), 2607–2638. http://10.1007/s10708-020-10215-2
- Espoir, D. K., & Ngepah, N. (2021b). The effects of inequality on total factor productivity across districts in South Africa: A spatial econometric analysis. GeoJournal, 86(6), 2607–2638. https://doi.org/10.1007/s10708-020-10215-2
- Ezcurra, R., & Pascual, P. (2005). Is there convergence in income inequality levels among the European regions? Applied Economics Letters, 12(12), 763–767
- Ezcurra, R., & Pascual, P. (2009). Convergence in income inequality in the United States: A nonparametric analysis. Applied Economics Letters, 16(13), 1365–1368. https://doi.org/10.1080/13504850701439319
- Francis, D., Valodia, I., & Webster, E. (2020). Politics, policy, and inequality in South Africa under COVID-19. Agrarian South: Journal of Political Economy, 9(3), 342–355. https://doi.org/10.1177/2277976020970036.
- Galor, O. (1996). Convergence? Inferences from theoretical models. The Economic Journal, 106(437), 1056–1069. https://doi.org/10.2307/2235378
- George, M., Stergios, A., & Dimitrios, K. (2015). The economic crisis (2008) and effects on income. The case of Greece. Procedia Economics and Finance, 19, 27–38. https://doi.org/10.1016/S2212-5671(15)00005-2
- Goerlich, F. J., & Mas, M. (2004). Three (marginal?) questions regarding convergence. Journal of Economic Studies, 31(1), 25–38. https://doi.org/10.1108/01443580410516242
- Gomes, F. (2007). Convergence in income inequality: The case of Brazilian municipalities. Economics Bulletin, 15(15), 1–9 http://www.accessecon.com/Pubs/EB/2019/Volume39/EB-19-V39-I1-P17.pdf.
- Ivanovski, K., Churchill, S. A., & Inekwe, J. (2020). Convergence in income inequality across Australian states and territories. Social Indicators Research, 148(1), 127–142. https://doi.org/10.1007/s11205-019-02201-0
- Kosfeld, R., Eckey, H.-F., & Dreger, C. (2006). Regional productivity and income convergence in the unified Germany, 1992–2000. Regional Studies, 40(7), 755–767. https://doi.org/10.1080/00343400600959322
- Lau, C. K. M. (2010). New evidence about regional income divergence in China. China Economic Review, 21(2), 293–309. https://doi.org/10.1016/j.chieco.2010.01.003
- Lichtenberg, F. R. (1994). Testing the convergence hypothesis. The Review of Economics and Statistics, 76(3), 576–579. https://doi.org/10.2307/2109982
- Lin, P. C., & Huang, H. C. (2011). Inequality convergence in a panel of states. The Journal of Economic Inequality, 9(2), 195–206. https://doi.org/10.1007/s10888-010-9141-4
- Lin, P. C., & Huang, H. C. (2012). Convergence in income inequality? Evidence from panel unit root tests with structural breaks. Empirical Economics, 43(1), 153–174. https://doi.org/10.1007/s00181-011-0482-z
- Mankiw, N. G., Romer, D., & Weil, D. N. (1992). A contribution to the empirics of economic growth. The Quarterly Journal of Economics, 107(2), 407–437. https://doi.org/10.2307/2118477
- Marina, A. (2000). Economic convergence of the first and second moment in the provinces of Argentina. Estudios de Economía, 27(2), 259–277 https://econ.uchile.cl/uploads/publicacion/d06b060b-c225-4a11-9231-786753fc8fa0.pdf.
- Newey, W.K., & West, K.D. (1987). A Simple, Positive Semi-Definite, Heteroskedasticity and Autocorrelation Consistent Covariance Matrix. Econometrica, 55(3),703–708. https://doi.org/10.2307/1913610.
- Panizza, U. (2001). Convergence in income inequality. Journal of Income Distribution, 10(1–2), 5–12. https://doi.org/10.25071/1874-6322.1276.
- Pesaran, M. H. (2007). A simple panel unit root test in the presence of cross-section dependence. Journal of Applied Econometrics, 22(2), 265–312. https://doi.org/10.1002/jae.951
- Phillips, P. C. B., Sul, D., Beck, H. P., Wahlgren, M., & Lutz, H. U. (2007). Transition modeling and econometric convergence tests econometrics. Infection and Immunity, 75(6), 1771–1885. https://doi.org/10.1128/IAI.01514-06
- Phillips, P. C., & Sul, D. (2007). ‘Transition modeling and
- Phillips, P. C., & Sul, D. (2009). Economic transition and growth. Journal of Applied Econometrics, 24(7), 1153–1185. https://doi.org/10.1002/jae.1080
- Rattsø, J., & Stokke, H. (2014). Regional convergence of income and education: Investigation of distribution dynamics. Urban Studies, 51(8), 1672–1685. https://doi.org/10.1177/0042098013498625
- Ravallion, M. (2003). Inequality convergence. Economics Letters, 80(3), 351–356. https://doi.org/10.1016/S0165-1765(03)00141-1
- Royuela, V., & Garcia, G. A. (2015). Economic and social convergence in Colombia. Regional Studies, 49(2), 219–239. https://doi.org/10.1080/00343404.2012.762086
- Soete, L. (1985). International diffusion of technology, industrial development and technological leapfrogging. World Development, 13(3), 409–422. https://doi.org/10.1016/0305-750X(85)90138-X
- Solow, R. M. (1956). A contribution to the theory of economic growth. The Quarterly Journal of Economics, 70(1), 65–94. https://doi.org/10.2307/1884513
- Swan, T. W. (1956). Economic growth and capital accumulation. Economic Record, 32(2), 334–361. https://doi.org/10.1111/j.1475-4932.1956.tb00434.x
- Temple, J. (1999). The new growth evidence. Journal of Economic Literature, 37(1), 112–156. https://doi.org/10.1257/jel.37.1.112
- Tian, X., Zhang, X., Zhou, Y., & Yu, X. (2016). Regional income inequality in China revisited: A perspective from club convergence. Economic Modelling, 56, 50–58 doi:10.1016/j.econmod.2016.02.028.
- Tselios, V. (2009). Growth and convergence in income per capita and income inequality in the regions of the EU. Spatial Economic Analysis, 4(3), 343–370. https://doi.org/10.1080/17421770903114711
- United Nations Development Programme. (2013). Humanity divided: Confronting inequality in developing countries. Bureau for Development Policy.
- United Nations World Social Report (2020). Inequality in a rapidly changing World. Department of economic and social affairs. https://www.un.org/development/desa/dspd/wp-content/uploads/sites/22/2020/02/World-Social-Report2020-FullReport.pdf
- Von Lyncker, K., & Thoennessen, R. (2017). Regional club convergence in the EU: Evidence from a panel data analysis. Empirical Economics, 52(2), 525–553. https://doi.org/10.1007/s00181-016-1096-2
Appendix
1. Club merging algorithm
The critical value C plays a significant role in identifying the number of clubs in a given sample group. If C is high, this may correspond to conservative sieving for further club members. Thus, this will tend to overestimate the number of clubs than what it should actually be. In order to reduce this risk, Phillips and Sul (Citation2009) proposed log t tests for adjacent clubs after the initial club clustering have been identified. If > − 1.645, the respective clubs are merged at the 5% level of significance. If the null is not rejected, the corresponding clubs can be merged into a larger club. Thus, an alternative hypothesis can be considered as follows:
and
are number of individuals and aggregates to N.
One can also extend the specification in (11) for the case of multiple clubs, which can provide the following relative transition coefficient:
=
, (12)
and
=
, (13)
For all 0, 1 and
, and I finally arrive at a log t regression specification in the form of EquationEq. (8)
(8)
(8) .
The use of the above procedure enabled me to test the club convergence or divergence in inequality across countries.
2. Club descriptive statistics