
 ?Mathematical formulae have been encoded as MathML and are displayed in this HTML version using MathJax in order to improve their display. Uncheck the box to turn MathJax off. This feature requires Javascript. Click on a formula to zoom.
Abstract
This paper analyzes the impact of US firms’ equity risk on bank lending standards and on the macroeconomy for two groups: small and medium-large firms. The results indicate that a higher level of firm risk leads to a higher percentage of banks tightening their lending standards on commercial and industrial (C&I) loans, with a much larger effect for medium-large firms. The finding provides support for the Risk Management Hypothesis, under which banks decrease lending to risky borrowers to reduce credit risk. In addition, we found a one-for-one relationship between firm equity risk and C&I loan spread, signaling the channel of how firm risk transfers through the banking system to the rest of the economy. Finally, the impacts of an increase in firm risk on bank lending standards and the economy are amplified in a recession compared to an expansion.
PUBLIC INTEREST STATEMENT
The paper attempts to explain the relationship between credit risk of firms, the possibility of a loss resulting from a firm’s failure to repay a loan, and bank lending practices. To measure risk, we use firm equity risk, which is derived from a firm’s stock returns. By construction, equity risk reflects volatility in a firm’s stock price, signaling its future cash flow and ability to repay debt. We then integrate the risk measure with bank lending standards and other key macroeconomic variables to study the channel of how firm risk transfers through the banking system to the rest of the economy. We apply a Factor-Augmented Vector Autoregressive (FAVAR) model to count for the large data set and endogeneity. We found that a higher level of firm risk leads to a higher percentage of banks tightening their lending standards on business loans. In addition, firm risk has a direct impact on borrowing rates, affecting GDP and investment as a result.
1. Introduction
Banks are an important channel of funds for firms, especially for those with limited or no access to capital markets. At the same time, credit risk, the risk of borrowers defaulting on their debt, is responsible for nearly half of the total bank risk compared to other risks, such as operational and market risk (Kuritzkes & Schuermann, Citation2010). In addition, among financial instruments, loans account for the largest component of credit risk in commercial bank activities. Thus, measuring and managing credit risk associated with business loans is one of the primary concerns for banks. The 2008 financial crisis also showed that bank risk from different financial instruments can quickly transmit to each other, affecting bank balance sheets and sending shock waves to the rest of the economy.
Lending standards are a direct measure of credit conditions, and they move closely with credit risk and the business cycle. During recessions, the level of credit risk peaks. As a result, the number of banks tightening their lending standards increases rapidly (Becker & Ivashina, Citation2014). For example, 75 percent of major banks reported scaling back their lending to businesses in 2008. This paper uses firm equity risk as a measure of credit risk associated with business lending. It aims to provide an extensive analysis of the links among firm risk, bank lending standards, and the macroeconomy for the period from 1991Q1 to 2016Q4. Data on bank lending standards are available for two groups of firms: medium-large whose total sales are greater than 50 million dollars and small otherwise. As a result, we classify a data set of over 30,000 firms into these two groups.
Firm equity risk is calculated as the standard deviation of the residual estimated from the regression of firms’ daily stock returns on daily market returns. Next, the firm equity risk index for each group is constructed and analyzed together with over 50 macroeconomic and financial time series using a Factor-Augmented Vector Autoregressive (FAVAR) model. Additionally, we use loan spread, difference between the interest rates on C&I loans and the federal funds rate, to study the channel of how equity risk is transmitted through bank lending to the rest of the economy. Finally, we examine the potential impact across recession and expansion phases in order to take into account business cycle risk.
A plethora of papers have focused on either the relationship between firm risk and bank lending standards at the micro level or the relationship between lending standards and the economy at the macrolevel. However, to our knowledge, no research has been done on how firm risk affects bank lending standards and the macroeconomy. How important is firm risk in determining banks’ decisions to tighten or ease their lending standards? What role does it play in economic activities, monetary aggregates, and financial markets? The goal of this paper is to provide answers to these questions.
This paper contributes to the literature on economics and finance in three ways. This is the first paper investigating the channel of how firm risk affects bank lending standards and the macroeconomy. Given the critical role this risk may play in goods markets and financial markets, it is important for central banks, commercial banks, and firms to understand the mechanism through which risk is transferred from firms to the economy. Second, most papers in closely related literature use firm nonperforming loans or aggregate indexes, such as the VIX, to measure credit risk. This paper uses firm equity risk instead, which is calculated as the standard deviation of the error term in the regression of a firm’s daily stock returns on market returns. By construction, equity risk reflects volatility in a firm’s stock price. Thus, firms with high levels of equity risk signal unstable future cash flows, having lower abilities to service their debts. This measure of firms’ credit risk is better than nonperforming loans for a couple of reasons. Information on nonperforming loans is backward-looking as it reflects a firm’s past performance. Thus, firms without a history of nonperforming loans do not necessarily imply that they are currently low risk. Equity risk, on the other hand, contains forward-looking information about a firm since stock returns reflect investors’ expectations about a firm’s future performance. As a result, equity risk is more suited for calculating the likelihood that a firm might default on its debt. Another rationale for choosing firm equity risk is that stock returns have been shown to be related to economic activities (Fama, Citation1981; Jones et al., Citation2017; Lee, Citation1981). Finally, my constructed index is better than aggregate ones as the former captures idiosyncratic risk of firms, while the latter are mainly driven by market risk.
Finally, this is the first paper employing a FAVAR model to gauge the interactions among firm risk, bank lending standards, and the rest of the economy. We collect and treat a large amount of data at the microlevel on firms and compare it with a number of economic time series at the macro level. Consequently, traditional VAR models cannot be applied in this analysis. Bernanke et al. (Citation2005) point out that FAVAR models are superior to VAR models in macroeconomic studies because they overcome VAR’s biggest weakness related to the curse of dimensionality. While previous studies in the related literature include fewer than eight variables in their VAR models, this paper uses information on thousands of firms and 55 macroeconomic and financial time series over 25 years. The inclusion of variables containing information about the economy can mitigate the dimension problem that commonly occurs in the traditional VAR method.
The main results of this paper are as follows: First, a one-standard deviation increase in firm risk causes more banks to significantly tighten their lending standards to both groups of firms, medium-large and small. However, the effect for the former group is twice that for the latter group. The finding lends support to the Risk Management Hypothesis, under which banks decrease lending to risky borrowers to reduce credit risk. Second, we find the existence of the risk transferring channel from firms to the rest of the economy through interest rates on C&I loans. A higher equity risk measure leads to tightened credit by banks, a rise in the loan spread, and hence, a decline in investment, real GDP, and employment. The corporate bond risk premium, measured by the yield spread between BAA and AAA corporate bonds, increases with a positive shock in firm risk. Additionally, the slope of the yield curve (the yield spread between 10-year Treasury bonds and three-month Treasury bills) increases with an unexpected increase in firm risk. Finally, the impact of an increase in firm risk on bank lending practices and the macroeconomy is larger during recessions than in expansions for both medium-large and small firms. Conditional on bank size, we find that small banks are more reluctant to tighten their lending during expansions compared to big banks, especially to small firms. These findings shed light on how firm equity risk affects credit availability to businesses and on how banks’ risk appetite changes over business cycles.
The rest of this paper is organized as follows: Section 2 reviews the related literature. Section 3 introduces the econometric framework of the FAVAR model. Section 4 describes the data, and Section 5 discusses the estimated results. Finally, Section 6 concludes.
2. Survey of related literature
There is extensive literature on the relationships among credit risk, bank lending practices, and the macroeconomy. The one strand of literature uses microlevel data on firms and banks to investigate the effect of firm risk and monetary policy risk on bank lending. It argues that banks lending money to firms is subject not only to firm characteristics but also to changes in monetary policy conducted by central banks. During an expansionary monetary policy when interest rates are low, banks have incentive to seek high-yielding assets, engaging in riskier investments. The mechanism in which banks are more willing to grant loans to risky firms due to a lax monetary policy is called the risk-taking channel of monetary policy (Borio & Zhu, Citation2012).
Most notably, Jimenez et al. (Citation2014) use a comprehensive set of firm and bank-level data on loan applications and outcomes for Spanish firms from 2002 to 2009. The authors apply a two-stage model, where in the first stage, the dependent variable is equal to one if a firm receives a loan and zero otherwise. In the second stage, the dependent variable is the amount of the loans granted to firms in stage one. Firm risk is measured as the number of firm nonperforming loans over the sample time period. A number of interaction terms of monetary policy (proxied by the Euro Overnight Index Average rate) with firm risk and bank capital are included in each stage. Jimenez et al. (Citation2014) find that when the overnight interest rate is low, more loans are granted to risky firms. Controlling for bank capital, they conclude that low-capital banks are more willing to provide loans to risky firms given a low interest rate. The results confirm the existence of the risk-taking channel of monetary policy in bank lending activities. The findings of their paper are in line with other articles in the literature that also use micro-level data on firms, banks, and interest rates (Behr & Guttler, Citation2007; Bruno & Shin, Citation2015; Demiroglu et al., Citation2012; Gambacorta, Citation2009; Keeton, Citation1999). However, the analysis of Jimenez et al. (Citation2014) stands out due to its incorporation of all micro information on firms, banks, and monetary conditions in a single economic model.
Another strand of literature collects macrolevel data on bank lending standards and the economy to analyze their interrelationships. The standard VAR framework is employed in most studies. Lown et al. (Citation2000) investigate the impact of bank lending standards on macroeconomic variables. The authors use the percentage of banks tightening their lending standards on commercial and industrial (C&I) loans drawn from the Federal Reserve’s Senior Loan Officer Opinion Survey (SLOOS). Other macroeconomic variables, real GDP, GDP deflator, commodity price, and the FFR are also included in the VAR model. The authors find that a tightening shock in lending standards decreases real GDP and the FFR. The result implies that when banks decrease their credit supply, the economy slows down, leading the Federal Reserve to lower the FFR to spur economic growth.
Lown and Morgan (Citation2006) study the connection between credit cycles and bank lending standards. The volume of commercial loans at banks and the net percentage of banks tightening their lending standards are used to model credit cycles. The authors find that the feedback of loans to shocks in lending standards reveals a credit cycle. A higher amount of loans leads to tighter lending standards. In return, tighter lending standards result in fewer loans, causing lending standards to ease and the number of loans to increase extensively.
Bassett et al. (Citation2014) argue that the percentage of banks tightening their lending standards taken from the SLOOS might not be an accurate measure of changes in credit supply since part of the changes might come from demand for loans and other macroeconomic factors. As a result, the authors use data on banks, loans, and bank lending standards to construct an index for changes in credit supply. Applying a VAR model, Bassett et al. (Citation2014) find that a tightening shock in lending standards decreases real GDP and the FFR. These effects are more substantial compared to those in Lown et al. (Citation2000), which use the original data on changes in lending standards from the SLOOS.
This study fills the gap in the literature by analyzing the relationships among firm risk, bank lending standards, and the marcoeconomy to a gain better understanding of how firm risk influences business lending and the rest of the economy.
3. Theoretical framework of a structural FAVAR model
3.1. Model setup
Let be an
vector of observable economic variables and
be an
vector of latent factors. Assume that
and
follow a VAR model,
where is a matrix of coefficients and
is an error term with mean zero and covariance matrix
. Since the latent factors
are not observable, EquationEquation (1)
(1)
(1) cannot be estimated. The FAVAR model further assumes that there exist
observable informational time series
that can be used to extract the latent factors
.
is assumed to be large and much larger than the total number of factors and observable variables,
. Suppose
is related to
and
by a factor model,
where is an
matrix of factor loadings,
is an
matrix, and
is an
matrix of idiosyncratic errors. The error terms
are assumed to have mean zero and be weakly correlated. The latent factors
capture the information in some important structural shocks to the economy. These shocks are represented by a large number of macroeconomic series. Thus, by including a significantly larger amount of variables, the FAVAR model can solve VAR’s mismeasurement problem.
3.2. Model identification
Model (1)-(2) cannot be identified without imposing further restrictions. The number of restrictions needed can be estimated by rewriting the model as
where is an invertible
matrix and
is an
matrix. The number of restrictions imposed on the FAVAR model is equal to the number of free parameters of
and
, which is
(Bai et al., Citation2016).
Bernanke et al. (Citation2005) introduce an identification scheme by partitioning all variables into three groups: slow moving variables, the policy variable, and fast moving variables. Based on this method, within a period, the structural shocks in the slow group can affect all the variables. The structural shock in the policy variable affects all but slow moving variables. Finally, the structural shocks in the fast group affect only the remaining fast variables.
3.3. Model estimation
Models (1) and (2) can be estimated using a two-step principal components method as in the standard FAVAR literature. The first step involves obtaining an estimate of the latent factors, . The unobservable common components,
from all variables in
are estimated using the first
principal components of
. The number of factors,
is determined according to the information criteria
,
, and
proposed by Bai and Ng (Citation2002). Using an asymptotic principal component analysisFootnote1 (Stock & Watson, Citation2002), the latent factors,
can be estimated by removing
from
. To achieve this, all variables in
are divided into two groups, slow-moving variables and fast-moving variables. The policy variable is included in
. The slow common factors,
are extracted from the slow-moving variable group and estimated using the principal components analysis. Next, the following equation is estimated:
Thus, the estimated latent factors are
. In the second step,
is replaced by
in EquationEquation (1)
(1)
(1) to obtain the estimates of the FAVAR model. The policy rate is ordered last in the VAR framework assuming that the latent factors do not contemporaneously respond to shocks in the policy variable. This assumption is reasonable given that the latent factors obtained from the first step mainly contain information in the slow-moving variables. The number of lags in the VAR model is determined using the Akaike information criterion.
4. Data
The data on firm risk, changes in bank lending standards, and other macroeconomic variables are constructed quarterly from 1991Q1 to 2016Q4. The starting point of the dataset is determined by the availability of data on bank lending standards. For identification purposes in the FAVAR model, we follow Bernanke et al. (Citation2005) and divide all time series into three different blocks: slow-moving variables, policy variable, and fast-moving variables. The policy variable is the constructed firm equity risk index. The main variable of interest, changes in lending standards, is placed in the fast-moving variable block as banks can observe information on key economic indicators in the slow-moving variables and firm risk before deciding to ease, tighten, or leave unchanged their lending standards to firms. Daily and monthly time series are converted to quarterly averages. All series are transformed by logarithms, first differencing and/or first differencing of logarithms to be stationary. Details are in the Appendix.
4.1. Federal Reserve’s Loan Officer Opinion Survey on bank lending standards
The Federal Reserve collects information on changes in bank lending standards by sending out a quarterly survey to a group of domestic banks across the US. Participants are normally the largest banks of the twelve Federal Reserve Districts, which hold nearly 60 percent of all loans made by US banks. The number of participating banks was roughly 120 in early years of the survey but gradually declined over time to around 60 banks today. The response rate of banks is close to 100 percent. Twenty-one questions are asked on changes in bank lending standards and in demand for loans to business owners and households. In this paper, we use the answers to the following question in the survey:
Over the past three months, how have your bank’s credit standards for approving loan applications for C&I [commercial and industrial] loans or credit lines—excluding those to finance mergers and acquisitions—changed? 1) tightened considerably, 2) tightened somewhat, 3) remained basically unchanged, 4) eased somewhat, 5) eased considerably.
The answers show the number of banks reporting changes in their lending standards in the five different categories above. Next, the net percentage of banks tightening their lending standards is calculated as the number of banks tightening less the number banks easing standards, divided by the total number of banks reporting. The survey also separates firms into two groups based on their total sales: medium-large firms whose total sales are greater than 50 million dollars and small firms whose total sales are less than or equal to 50 million dollars. As a result, we have two different time series on changes in bank lending standards for two groups of firms. The data are taken from the Federal Reserve’s website.
4.2. Firm equity risk
Daily stock returns for all firms in the sample and daily market returns are obtained from the Center for Research in Security Prices (CRSP) database. A firm’s daily stock returns are regressed on daily market returns, S&P 500 index, as follows:
Thus, the residual is given by
The firm’s equity risk is the quarterly standard deviation of the residuals. Next, we match the firm’s calculated equity risk to its financial variables, which come from the COMPUSTAT database. To construct the firm risk index for the whole group of medium-large or small firms, each firm’s total sales is used to measure its weight in the index. The firm risk index is obtained according to
where is the weight of firm
at quarter
, and
is the equity risk for firm
at quarter
.
4.3. Macroeconomic and financial indicators
Besides the firm risk index and changes in lending standards, the model also includes 52 other macroeconomic and financial time series. Although the biggest innovation of a FAVAR model is its large dimension, more data is not always better in practice. Boivin and Ng (Citation2006) point out that adding too much data of the same type, such as real economic activities, can create noise in the model. As a result, the average common component would become smaller and/or the residual cross-correlation may be larger than that warranted by theory. All macroeconomic and financial indicators in our model are selected according two criteria: fitness in the firm risk and lending standard context and availability within the sample period. The S&P 500 index is taken from the Yahoo Finance website. The rest of the variables are downloaded from the Federal Reserve Economic Data (FRED) website of the Federal Reserve Bank of St. Louis.
4.4. Relationship between firm risk and bank lending standards from analyzing the data
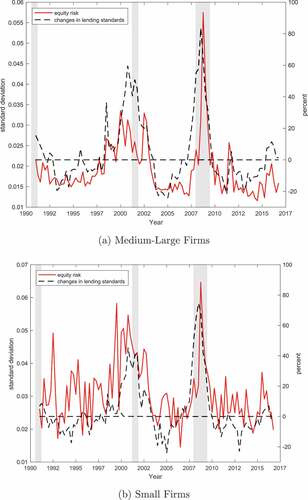
plots the firm risk index and net percentage of loan officers tightening their lending standards on C&I loans to medium-large firms and small firms for the period 1991Q1-2016Q4. For both groups of firms, the two time series move closely together: a higher risk index, more banks strengthening lending standards and vice versa. During an economic expansion, firm risk reduces significantly, hence banks are more willing to lend to firms. When a recession hits the economy, financial markets become more volatile and firms possess more risk. Banks impose more restrictions on lending. Noticeably, in the fourth quarter of 2007 just before the financial crisis, the peak in the risk index explains a record-high number of 83.6 percent of banks tightening their lending standards for medium-large firms, and 75 percent for small firms.
Figure 1. Firm equity risk and net percentage of banks tightening lending standards. (a) Medium-large firms (b) Small firms.
5. Estimated results
5.1. Whole SAMPLE PERIOD
The FAVAR model is estimated using the two-step principal components method. The information criteria ,
, and
all yield four factors in the factor equation. There are two lags in the VAR equation, based on the Akaike information criterion. The single shock in the FAVAR model is defined as a one standard-deviation increase in firm risk. display the impulse response functions (IRF) of nine selected variables due to the shock for the group of medium-large firms and small firms. The IRFs are in standard deviation units with their respective 90 percent confidence bands, and are plotted over a 20 quarter horizon. Our primary focus is the IRF of net percentage of banks tightening their lending due to a positive shock in firm risk. As firm risk increases for medium-large firms, the percentage of banks tightening their lending standards increases by 0.6 standard deviation immediately. However, the effect gradually decreases over four years before it dies out. This finding confirms our conclusion from analyzing the data. When firms reveal a higher level of risk, banks strengthen their lending criteria considerably. For the group of small firms, a shock in risk leads to a 0.3 standard deviation increase in banks tightening their lending. This effect is half the effect for medium-large firms. Loans to medium-large firms are normally bigger in size compared to loans to small firms. If the former group possesses more risk, banks act quickly to scale back their lending due to potential loan losses. Moreover, banks face the asymmetric information problems when lending to small businesses since available information about them is fairly limited and opaque. Consequentially, they need to use other sources of information besides firm balance sheets to assess the risk of lending to small firms, such as their personal relationships with the firms (Cole et al., Citation2004; Petersen & Rajan, Citation2002). A rise in equity risk for small firms is not as critical for banks to re-evaluate their degree of risk as for medium-large firms. Indeed, upon the same shock to firm risk, the percentage of banks changing their lending standards to small businesses is less than that to medium-large firms.
Figure 2. Impulse responses to a shock in firm risk for medium-large firms.Notes: Impulse Responses are generated from the FAVAR model with four latent factors and estimated by principal components with two-step bootstrap and their respective 90 percent confidence bands. All the responses are in standard deviation units.
Figure 3. Impulse responses to a shock in firm risk for small firms.Notes: Impulse Responses are generated from the FAVAR model with four latent factors and estimated by principal components with two-step bootstrap and their respective 90 percent confidence bands. All the responses are in standard deviation units.
Next, we examine the channel of how firm equity risk affects the rest of the economy through the loan spread. There exists a one-for-one relationship between firm risk and loan spread: a one-standard-deviation increase in equity risk leads to a one-standard-deviation increase in loan spread. Banks tightening standards due to rising risk results in higher interest rates on loans, thereby damping investment, real GDP, and employment.
Focusing on other macroeconomic variables in , we find that a one standard-deviation shock in firm risk results in an instantaneous decline in real GDP for both groups of firms. However, the impact of the shock on real GDP is significantly greater for medium-large firms in comparison to small firms. Medium-large firms, whose total sales are more than 50 million dollars, collectively contribute a bigger share to GDP than small firms do. Hence, a decrease in the total sales of the former group due to tighter lending standards has a larger effect on the economy compared to the latter group. Similarly, private investment and employment negatively responds to a positive shock in firm risk. In addition, the reduction in the number of employees in the employment is identical across two groups. This finding is consistent with the fact that despite the size, small businesses added 61.8 percent of newly created jobs between the third quarter of 1993 to the third quarter of 2016 in the US (Small Business AdministrationCitation2017).
The “price puzzle,”Footnote2 which is a common issue in VAR models, does not appear in our model. When firms reveal more risk, banks limit their lending to firms and the money supply decreases. As a result, the consumer price index (CPI) declines for both groups of firms. This finding again provides evidence of the superiority of FAVAR models over VAR models. The inclusion of more than 50 time series in our model eliminates the mismeasurement problem found in VAR models.
Next, we analyze the effect of a shock in firm risk on money aggregates and financial markets. For both groups of firms, the influence of the shock in firm risk on the money supply, M2, is significant and positive, but it is more long-lasting for the medium-large group. When access to bank loans is restricted, firms seek out to other lending sources, such as money market mutual funds or repurchase agreements. This substitute for loans explains the increase in M2.
Based on , the IRFs of the financial variables to a positive shock in firm risk reveal interesting results. The BAA corporate bond yield positively responds to the shock in both groups, medium-large and small firms. Increases in risk make it more difficult for firms to obtain loans from banks. Thus, firms rely more on capital markets to borrow money by issuing long-term corporate bonds (Becker & Ivashina, Citation2014). To make their bonds more attractive to investors, firms need to offer a higher yield. Moreover, the corporate bond default risk premium, the spread between BAA and AAA corporate bond yields, is larger. When firms carry more risk, the probability of their defaulting on loans is higher for both BAA and AAA firms, but more so for the former group. Next, the slope of the yield curve, the yield spread between 10-year Treasury bonds and three-month Treasury bills, increases after the shock. The economy slows down as the result of an increase in firm risk. Investors in bonds market see less future growth in the economy, causing an increase in the yield spread.
5.2. Effect of business cycle risk: Recessions vs. expansions
In the next step, we split the dataset into two subsets, recession and expansion, using the recession indicator published by the National Bureau of Economic Research (NBER). In the time period from 1991Q1 to 2016Q4, the economy experienced three recessions (1991, 2001, and 2008). The purpose of this exercise is to investigate whether business cycle risk amplifies the effect of firm risk on the economy.
The IRFs of the same nine variables due to a one standard-deviation shock in firm risk when the economy is in recessions or expansions are reported in . According to the results, the percentage of banks imposing higher lending standards on medium-large firms during an economic downturn doubles that during an economic expansion. The difference in lending over the business cycle is even larger for small firms: bank tighten their lending standard nearly more than 20 times during recessions compared to expansions. Small firms are considered high-risk in the first place. Banks become more reluctant to lend to them during bad times compared to medium-large firms. Hence, the same shock in firm risk should have a greater impact on bank behaviors during a recession than during an expansion, especially for the group of small businesses.
Figure 4. Impulse responses to a shock in firm risk for medium-large firms during recessions.Notes: Impulse Responses are generated from the FAVAR model with four latent factors and estimated by principal components with two-step bootstrap and their respective 90 percent confidence bands. All the responses are in standard deviation units.
Figure 5. Impulse responses to a shock in firm risk for medium-large firms during expansions.Notes: Impulse Responses are generated from the FAVAR model with four latent factors and estimated by principal components with two-step bootstrap and their respective 90 percent confidence bands. All the responses are in standard deviation units.

Figure 6. Impulse responses to a shock in firm risk for small firms during recessions.Notes: Impulse Responses are generated from the FAVAR model with four latent factors and estimated by principal components with two-step bootstrap and their respective 90 percent confidence bands. All the responses are in standard deviation units.
Figure 7. Impulse responses to a shock in firm risk for small firms during expansions.Notes: Impulse Responses are generated from the FAVAR model with four latent factors and estimated by principal components with two-step bootstrap and their respective 90 percent confidence bands. All the responses are in standard deviation units.
The shock has a much larger negative effect on real GDP, private investment, and employment during recessions than expansions for the group of medium-large firms. A healthy economy can absorb more adverse shocks without catastrophic consequences. On the other hand, the shock to small firms has a negative effect on real GDP, private investment, and employment during recessions, yet a positive effect during expansions. Since banks do not scale back their lending significantly for small firms during expansions, these firms not severely affected by tighter credit conditions. Moreover, when the economy is in an expansion, more equity risk also means firms are growing. The net effect, therefore, is positive on the economy.
show that in the financial markets the corporate bond default risk premium increases more during recessions than expansions after the shock. Investors do not expect firms to default during good economic conditions. When bad economic conditions occur, firms, especially BAA rated ones, are more likely to default on their loans, increasing the credit spread. Furthermore, the slope of the yield curve declines during expansions while increases during recessions. This result is consistent with the recession predicting power of the slope found in the literature (Chauvet & Senyuz, Citation2016). An inverted yield curve (a negative slope) occurs when the Federal Reserve keeps short-term interest rates high to prevent the economy from overheating. In addition, investors have a pessimistic outlook about the future of the economy in the short run, pushing long-term interest rates down. Historically, the yield curve inverts about two years before a recession. The slope then starts to increase as the economy dips into a recession. In these situations, the Federal Reserve typically lowers short-term interest rates to stimulate the economy. In addition, investors demand a higher return on long-term bonds due to poor economic conditions.
5.3. Effect of business cycle risk conditional on bank size
To study whether the effect of business cycle risk on bank lending is dependent on bank size, we divide banks into two groups: large banks with total domestic assets of $50 billion or more, and small banks with with total domestic assets of less than $50 billion.
5.3.1. Medium-large firms
The results for this group are shown in . During recessions the response to firm risk is nearly the same for big banks and small banks. However, during expansions small banks scale back their lending less than big banks do. The results indicate that small banks tend to engage in riskier loans during good times. When credit is available in the economy, as small banks have to compete with big banks to lend to medium-large firms, they tend to accept riskier loans. Furthermore, lending makes up for a larger portion of business for small banks compared to big banks. Thus, the former raises their lending standards less significantly than the latter.
Figure 8. Impulse responses to a shock in firm risk for medium-large firms from big banks during recessions.Notes: Impulse Responses are generated from the FAVAR model with four latent factors and estimated by principal components with two-step bootstrap and their respective 90 percent confidence bands. All the responses are in standard deviation units.
Figure 9. Impulse responses to a shock in firm risk for medium-large firms from small banks during recessions.Notes: Impulse Responses are generated from the FAVAR model with four latent factors and estimated by principal components with two-step bootstrap and their respective 90 percent confidence bands. All the responses are in standard deviation units.

Figure 10. Impulse responses to a shock in firm risk for medium-large firms from big banks during expansions.Notes: Impulse Responses are generated from the FAVAR model with four latent factors and estimated by principal components with two-step bootstrap and their respective 90 percent confidence bands. All the responses are in standard deviation units.
Figure 11. Impulse responses to a shock in firm risk for medium-large firms from small banks during expansions.Notes: Impulse Responses are generated from the FAVAR model with four latent factors and estimated by principal components with two-step bootstrap and their respective 90 percent confidence bands. All the responses are in standard deviation units.
5.3.2. Small firms
present the effects of business cycle risk on lending standards to small firms when taking into account bank size. Similar to the group of medium-large firms, we do not find a substantial difference between big banks and small banks in a recession. However, we find that small banks loosen lending when small firms possess more risk in an expansion. This result once confirms the nature of small bank and small business lending. Small banks are relationship lenders and treat small business lending in a more flexible and case-by-case way compared to large banks. The economy is expanding and credit is available. Small banks, as a result, are more liberal granting loans to small firms despite a higher level of risk. Big banks, on the other hand, tighten their lending because they merely rely on hard information, including firm equity risk, to gauge the risk.
Figure 12. Impulse responses to a shock in firm risk for small firms from big banks during recessions.Notes: Impulse Responses are generated from the FAVAR model with four latent factors and estimated by principal components with two-step bootstrap and their respective 90 percent confidence bands. All the responses are in standard deviation units.
Figure 13. Impulse responses to a shock in firm risk for small firms from small banks during recessions.Notes: Impulse Responses are generated from the FAVAR model with four latent factors and estimated by principal components with two-step bootstrap and their respective 90 percent confidence bands. All the responses are in standard deviation units.
Figure 14. Impulse responses to a shock in firm risk for small firms from big banks during expansions.Notes: Impulse Responses are generated from the FAVAR model with four latent factors and estimated by principal components with two-step bootstrap and their respective 90 percent confidence bands. All the responses are in standard deviation units.

Figure 15. Impulse responses to a shock in firm risk for small firms from small banks during expansions.Notes: Impulse Responses are generated from the FAVAR model with four latent factors and estimated by principal components with two-step bootstrap and their respective 90 percent confidence bands. All the responses are in standard deviation units.
6. Concluding remarks
This paper analyzes the effect of US firm equity risk on bank lending standards and the macroeconomy. To achieve this, we construct a firm equity risk index using firms’ daily stock returns. The FAVAR model is then applied for 55 macroeconomic and financial time series from 1991Q1 to 2016Q4. To the best of our knowledge, this is the first study to analyze the effect of firm equity risk on bank lending standards and the economy. In addition, taking into account the dependence of the impact of firm risk on the economy on firm size, over 30,000 firms in the sample are separated into two groups, medium-large and small, based on their total sales.
The main results show that an increase in firm risk leads to a higher percentage of banks tightening their lending standards for both groups of firms. However, the effect of the shock on lending standards for medium-large firms doubles that for small firms. We also find the evidence that equity risk transfers through bank lending to higher interest rates on loans, lowering investment, real GDP, and employment as a result. Financial variables also respond significantly to the shock in firm risk. Specifically, the shock causes an increase in the money supply, M2, the slope of the yield curve, and corporate bond default risk premium.
To investigate the effect of business cycle risk on bank lending practices, we segregate the sample into two periods using the NBER recession indicator: recession and expansion. The result is that the effect of firm risk on bank lending practices during a recession is much more pronounced than that during an expansion for both groups of firms. Moving to other macroeconomic variables, we find that the effect of firm risk on the economy is larger during recessions compared to expansions. When the economy is healthy, a positive shock in firm risk leading to stronger bank lending standards is well absorbed. Hence, the consequence of the shock on the economy is modest and short-lived. In contrast, the consequence of the same shock is substantial and long-lasting during an economic downturn. Finally, small banks tend to reduce their lending less significantly than big banks during expansions, notably for small firms. This result reveals the nature of small bank and small business lending that relies on soft information including past relationships and owner’s experiences.
In summary, this paper provides a comprehensive study of the effect of firm risk on bank lending standards and the macroeconomy. Given that credit risk is still banks’ most important risk, the paper provides insights on how firm risk affects credit availability and the rest of the economy over business cycles.
Disclosure statement
No potential conflict of interest was reported by the author(s).
Additional information
Funding
Notes on contributors
Hien Nguyen
This paper applies a large amount of data by incorporating microdata on firms with macrodata on the macroeconomy to provide a complete picture of risk transferring. Movements of the macroeconomy, which policymakers and businesses are particularly interested in, are the outcome of microeconomic decisions and interactions. A huge amount of new data at the disaggregated level is becoming available with the collection of information from the internet. By the same token, statistical tools are being developed and designed to study them that can trace these micro actions and their aggregated effects. The results of our study contribute to this new trend of research in the field of macro-finance. In addition, the 2008 financial crisis highlighted the importance of measuring and managing risk in financial institutions and the role of central banks as regulators and supervisors. The findings of our paper shed light on how credit risk is measured and transferred in the economy.
Notes
1. when is large and the number of principal components used is at least as large as the true number of factors, the principal components consistently recover the space spanned by both
and
. Hence, the part of space covered in
that is not covered in
is
.
2. Price puzzle found in the VAR literature is that a contractionary monetary policy shock results in an increase in the price level, rather than a decrease as standard economic theory would predict.
References
- Bai, J., Li, K., & Lu, L. (2016). Estimation and inference of FAVAR models. Journal of Business and Economic Statistics, 34(4), 620–24. https://doi.org/10.1080/07350015.2015.1111222
- Bai, J., & Ng, S. (2002). Determining the number of factors in approximate factor models. Econometrica, 70(1), 191–221. https://doi.org/10.1111/1468-0262.00273
- Bassett, W., Chosak, M., Driscoll, J., & Zakrajšek, E. (2014). Changes in bank lending standards and the macroeconomy. Journal of Monetary Economics, 62(C), 23–40. https://doi.org/10.1016/j.jmoneco.2013.12.005
- Becker, B., & Ivashina, V. (2014). Cyclicality of credit supply: Firm level evidence. Journal of Monetary Economics, 62, 76–93.
- Behr, P., & Guttler, A. (2007). Credit risk assessment and relationship lending: An em- pirical analysis of German small and medium-sized enterprises. Journal of Small Business Management, 45(2), 194–213. https://doi.org/10.1111/j.1540-627X.2007.00209.x
- Bernanke, B., Boivin, J., & Eliasz, P. (2005). Measuring the effects of monetary pol- icy: A factor-augmented vector autoregressive (FAVAR) approach. Quarterly Journal of Economics, 120(1), 387–422. https://faculty.wcas.northwestern.edu/~lchrist/finc520/QJE.pdf
- Boivin, J., & Ng, S. (2006). Are more data always better for factor analysis?. Journal of Econometrics, 132(1), 169–194. https://doi.org/10.1016/j.jeconom.2005.01.027
- Borio, C., & Zhu, H. (2012). Capital regulation, risk-taking and monetary policy: A missing link in the transmission mechanism?. Journal of Financial Stability, 8(4), 236–251. https://doi.org/10.1016/j.jfs.2011.12.003
- Bruno, V., & Shin, H. (2015). Capital flows and the risk-taking channel of monetary policy. Journal of Monetary Economics, 71, 119–132. https://doi.org/10.1016/j.jmoneco.2014.11.011
- Chavet, M., and Senyuz, Z. (2016). A dynamic factor model of the yield curve components as a predictor of the economy. International Journal of Forecasting, 32(2): 324–343.
- Cole, R., Goldberg, L., & White, L. (2004). Cookie cutter vs. character: The micro structure of small business lending by large and small banks. Journal of Financial and Quantitative Analysis, 39(2), 227–251. https://doi.org/10.1017/S0022109000003057
- Demiroglu, C., James, C., & Kizilaslan, A. (2012). Bank lending standards and access to lines of credit. Journal of Money, Credit, and Banking, 44(6), 1063–1089. https://doi.org/10.1111/j.1538-4616.2012.00523.x
- Fama, E. (1981). Stock returns, real activity, inflation, and money. American Economic Review, 71(4), 545–565. https://www.jstor.org/stable/1806180
- Gambacorta, L. (2009). Monetary policy and the risk-taking channel. BIS Quarterly Review, 43–53. https://www.bis.org/publ/qtrpdf/r_qt0912f.pdf
- Gilchrist, S., Yankov, V., & Zakrajšek, E. (2009). Credit market shocks and economic fluctuations: Evidence from corporate bond and stockmarkets. Journal of Monetary Economics, 56(4), 471–493. https://doi.org/10.1016/j.jmoneco.2009.03.017
- Jimenez, G., Ongena, S., Peydro, J., & Saurina, J. (2014). Hazardous times for monetary policy: What do twenty-three million bank loans say about the effects of monetary policy on credit risk-taking? Econometrica, 82(2), 463–505. https://www.jstor.org/stable/24029266
- Jones, P., Olson, E., & Wohar, M. (2017). Reexamination of real stock returns, real interest rates, real activity, and inflation: Evidence from a large data set. Financial Review, 53(3), 405–433. https://doi.org/10.1111/fire.12137
- Keeton, W. (1999). Does faster loan growth lead to higher loan losses? Economic Review, Federal Reserve Bank of Kansas City, 84, 57–75. http://citeseerx.ist.psu.edu/viewdoc/download?doi=10.1.1.161.788&rep=rep1&type=pdf
- Kuritzkes, A., & Schuermann, T. (2010). What we know, don’t know, and can’t know about bank risk: A view from the trenches. Princeton.
- Lee, B. (1981). Causal relations among stock returns, interest rates, real activity, and inflation. Journal of Finance, 47(4), 1591–1603. https://doi.org/10.1111/j.1540-6261.1992.tb04673.x
- Lown, C., Morgan, D., & Rohatgi, S. (2000). Listening to loan officers: The impact of commercial credit standards on lending and output. Economic Policy Reviews, 6(2), 1–16. https://www.newyorkfed.org/medialibrary/media/research/epr/00v06n2/0007lown.pdf
- Lown, C., & Morgan, D. (2006). The credit cycle and the business cycle: New findings using the loan officer opinionsurvey. Journal of Money, Credit, and Banking, 38(6), 1575–1597. https://doi.org/10.1353/mcb.2006.0086
- Petersen, M., & Rajan, R. (2002). Does distance still matter? The information revolution in small business lending. Journal of Finance, 57(6), 2533–2570. https://doi.org/10.1111/1540-6261.00505
- Small Business Administration (2017). Annual Report of the
- Stock, J., & Watson, M. (2002). Forecasting using principal components from a large number of predictors. Journal of the American Statistical Association, 97(460), 1167–1179. https://doi.org/10.1198/016214502388618960
