
 ?Mathematical formulae have been encoded as MathML and are displayed in this HTML version using MathJax in order to improve their display. Uncheck the box to turn MathJax off. This feature requires Javascript. Click on a formula to zoom.
Abstract
This paper uses the Multiple Indicators Multiple Causes (MIMIC) approach to determine the annual size and growth of the hidden economy in Jordan for the period 1980–2018. We find that the key causal variables of the hidden economy in Jordan are: female labor force participation, the inflation rate, the unemployment rate, total tax revenue, and the budget deficit. The growth of these causal variables increases Jordan’s hidden economy. According to our findings, the estimated average of the hidden economy from 1980 to 2018 is 17.6% of the official GDP. Thus, it comprises a large portion of the official GDP. Furthermore, our results suggest an increase in the size of Jordan’s hidden economy from 11.8% in 1980 to 22.4% in 2018. The overall results can assist policymakers in Jordan to combat and reduce the size of the hidden economy.
PUBLIC INTEREST STATEMENT
Hidden economic activity is a global reality, and shows no signs of slowing. This paper examines the size and growth of the hidden economy in Jordan. A limited number of studies have addressed the issue of Jordan’s hidden economy and its effect on the national economy, as well as the role of female participation in the size of the hidden economy. The current paper fills this gap. Furthermore, our paper identifies the leading causes for Jordan’s hidden economy, which has triggered a sharp deterioration in the nation’s economy: weak female labor force participation in the official economy, high taxes, budget deficit, high unemployment, and inflation rate.
1. Introduction
A hidden economy (HE)—otherwise known as an “informal”, “shadow” or “underground” economy—exists in any country where not all sources of income (which may or may not be taxable) have been declared for taxation purposes. This is an essential topic for three main reasons. First, most nations’ official economic and social conditions are estimated using government statistics, but these only reveal part of what is happening, and the existence of an HE may mean that a country’s macroeconomic policies are inappropriate. Second, there is a leakage of tax income; as hidden activities avoid taxation, the public budget deficit increases, which may render the government unable to support the country’s necessary goods and services. The third and final factor is that, since a considerable amount of the income obtained from hidden activities is spent inside the formal sector, the latter receives a bolstering effect. These expenses tend to raise consumer costs (which tends to boost growth), as well as (mostly indirectly) raising taxable incomes, which reduces budget deficits (Alkhdour, Citation2011; Medina & Schneider, Citation2018; Schneider & Buehn, Citation2013; Williams & Schneider, Citation2016).
One important factor that may increase the HE in Jordan is female labor force participation. According to the Center for International Private Enterprise studies,Footnote1 with less than one-fifth of women employed in the labor force, Jordan has one of the lowest rates of female economic participation in the world, notwithstanding that Jordan features a highly educated female population with great potential to contribute to Jordan’s economic, social, and political development. Nevertheless, women have a significant gap regarding constitutional rights and social norms, with conventional beliefs and cultural limitations limiting their options.
A limited number of studies have addressed the issue of Jordan’s hidden economy and its effect on the national economy. In many studies, such as those by Medina and Schneider (Citation2018), Schneider (Citation2007), and Schneider et al. (Citation2010)b, Jordan has been mentioned only in passing, and considerably more attention has been paid to other countries and economies. No previous economic research has concentrated on Jordan, except for Alkhdour’s (Citation2011), which examined the period 1976–2010. Our paper not only casts further light on this underexplored topic but also runs a set of robustness tests to assess the authenticity of our results. The expansion of the underground economy warrants a deeper examination of this issue in Jordan, especially as policymakers become more anxious about the accuracy of macroeconomic signals when attempting to confront and overcome the structural problems facing Jordan’s economy.
Currently, in Jordan, the declining growth rate and ever-increasing budget deficit, combined with an increasing public debt equaling about 96% of the nation’s GDP, has forced the government to raise income tax rates to meet the requirements of the International Monetary Fund (IMF). The IMF and the World Bank are presently concerned about whether Jordan’s leaders apply macroeconomic policies correctly. We expect that the activities that characterize the hidden economy in Jordan will increase significantly in the future, since higher taxes may encourage individuals to make up for lost income by taking on other undetected employment opportunities that are not in the official sector. To obtain a better understanding of the size of the hidden economy and the relationships between it and Jordan’s official economy, many more studies are needed. The main objective of this paper is to measure the annual size of the hidden economy in Jordan over the period 1980–2018, using the Multiple Indicators Multiple Causes (MIMIC) approach. We find that high taxes, unemployment rate, and inflation rate have increased the size of the hidden economy in Jordan. Moreover, we find that the budget deficit positively impacts the hidden economy, which is demonstrated by the government’s attempts to reduce the deficit by increasing the tax rate and reducing expenditure. Finally, we also find that an increased rate of female participation in the formal economy leads to a reduction in the size of the hidden economy.
Our study contributes to the previous literature on the role of tax, inflation, budget deficit, and female participation in the HE in Jordan. Although prior studies have estimated the hidden economy in Jordan (Alkhdour, Citation2011; Medina & Schneider, Citation2018; Schneider & Buehn, Citation2013; Williams & Schneider, Citation2016), our paper is the first attempt to examine the size of its hidden economy in terms of the role of female participation. Moreover, this study is the first to investigate how the budget deficit may be the leading cause of Jordan’s hidden economy and the policy implications. The paper is structured as follows: Section 2 defines the hidden economy and its estimation methods; Section 3 attempts to measure and estimate the hidden economy; Section 4 reviews the relevant literature; Section 5 outlines the model specification and economic methodology using the MIMIC estimation model; Section 6 presents the results concerning the size of Jordan’s hidden economy using the MIMIC model; Section 7 summarizes the main findings and themes of the study; Section 8 provides conclusions.
2. Definition of hidden economy, main causes, and estimation methods
The hidden economy cannot be adequately described using a single definition. Economics researchers have devised many definitions, with varying labels and perspectives, using terms such as the “hidden economy”, “shadow economy”, “black economy”, “parallel economy” and “underground economy”. In general, the concept of an HE is defined as the “market-based production of goods and services, whether legal or illegal, that escapes detection in the official estimates of GDP” (Smith, Citation1997, p. 15). Dell’Anno (Citation2003, p. 5) defines it as “economic activities and the income derived from them that circumvent or otherwise avoid government regulation, taxation or observation”.
The above definitions indicate that there is controversy among scholars regarding the definition of this phenomenon. This is because the hidden economy is not limited to monetary transactions or illicit activities, as legitimate activities and non-monetary transactions fall under the label of hidden economic activities.
2.1. The main causes of the hidden economy
2.1.1. Tax and social security burdens
High taxes may encourage individuals to take part in the hidden economy in order to avoid paying their taxes and thus retain a higher personal income. It has become very evident that tax systems and the pressures being put on social security systems are the two main factors that have encouraged people to participate in hidden economic activity. Current taxes, which are perceived to be too high and unfair by many people, affect workers in the official economy and encourage them to make up for lost income in other ways. Requisite increases in contributions to the social security system can also lead businesses, institutions, and individuals to falsify their income statements and related activities.
Experimental studies conducted by Johnson et al. (Citation1998) and later by Williams and Schneider (Citation2016), confirm that expanding and inequitable tax burdens can encourage a drift towards working in the hidden economy.
2.1.2. Government regulations
The general trend of governments around the world increasing the number and scope of regulations is another important factor that influences the rise and size of the hidden economy.
Johnson et al. (Citation1997) indicated in their study that governments that implement stricter business regulations, more bureaucracy or “red tape” and restrictions on tax rebates, refunds, etc., are in effect promoting the existence of hidden economies. Some examples of such restrictions include licensing requirements, restrictions on business-related deductions, more documentation of market activities, restrictions on foreigners, and trade barriers such as “investment restrictions” and “trade restrictions”. These systems increase labor costs; subsequently, and not surprisingly, people begin relying on the hidden economy to avoid such costs.
2.1.3. Government and corruption
Studies have indicated a connection between government corruption and the hidden economy. Johnson et al. (Citation1997), Johnson et al. (Citation1998), and Schneideret al. (Citation2010)b have all indicated that corruption and the size of the hidden economy are complementary in low-income countries, including Bolivia, Zimbabwe, Peru, and Georgia, which have the largest shadow economies in the world. They also indicate the absence of a strong relationship between hidden economies and high-income states, such as Switzerland, the United States, Luxembourg, and Austria, which have the slightest shadow economies in the world.
2.1.4. Inflation
Economists believe that a rise in the inflation rate increases the size and breadth of the hidden economy, due to increased demand for cheaper goods and services. Inflation can trigger a decline in the value of money over time, which then pushes people’s incomes into a higher tax bracket (the process of “bracket creep”), constituting an additional incentive for taxpayers to work for “cash in hand” in order to avoid paying extra tax (Cassar, Citation2001).
2.1.5. Social transfers
Social welfare systems are developed and supported by state bureaucracies or agencies in order to provide, among other services, pensions, disability payments, and unemployment payments to people who cannot look after themselves or their families financially. These systems may encourage people who receive such welfare payments to cease looking for work in the formal economy to receive welfare payments provided by the state. As pensions or welfare benefits increase below the inflation rate, their recipients may work in the hidden economy to meet their needs. Studies by Lemieux et al. (Citation1994) and Schneider and Enste (Citation2000) argue that this type of welfare has a role in increasing the size of the hidden economy.
2.2. Measuring or estimating the hidden economy
It is difficult for economists to estimate or measure the hidden economy, due to the lack of information available. However, despite the limited data availability, many strategies can be used to estimate the size of hidden economies—generally, the measurement techniques are divided into direct and indirect approaches, each with advantages and disadvantages. Most techniques used to measure the hidden economy are indirect approaches because they use proxy variables in their estimations. All of which will be explained in more detail in the sub-sections below.
2.2.1. Direct approaches
Direct approaches to measuring the hidden economy in surveys and field samples depend on voluntary replies. The main advantage of this method lies in gaining a better understanding of the structure of the HE and detailed information about the factors that help to shape it. Valuable insights can be achieved through using such an approach—as seen, for instance, in the work of Isachsen and Strom (Citation1985) and Mogensen (Citation1995) for Norway and Denmark. However, the principal disadvantage of this technique is a lack of precision. This is an inherent consequence of the nature of a survey, which chiefly relies on the respondents’ willingness to collaborate with researchers on issues that concern the hidden economy. Issues around the reliability and possible ambiguity of their responses can cause problems when analyzing the size of the part of the hidden economy that they work in.
2.2.2. Indirect approaches
The indirect approaches adopted to estimate and measure the hidden economy are sometimes referred to as “holistic” approaches due to macroeconomic indicators for reporting information about the HE and its development. This approach includes seven indicators: the discrepancy between public sector expenditure and revenues; the numerical difference between the authentic and official workforce; the money demand approach (monetary approach); the transactions approach; the MIMIC approach (multiple indicators multiple causes); and the physical input system (electric power consumption; Schneider, Citation2005).
The indirect approach has advantages and disadvantages. While it can provide information about the size of the hidden economy, it can be unreliable when it comes to determining the structure of the HE. Another problem is that it often requires assumptions that must be made but cannot be substantiated in most cases. Therefore, there is no perfect way to measure the HE’s size, range, and depth in any one country (Schneider, Citation2005). In this study we will use the Multiple Indicators Multiple Causes (MIMIC) approach, which is expanded on in more detail below
2.2.3. Multiple indicators multiple causes (MIMIC approach)
The MIMIC approach estimates the value of an unobserved (or latent) variable by using some observed variables. This model considers a special structural equation model (SEM) case. This approach uses the latent variable as the index of the hidden economy, while the observed variables are divided into causes and indicators of the hidden economy. This method employs the computer software LISREL to evaluate its covariance structures. To estimate the MIMIC model, we employ the maximum likelihood estimator by means of exceptional software for structural equation models, known as LISREL9.1.
The MIMIC model has many advantages for estimating hidden economic activities. Based on Giles et al.’s (Citation2002) work, the MIMIC approach is an overall strategy encompassing many approaches that allow researchers to consider and develop numerous indicators and causal variables. At the same time, it has the advantage of being flexible, enabling indicators and the causal variables to be changed so that respective aspect of hidden economic activity can be investigated. Schneider and Enste (Citation2000) examined the SEM/MIMIC model and developed official estimation and testing procedures, which are still commonly applied today. One of the characteristics of this model is that it has flexibility in its application, which makes it suitable to estimate the sample, providing it is sufficiently large. In addition, this model makes it possible to gauge the size and evolution of the hidden economy.
The disadvantages or limitations of the model are similar to those of estimating hidden economy activities using SEM—that is, the reliance on latent variables. Because the emphasis is on determining if a particular model is robust and valid, it does not take into account other possible or more suitable models. This means that the designated model will almost certainly include unofficial economic activities other than those studied. For this reason, it is challenging to research hidden economies and actual illegal activities (e.g., the drug trade, prostitution, human trafficking) as they are themselves deeply hidden within the hidden economy. This approach is an important one in the literature, but it remains complex to conduct, as it is based on purely theoretical premises, and it encounters the problem of empirical restrictions on access to information (Schneider & Buehn, Citation2013).
On the other hand, the SEM/MIMIC method leads to unreliable coefficient estimates and is related to alternative model specifications and changes in the sample size. However, the issue of instability disappears when the sample size increases (Dell’Anno, Citation2003), and the SEM/MIMIC approach can be a valuable tool when studying and analyzing the hidden economy. The abovementioned objections do not mean that the method should be abandoned but should encourage further economic research in the field.
One important critique of the existing literature is that most of the studies determining the size of the hidden economy take a monetary approach, which typically considers only one cause, which is the burden of taxation. Other estimation methods consider only one indicator to estimate the effects of the hidden economy. However, the hidden economy has effects simultaneously on all economic markets, such as the labor, production, and money markets. In contrast, the MIMIC approach considers multiple indicators and multiple causes for the presence of a hidden economy over time.
As the size of the hidden economy is unknown, a latent estimator approach which uses the MIMIC model is employed. The MIMIC approach is based upon a statistical hypothesis of unobserved variables. The relevant statistical idea behind these models is to compare a sample covariance matrix—for example, a covariance matrix of observable variables, with the parametric structure inflicted on this matrix by a hypothesized model (Sauka & Schneider, Citation2016). Utilizing covariance information between the observable variables, the unobservable variable is in the first phase associated with the observable variables in a component analytical model, also known as a measurement model. Next, the relationship between the unobservable variable and observable variables is specified by using a structural model. Hence, a MIMIC model is concurrent.
The MIMIC approach is recognized by many scholars who estimate the size of hidden economic phenomena. Compared with previous statistical methods, SEM/MIMIC models present several advantages for estimating the size of the hidden economy (Sauka & Schneider, Citation2016). In evaluating the current, hidden economy estimates of various economists, it should be taken into consideration that there is no best or generally accepted method. Hidden economy estimation is not a straightforward or easy empirical task; indeed, “such an empirical exercise is a minefield, regardless of which method is used” (Sauka & Schneider, Citation2016, p. 39).
The economic literature that uses SEMs is very conscious of these constraints. It recognizes that applying this approach to an economic dataset is not easy, but it also contends that this does not mean one should abandon the SEM approach. On the contrary, as part of an interdisciplinary approach to economics, SEMs are essential tools for economic analysis, particularly when examining the hidden economy. The concerns mentioned should be considered inducements for additional research in this field instead of abandoning the technique.
3. Literature review
Many studies have discussed the phenomenon of the HE, which reflects the importance of this issue to economists. However, these studies have mainly used indirect methods to measure what the hidden economy entails. This section will comment on several studies that have examined hidden economies utilizing the MIMIC approach.
3.1. Literature on the hidden economy using the MIMIC approach
Macias and Cazzavillan (Citation2010) applied the MIMIC method to measure and examine the development of the HE in Mexico from 1970–2006. They looked at factors such as tax burden, salary levels, inflation, unemployment, and government regulation, while real GDP and real currency served as an index for measuring the hidden economy. The study found a positive correlation between the HE and official GDP. Furthermore, they discovered that the main causes of Mexico’s hidden economy were excessive government regulations and salaries that were too low.
Vo and Ly (Citation2014) estimated the trajectory and size of the hidden economy as it existed in the countries making up the Association of South East Asian Nations (ASEAN), except Singapore and Brunei. Their study covered the period 1995–2014 and applied the MIMIC approach. The results presented evidence that labor freedoms, tax rates, and business freedoms have significantly influenced the shadow economies of these Asian countries.
Schneider (Citation2015) applied the MIMIC approach to gauge the nature and extent of the shadow economy for 31 EU countries and other European nations, including Norway, Switzerland, and Turkey. They discovered that the average size of their hidden economies was 22.6% of formal GDP in 2003, which fell to 18.6% in 2014.
Hassan and Schneider (Citation2016a) applied two different methods to measure the trend and size of Egypt’s hidden economy, utilizing two methods: i) structural equation modeling, and ii) the currency demand approach (CDA). Their study used variables relevant to Egypt’s formal economy, such as self-employment and agriculture, which served as proxy variables to measure the quality of democratic institutions. They found that the hidden economy decreased from approximately 50% in 1976 to about 32% in 2013.
3.2. Literature on Jordan
Schneider (Citation2007) estimated the hidden economy in Jordan and the hidden economy of 145 countries in various phases of economic development for 1999–2005. They used the MIMIC model for the economic assessment—specifically, they used bank deposits as the dependent variable and per capita income and salaries/wages as the independent variable in the currency demand equation. Their results confirmed that the shadow economy in Jordan as a percentage of GDP increased from 19.4% percent of GDP in 1999–2000 to 20.4% in 2004–2005, reaching a peak value of 21.6% during 2002–2003.
Schneider et al. (Citation2010)a later updated the Schneider (Citation2007) study to include 162 countries, including Jordan, for the period 1999–2006. They applied the same MIMIC model for measurement, in addition to the currency demand approach. The authors made four different estimates because of the limited data available. They found that the average size of the shadow economy in Jordan reached 18.7% of formal GDP between 1999 and 2006. For the 162 selected countries, the average size of the shadow economy rose from 33.7% in 1999 to 35.3% of GDP in 2006.
Alkhdour (Citation2011) conducted a study on Jordan from 1976–2010. This study used the CDA and the MIMIC approach to analyze the annual size of the HE in Jordan. In addition, this study investigated economic consequences and the shadow economy’s policy implications. Alkhdour differentiated the impact of customs duties on the shadow economy from taxes on income and sales. The results, obtained through the currency demand approach, found that the average size of the HE in Jordan was 14.7% percent of GDP for 1976–2010. Based on the MIMIC approach, Alkhdour attributed Jordan’s shadow economy to four main causes and two indicators: government regulation, the unemployment rate, the total effective tax rate, and depreciation of the Jordanian dinar in 1988. The main two indicators of the HE in Jordan are the growth in private consumption and the growth rate of real GDP.
A study conducted by the United Nations Development Program (UNDP) in 2013, in collaboration with Jordan’s Ministry of Planning and Social Economic Council, set out to measure the informal economy based on the Jordan Labor Market Panel Survey of 2010.Footnote2 It indicated that the average size of the HE stood at 8.6% of nominal GDP. Another study for UNDP, which measured the informal economy in Jordan during the period 1999–2010, employed the currency demand approach. The study investigated some of the core factors affected by the HE in Jordan: total tax revenues, unemployment, growth of real GDP, and inflation.
In a study covering 1999–2013, Hassan and Schneider (Citation2016b) measured the development and size of the shadow economies of 157 countries, including Jordan. Using the MIMIC approach for 1999–2013, they found four leading factors that increased the size of the shadow economies in these countries: i) higher tax, ii) regulatory burden, iii) unemployment, and iv) self-employment rates. These findings confirm the results found in studies by Feige (Citation1989), Feld and Schneider (Citation2010), Macias and Cazzavillan (Citation2010), and Schneider et al. (Citation2010)b. The average size of the shadow economies in all sample countries over the period of study was 33.77% of official GDP.
Medina and Schneider (Citation2018), in their study covering the years 1991–2015, estimated the HE for 158 countries, including Jordan. They employed the MIMIC approach to measuring the shadow economy and added the currency demand approach (CDA). The authors concluded that the average size of Jordan’s shadow economy was 14.8% of formal GDP for the period 2004–2007. In other recent studies by Medina and Schneider (Citation2019), they estimated the size of the shadow economy in 157 countries from 1991 to 2017, and found that the hidden economy in Jordan was smaller than in Medina and Schneider’s (Citation2019) study. They said that the average size of the hidden economy in Jordan for the period 2009–2017 was 17.3 % GDP, and it decreased a little from 15.9 percent in 2009 to 14.9 percent in 2017. Taking the 157 selected countries as a whole, their study shows that the average size of the world; HE was 30.9 % of GDP between 1991 and 2017. shows the size of Jordan’s hidden economy compared with those of other Middle East countries (Medina & Schneider, Citation2019).
Table 1. Hidden economies in Jordan and Middle Eastern Countries
While many studies have estimated the size of the hidden economy in Jordan (e.g., Alkhdour, Citation2011; Schneider et al. 2010a; Schneider, Citation2007; Medina & Schneider, Citation2018, Citation2019), this paper is the first to take into consideration the budget deficit and female participation as causes of the hidden economy in Jordan using the MIMIC model. This is important because developing countries suffer from low female labor force participation in the economy—especially Jordan—which has one of the lowest rates of female economic participation in the world. Hence, this may be one of the key factors that impact the size of the hidden economy in developing countries. Furthermore, Jordan is suffering from a budget deficit, and this variable will lead the government to increase the tax rate, thereby compelling some people to find work in the hidden economy. Consequently, this paper will investigate an important gap in the literature, which concerns whether female labor force participation and the budget deficit are one of the leading causes of the hidden economy in Jordan.
In conclusion, the hidden economy cannot be considered a temporary phenomenon. It is one in which job creation occurs, and new income is generated to help citizens access affordable goods and services. For this reason, the hidden economy needs to be better understood both by governments and policymakers, particularly in terms of why it exists and what draws people to it when “official” economic policies and legislation fail to improve people’s lives.
4. Model specification, econometric methodology, and data sources
Our paper employs the MIMIC model to examine the size of the hidden economy in Jordan during the period 1980–2018. We have identified this period based on data availability collected from various sources, such as the Central Bank of Jordan, Jordan General Statistics Department, the Jordanian Ministry of Finance, the World Bank, and the International Monetary Fund.
4.1. The MIMIC approach
The core idea of the MIMIC approach is to explore the connections between certain latent variables which constitute the magnitude of hidden economic activities. shows the covariance matrix by dividing the variables into two groups of latent variables—causes and indicators.
Figure 1. The MIMIC model. source: .Schneider and Buehn (Citation2013)
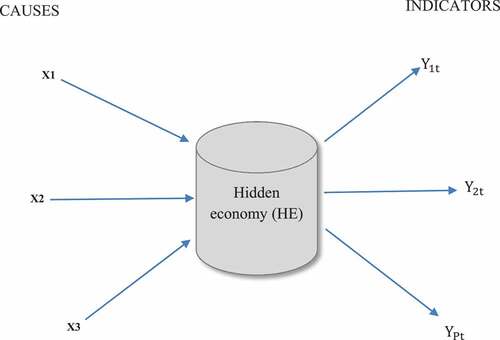
The structural equation model (SEM) approach that includes the MIMIC model uses two main equations and two models (i.e., the measurement and structural models). The (latent) variable determines a
vector
of indicators in the measurement model; these are variables that denote activities in the hidden economy, subject to a
vector of random error terms
. The unobservable variable
is a scalar and
is
representing the column vector measurement parameters. The connection between the latent variable (hidden economy) and its indicators are defined as the below-mentioned measurement equation.
The connection between the latent variable (hidden economy) and its causes is defined as the structural equation. This equation determines the unobservable variable by collecting the exogenous cause’s
ˊ, subject to the structural disturbance error term
and where
is
vector of coefficients.
It is given by:
The following equation represents the relationship between the measurement equation (indicators) and the structural equation (causes). It is given by substituting Equationequation (2)(2)
(2) into (1) so that we obtain the following multivariate regression model:
Where and
Generally, the MIMIC approach aims to reduce the distance between an observed and predicted covariance matrix; this depends on the approach the researcher requires for analyzing the data. To find and estimate the approach with the best fit, we must reduce the residual between the covariance matrix of the predicted
and observed data
.
The MIMIC approach needs more than one specification to find the best fitting strategy; we start with seven causes, one latent variable, and three indicators, in effect 7-1-3 specification. Here we use three indicators to measure the size of the hidden economy, and then we determine its coefficient (λ1) at (+1) or (−1). The model is written in three equations, and then we gradually omit the insignificant variables to reach the best fitting model.
From Equationequations (2)(2)
(2) and (5), we see that measuring the latent variable (hidden economy) is the same as the estimated value of both the normalized indicator variable
and equations (5)b and (5)c. We can see from these two equations the measured values of
and
, which were rescaled from
(Alkhdour, Citation2011; Schneider & Buehn, Citation2018). By measuring the coefficients in the MIMIC approach and utilizing the expected value of error term
= 0, we can ascertain the annual indexes, rather than the value of the HE. These measured indexes will be identical to transform independent variables with the same variance. The
represents the measurement error term. Both the structural disturbance term
and the measurement error term are independent and are assumed to follow a standard normal distribution with a mean of zero and constant variance (Dell’Anno & Schneider, Citation2009). Furthermore, to change the indexes into absolute values of the hidden economy and measure its annual size, which is also a percentage of formal GDP, we must externally estimate Jordan’s hidden economy for at least one year. After doing so, we can use this value as the calibration method for this study.
According to Alkhdour (Citation2011), Medina and Schneider (Citation2018), and Schneider (Citation2007), and Schneider, Buehn, Montenegro et al. (Citation2010, Citation2010), Jordan’s hidden economy was equal to 19.4% of GDP in 1999, the base year of our analysis. Hence, we utilize the average size of the hidden economy as a percentage of GDP in Jordan as the base reference point for estimating the major annual indexes of the hidden economy.Footnote3 By applying this procedure for all years, we retrieve the annual estimates of the hidden economy in Jordan for 1980–2018. We use the root mean square error of approximation (RMSEA), the normed fit index (NFI), goodness-of-fit index (GFI), and the adjusted goodness-of-fit index (AGFI). Doing so will help us generate the best fitting model for the MIMIC approach.
4.1.1. The causes of the hidden economy and hypotheses
We will use some of the cause’s variables (e.g., inflation rate, unemployment rate) that might lead to an increase in the size of the hidden economy in Jordan.Footnote4
Budget deficit (after foreign aid). This variable represents the budget deficit as a % of GDP. Any increases in this variable will lead the government to increase the tax rate, thereby compelling some people to find work in the hidden economy, ceteris paribus. We will include this variable as a causal variable in the MIMIC model and inspect a positive effect on the hidden economy in Jordan.
Hypothesis (1): A higher budget deficit positively influences the size of Hidden economy in Jordan, ceteris paribus.
Total tax revenue in the percentage of GDP: This variable positively impacts the hidden economy. An increase in tax revenue as a percentage of GDP will increase the size of the hidden economy, ceteris paribus. The tax variable is the significant development that leads people to search for additional work and income inside the hidden economy umbrella. We will include the total tax revenue as a causal variable in the MIMIC model and inspect the effect on the hidden economy in Jordan.
Hypothesis (2): A higher total tax revenue positively influences the size of Hidden economy in Jordan, ceteris paribus.
Inflation Rate: This variable affects the size of the hidden economy as higher official inflation will increase consumer demand for cheaper goods and services in the hidden economy, ceteris paribus. We will include the effective inflation rate as a causal variable in the MIMIC model and examine the effect on the hidden economy in Jordan.
Hypothesis (3): A higher inflation rate positively influences the size of Hidden economy in Jordan, ceteris paribus.
Female labor force participation. This variable represents female participation as a percentage of the total labor force in the official economy; an increase in female participation in the official economy will decrease female participation in the hidden economy, which will reduce the size of the hidden economy. We will include this variable as a causal variable in the MIMIC model and inspect the effect on the hidden economy in Jordan.
Hypothesis (4): A higher female labor force participation negatively influences the size of Hidden economy in Jordan, ceteris paribus.
Unemployment rate. The two leading causes of the hidden economy dynamics are the unemployment rate and the level of self-employment, but unemployment wields no obvious effect on the hidden economy for two reasons: the income effect and the substitution effect. The former states that a higher unemployment rate leads to declining incomes and thus less demand for goods and services in formal and informal economies; therefore, an adverse effect ensues. Meanwhile, the latter has an effect whereby high unemployment in the formal economy forces the unemployed to seek work in the hidden economy, ceteris paribus, which—if they find it—has a positive effect. We will include the unemployment rate as a causal variable in the MIMIC model and inspect the impact on Jordan’s hidden economy.
Hypothesis (5): A higher unemployment rate positively influences the size of Hidden economy in Jordan, ceteris paribus.
Interest rate on savings. Interest rate is the opportunity cost of holding cash, representing interest on bank savings deposits. This variable has an inverse effect on the hidden economy, ceteris paribus. We will include the effective interest rate as a causal variable in the MIMIC model and examine the impact on the hidden economy in Jordan.
Hypothesis (6): A higher interest rate positively influences the size of Hidden economy in Jordan, ceteris paribus.
A dummy variable. This variable is equal to 1 in 1989 and thereafter, but 0 in the years before 1989. A decline in the Jordanian dinar’s value occurred in 1988. We will include this dummy variable as a causal variable in the MIMIC model and examine the effect on the hidden economy in Jordan.
Hypothesis (7): The decline in the Jordanian dinar’s value in 1989 positively influences the Hidden economy in Jordan, ceteris paribus.
4.1.2. Indicators of the hidden economy
The size of the hidden economy depends on the various indicators and elements.Footnote5 This paper utilizes three significant variables as listed below:
4.1.2.1. Growth rate of real GDP
To cite Alkhdour (Citation2011, p. 56), “There is no consensus among economists about the correct relationship between the official economy (GDP) and the hidden economy. This relationship is different from country to country”. In some studies, we find that there is a negative relationship between the official and hidden economies, due to the decline in the official economy where unemployment is high; hence, when there is too much competition for too few jobs, people are forced to look for work in the underground economy (Dell’Anno, Citation2003; Schneider & Enste, Citation2000). Other research has found a positive relationship between the official and the hidden economies, as an improvement in the official economy means that the demand for goods and services in both the informal and formal sectors will rise (Alkhdour, Citation2011; Bajada & Schneider, Citation2009).
4.1.2.2. Growth rate of real private consumption
In typical economic theory, there is a positive relationship between income and consumption. Real private consumption is considered to be one of the indicators of the hidden economy.
4.1.2.3. Growth rate of real currency in circulation
To avoid paying tax, virtually no parties in the hidden economy use bank accounts or formal documentation in their transactions and business agreements. Instead, cash is the primary currency. Therefore, a rise in the demand for real currency in circulation indicates the hidden economy growing in size and importance (Alkhdour, Citation2011).
5. Results of the size of the jordan hidden economy using the MIMIC estimation model
We use the seven causal variables and three indicators; the hidden economy is the latent variable in this model. The non-significant variables are gradually dispensed until the best fitting model is reached. The seven variables are as follows:
The percentage of budget deficit to GDP (DEF)
Total tax revenue in percent of GDP (TREV)
Inflation rate (IN)
The percentage of the female labor force to the total labor force (FP)
Unemployment rate (UNEMP)
Interest rate on savings (I)
Dummy variable for the Jordanian dinar’s declining value in 1988 (DY = 1 for the years 1988–2018, and DY = 0 for the years before 1988).
The following three variables are used as indicators:
Growth rate of real GDP (GRGDP).
Growth rate of real private consumption (GRCON).
Growth rate of real currency in circulation (GRCR).
For the (7-1-3) specification, the number 7 indicates the number of causes, while the number 1 is the latent variable (hidden economy), and the number 3 is the number of indicators.Footnote6 The correlation between the latent variable (hidden economy) and its causes is defined as a structural equation, and we have seven causal variables, which are given by:
where HE is the scale of the hidden economy.
The present the different combinations of the above causes of the hidden economy. The correlation between the latent variable (hidden economy) and its indicators is defined as a measurement equation, and we have in this study three indicators. We have three measurement equations; the growth rate of real GDP gives the first measurement equation:
The second measurement equation is given by the growth rate of private consumption GRCON:
The third measurement equation is given by the growth rate of currency circulation GRCR:
It is necessary to test whether the variables (both the causes and the indicators) are co-integrated or not. Therefore, before starting with the hidden economy estimation of Equationequation (6)(6)
(6) , we tested our time series for the presence of unit root. The results show that some of the variables are stationary at their levels. As for GRCON, GRCR, I, UN, and FP, the ADF test results show that those variables exhibit a unit root. To overcome this problem, those variables were converted to the first difference. Consequently, ADF tests show that all variables became stationary at 1%.Footnote7
To achieve the best fitting model via the maximum likelihood estimator (MLE), we use the LISREL 9.1 program. This program estimates the structural equation model (SEM). Therefore, the results are five causal variables, one latent variable, and a two-indicators (5-1-2) specification; this is considered the best fitting model. gives the MIMIC model results, which converged after six iterations.
Table 2. The MIMIC model results for Jordan’s economy from 1980–2018
The LISREL 9.1 software program tests the model’s overall goodness of fit. The most popular test is the root mean square error of approximation (RMSEA). Accepted models have an RMSEA of less than 0.1. The results show that the value of the RMSEA is 0.01, which indicates that the model exhibits an excellent performance fit. The other popular tests for the goodness-of-fit are the normed fit index (NFI) which varies from 0 to 1, with 1 representing the complete fit model. The problem with the NFI, however, is that there is no penalty for adding parameters. The value of NFI for our study is 0.90, which indicates a good model fit. The goodness-of-fit index (GFI) and the adjusted goodness-of-fit index (AGFI) are also used to test the model’s goodness of fit. The GFI and AGFI are measured from 0 to 1; they reflect the percentage of observed covariance explained by the covariance implied by the model (similar to an adjustment in the multiple regression model/s). Our results show that the GFI and AGFI are high, at 0.95 and 0.92, respectively; this suggests a good model fit.
As shown in , the MIMIC model for estimating Jordan’s hidden economy is determined by substituting the estimated coefficients as shown in the following measurement equations. We use the value λ1 = −1 because the estimation of the model illustrates that the results are consistent with the economic theory.Footnote8
Measurement equations:
Structural equation:
The results indicate that the coefficient sign of the total tax revenue, budget deficit, inflation rate, and unemployment is positive and significant at the 1% and 5% confidence levels, respectively. The coefficient sign of female participation is negative and significant at the 1% confidence level. According to economic theory, the effect of total tax revenue, inflation rate, and the unemployment rate is as expected. These results are compatible with previous research findings that any increase in these three variables leads to the HE increasing; indeed, these were, in fact, the leading causes of the hidden economy (Medina & Schneider, Citation2018; Schneider & Buehn, Citation2013). These previous studies show that higher tax burdens, inflation rates, and unemployment are among the main reasons people work in the HE.
The positive impact of the budget deficit on the hidden economy can be explained by the Jordanian government’s attempt to reduce the deficit with tighter fiscal policies, such as increasing tax ratios and reducing spending on essential goods and services. This forces more people to conduct some of their economic activities in the hidden economy. This result is in line with Schneider (Citation2005), Schneider, Buehn, Montenegro et al. (Citation2010), and Schneider and Enste (Citation2000), who argue that a continuous increase in the tax rate and reduction of domestic demand by increasing tax, as a result of deflationary government policy (a budget deficit), leads to an increase in the size of the hidden economy.
Female labor force participation is statistically significant and has the expected negative relationship with the hidden economy. This implies that a higher level of female labor force participation in the official economy decreases women’s reluctance to participate in the hidden economy. This result is in line with the study by Charmes (Citation2007), who found that in countries with low female participation in the official economy, inequality between the sexes, and failure to empower females, there is an increase in female participation in the hidden economy. This result, to some extent, is in line with a United Nations study that argues that fewer women receive pensions globally, and as a result, more elderly women are now living in poverty that may force them into the hidden economy.Footnote9 Even in developed economies, such as France, Germany, Greece, and Italy, women’s average pensions are more than 30 percent lower than men’s. This may force them to resort to working in the hidden economy.
Finally, our finding of the positive and significant effect of the unemployment rate on the hidden economy in Jordan is in line with many studies, such those by as Dell’Anno and Solomon (Citation2008), Dobre et al. (Citation2010), Davidescu et al. (Citation2015), and Mauleón and Sardà (Citation2017), among others. They argue that an increase in the unemployment rate results in an increase in the hidden economy because workers prefer to work in the hidden economy rather than being unemployed.
EquationEquation (12)(12)
(12) above calculates the annual indices for the hidden economy in Jordan for the period 1980–2018. As explained in the previous section on the MIMIC approach, to convert those indices into the values of the hidden economy as a percentage of official GDP, we follow Dell’Anno’s (Citation2007) procedure in the benchmarking process so that we can measure the size of the hidden economy. The annual estimated index of Jordan’s hidden economy and external estimation of it in 1999 is equal to 19.4. Consequently, the annual ratios of the hidden economy as percentages of GDP in Jordan can be calculated for the period 1980–2018. From those ratios, the Jordanian dinar values of the hidden economy can be calculated for that whole period. summarizes two factors: first, the hidden economy as a percentage of GDP in Jordan, and second, the estimated Jordanian dinar value of the hidden economy, as previously mentioned.
Table 3. The size of the hidden economy as a percentage of GDP
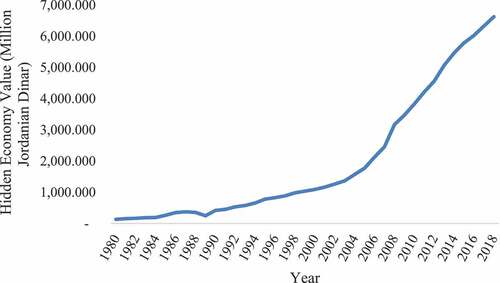
The MIMIC estimates show that the average value of Jordan’s hidden economy for 1980–2018 was 17.6% of GDP. The absolute value of the hidden economy during this period rose from 134,106,486 million Jordanian dinars in 1980 to 6,623,192,234 million Jordanian dinars in 2018. According to the MIMIC model’s estimates when applied to Jordan, these developments were due to the changes in the previously mentioned causal factors that affect the hidden economy.
show that the general trend of Jordan’s hidden economy was upward during 1980–2018. Based on and , we can observe that the hidden economy peaked in the periods 1989–1992 and 2004–2007, with an average of 15.3% and 19.9% of GDP, respectively. These periods witnessed increased government budget deficit spending, prompting the Jordanian authorities to resort to external loans to bridge the internal budget deficit.
Figure 2. Trends in the hidden economy in Jordan GDP (%).
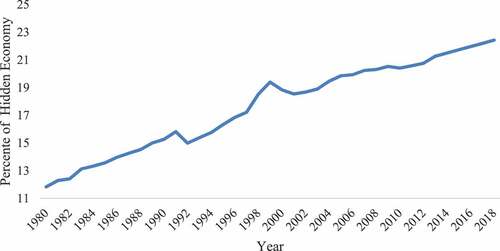
Figure 3. Trends in the value of jordan’s hidden economy (Million Jordanian Dinar).
The first peak period for Jordan’s hidden economy is 1989–1992. This period was characterized by a decline in the value of the Jordanian dinar, which depreciated by about 50%, leading the government to implement the first International Monetary Fund (IMF) economic adjustment program for this period. Following the 1990 Iraq-Kuwait crisis, the government was forced to stop both the IMF program and most foreign debt repayments. Foreign aid from the Gulf countries and remittances from Jordanian workers also decreased, and there was a huge exodus of Jordanian workers from the Gulf countries. Returning Jordanians and refugees from Kuwait and Iraq caused Jordan to experience serious economic problems.
Consequently, the government implemented many structural changes to control the budget deficit and save the economy. This included improving the tax system and increasing the ratio of domestic revenues to total public expenditure. During this period, the exchange rate of the Jordanian dinar was pegged to the US dollar, and it has remained so since 1994 (JD1 = US$1.4).
The second peak period for Jordan’s hidden economy was 2004–2007, which featured the post-economic adjustment program. This period was characterized by political, military, and economic instability in Iraq following the end of the 2003 Iraq War. The Jordanian economy performed remarkably well during this period, and the hidden economy flourished. An immediate effect was the sharp rise in oil and food prices in Jordan. As a result, the average growth in real GDP was 6.3%, and the unemployment rate decreased. The period was also marked by an increase in foreign direct investment (FDI) and a large inflow of Iraqi investors and refugees.
6. Results and discussion
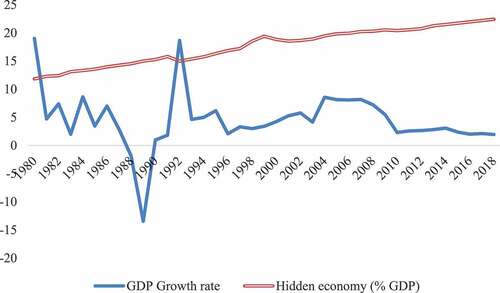
shows the trend in the hidden economy of Jordan and GDP growth during the period 1980–2018, revealing that the average size of the hidden economy in Jordan was 17.6% of GDP. It increased from 11.8% in 1980 to 22.4% in 2018. illustrates the inverse correlation between the hidden economy and GDP growth. These results are in line with findings by Dell’Anno et al. (Citation2007) and Dell’Anno (Citation2003), who discovered an inverse relationship between the official and hidden economies. It can be argued that the hidden economy maintains economic stability and that the presence of a flexible and productive hidden economy is now necessary and important for the success of the economy (Greenidge et al., Citation2005).
Figure 4. Trend in the hidden economy of Jordan and the GDP growth rate.
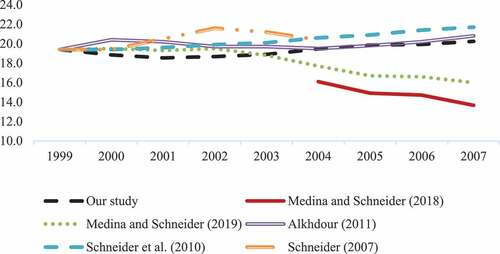
When the estimates of the hidden economy in Jordan are compared with those reported in four other studies that include Jordan for the same years, as shown in (Alkhdour, Citation2011; Medina & Schneider, Citation2018; Schneider, Citation2007; Schneider et al., Citation2010a), estimates are very close for most years. These are reported in and .
Table 4. Comparison of the estimated hidden economy in Jordan according to various studies % of GDP
Figure 5. Comparison of the estimated hidden economy in Jordan according to various studies (% of GDP).
As reported in , the empirical results provide support for most of our research hypotheses. The finding that inflation, total tax revenue, budget deficit, and the unemployment rate increased the size of the hidden economy is consistent with the hypothesis that the inflation rate positively influences the hidden economy in Jordan, the total tax revenue positively influences the hidden economy in Jordan, and budget deficit positively influences the hidden economy in Jordan, and the unemployment rate positively influences the hidden economy in Jordan, ceteris paribus.
Table 5. Summary of results
According to the previous results, total tax revenues, as expected, are significantly and positively impact the size of the hidden economy. Taxation is a significant source of revenue for the government, accounting for over 67 percent of Jordan’s total revenue. Because tax burden influences participation in the HE, we recommend major tax reforms and educational campaigns to improve tax compliance and tax morale. Among its MENA neighbors, Jordan has the highest tax revenues. Moreover, there is a lack of trust between taxpayers and tax authorities in Jordan. This means that tax rates should be reduced and rules clarified, encouraging more tax payments and compliance. After the reform, the size of the hidden economy will shrink. The tax burden is one of the other significant factors that may lead people to find jobs inside the hidden economy; an increase in the tax rate causes individuals to look for more “cash in hand” opportunities. These two results are compatible with prior research findings that increases in taxes and inflation lead to the hidden economy increases (Dell’Anno et al., Citation2018; Mazhar & Méon, Citation2017).
The second factor that has a significant and positive effect on the size of the hidden economy in Jordan is inflation. The continued increase of the inflation rate leads people to find other cheap resources compared with the formal economy. Thus, the demand for more affordable consumer goods and services will increase in the hidden economy, which is reflected in the size of the hidden economy. These results are in line with Schneider et al. (Citation2010)a, who show a positive relationship between inflation and the size of the HE in developing countries. They also demonstrate that when wages are sticky and constantly rising, price increases may result in greater participation in the HE than in the official economy. “It is due to the evidence that in a growing economy, people have many opportunities to earn a good salary and ‘extra money’ in the official economy” (Schneider et al., Citation2010a, p. 446).
Regarding the budget deficit, the results show that the budget deficit positively affects the hidden economy in Jordan, ceteris paribus. The government’s attempts to reduce the deficit have a direct positive effect on the hidden economy. That is, in implementing tighter fiscal policies such as increasing tax ratios and cutting its spending on goods and services, the government impels individuals to earn more cash in hand by transacting in the hidden economy.
The positive and significant effect of the unemployment rate on the hidden economy in Jordan is in line with Dobre et al. (Citation2010) and Mauleón and Sardà (Citation2017). They argue that a rise in the level of unemployment would lead to an increase in the hidden economy, as workers would instead be employed than jobless. The main result is consistent with Dell’Anno (Citation2007), who shows that the hidden economy’s participants are diverse. Part of these participants are unemployed, while others are retired, minors, and unemployed housewives. However, Tanzi (Citation1999) stated that people could work in both sectors.
Finally, the results show that the female participation variable has a negative effect on the hidden economy in Jordan, ceteris paribus. This effect may initially seem to be expected. However, the study by Hoyman (Citation1987) and Schneider (2012) also showed a negative impact of a higher level of female labor force participation on the hidden economy in their studies. They suggest that a higher level of female participation is associated with the country’s level of equality between men and women’s participation in the formal labor market, where more equality leads to lower female participation in the HE. Our study shows that the effect of improving the level of female participation in the official economy is also associated with a lower size of the hidden economy. The other hypotheses tested in this paper did not have any statistical significance.
6.1. Robustness test
These further tests were undertaken to check the robustness of our results and further test the validity of our results by taking the same specification of the causal variables for different sample sizes. For instance, using the same specifications for the different samples, the first estimation begins in 1981 and always ends in 2018, with alternative specifications such as 1981–2018, 1982–2018, and then 1983–2018. The second estimation begins in 1980 but does not end in 2018, with alternative specifications such as 1980–2017, 1980–2016, and 1980–2015. The MIMIC estimation results for the period 1980–2018 for Jordan are presented in .
Table 6. The MIMIC model results
It is clear from that these additional robustness tests indicate that, in most cases, budget deficit, female labor force participation, total tax revenue, inflation rate, and unemployment rate are highly statistically significant. This shows that the MIMIC results are robust.
7. Conclusion
The purpose of this study is to estimate the hidden economy in Jordan from 1980 to 2018 using the MIMIC estimation method. According to our findings, the average size of the hidden economy as a percentage of Jordan’s GDP from 1980 to 2018 is 17.6%. We also find that the total increase of tax revenue, budget deficit, unemployment rate, and inflation rate are the driving forces of the hidden economy in Jordan. Interestingly, we observed that female labor participation negatively affects the size of the hidden economy in Jordan.
The MIMIC estimation applied in this study of informal activities clearly provides a more complete picture of the hidden side of GDP. Economists and policymakers can use the results better to understand the causes and consequences of hidden economy and design more effective policy measures in the future.
Our study provides some policy recommendations that can help reduce the size of Jordan’s hidden economy. For example, from a normative standpoint, the emphasis must be placed on two main pillars: fiscal policy (i.e., budget deficit) and macroeconomic policy (i.e., female labor participation, unemployment, and inflation). In terms of fiscal policy, more reforms are required, with a particular emphasis on expanding the tax base while simultaneously lowering tax rates and reducing bureaucracy associated with tax collection. It is necessary to expand the technological options for tax payments that are already in place in order to ease tax payments. Government spending should be limited to the budget’s resources to avoid ad hoc spending, which necessitates tax rate increases.
Policymakers could convince employers in the hidden economy to enter into the official sector and comply with the rules of the official economy through some measures: i) reducing start-up costs and licensing fees for small businesses; ii) imposing one-time fees on investors; iii) simplifying the tax system; and iv) reducing taxes, including the granting of tax exemptions, especially for small businesses, to motivate them to enter the competitive market. Furthermore, policymakers in Jordan should increase female participation in the official economy, reduce inequality between the sexes, and empower women.
Finally, the overall results illustrate that the hidden economy can produce economic benefits for the Jordanian economy by creating employment opportunities and producing goods and services that benefit society. The government could manage the hidden economy through applicable economic policies since it indirectly actively reduces the nation’s budget deficit.
Disclosure statement
No potential conflict of interest was reported by the author(s).
Additional information
Funding
Notes on contributors
Mohammed Abu Alfoul
Friedrich Schneider is a Professor of Economics at the Johannes Kepler University in Linz. His research interests include General Economic Policy, Public Finance, Shadow Economy, Organized Crime, Privatization and Deregulation Policies, and Public Choice. Schneider has also published various articles in journals such as the Review of Economics and Statistics, The Economic Journal, and Public Choice.
Zakia Ahmad Mishal is a Professor of Economics at Yarmouk University in Jordan. Zakia is a specialist in Urban Economics, Economic Development, and Women Economics.
Mohammed Abu Alfoul is a PhD candidate in the Department of Accounting, Economics, and Finance School of Business, Law, and Entrepreneurship at the Swinburne University of Technology in Australia.
Khaled Magableh is a PhD candidate in the Department of Business and Management, Victoria University Business School in Australia.
Abeer Rafi Alabdulraheem is a master’s degree lecturer of Computer science at Imam Abdulrahman Bin Faisal University in Saudi Arabia.
Notes
2. Please see http://www.erfdataportal.com/index.php/catalog/138
3. For more details, please see Dell’Anno (Citation2007).
4. A detailed explanation of the variables is provided in the Appendix ().
5. A detailed explanation of the variables is provided in the Appendix ().
6. Please see () for more explanation of the variables.
7. See appendix . These tests were run by Eviews 10.
8. For more details please see Dell’Anno (Citation2007).
9. UN Women, Progress of the World’s Women 2015–2016, p. 147
References
- Alkhdour, R. (2011). Estimating the Shadow Economy in Jordan: Causes, Consequences, and Policy Implications (Unpublished Ph.D. Thesis). Colorado State University.
- Bajada, C., & Schneider, F. (2009). Unemployment and the shadow economy in the OECD. Review Economique, 60(5), 1033–28. https://doi.org/10.3917/reco.605.1033
- Cassar, A. (2001). An index of the underground economy in Malta. Bank of Valletta Review, 23(2), 44–62 doi:10.14505/tpref.v5.2(8).04.
- Central Bank of Jordan (various issues), Annual report (Amman: Central Bank of Jordan, research department), Amman, 2018.
- Charmes, J. (2007). Informal sector poverty and gender, A review of empirical evidence, paper prepared on behalf of Wiego (Women in formal employment globalizing and organizing), OECD and World Bank.
- Davidescu, A., Strat, V. A., & Paul, A. M. (2015). Revisiting the size of Romanian informal economy using the Gutmann Approach. Procedia Economics and Finance, 23, 1037–1045. https://doi.org/10.1016/S2212-5671(15)00546-8
- Dell’Anno, R. (2003). Estimating the shadow economy in Italy: A structural equation approach, Discussion Paper, Department of Economics and Statistics, University of Salerno.
- Dell’Anno, R. (2007). The shadow economy in Portugal: An analysis with the MIMIC approach. Journal of Applied Economics, 10(2), 253–277. https://doi.org/10.1080/15140326.2007.12040490
- Dell’Anno, R., Davidescu, A. A., & Balele, N. P. (2018). Estimating shadow economy in Tanzania: An analysis with the MIMIC approach. Journal of Economic Studies, 45(1), 100–113. https://doi.org/10.1108/JES-11-2016-0240
- Dell’Anno, R., Gómez-Antonio, M., & Pardo, A. (2007). The shadow economy in Three Mediterranean countries: France, Spain and Greece. A MIMIC Approach. Empirical Economics, 33(1), 51–84. https://doi.org/10.1007/s00181-006-0084-3
- Dell’Anno, R., & Schneider, F. (2009). A complex approach to estimate the shadow economy: The structural equation modelling. In Coping with Complexity of Economics (pp. 111–130). Milano: Springer Milan.
- Dell’Anno, R., & Solomon, O. H. (2008). Shadow economy and unemployment rate in USA: Is There a structural relationship? An empirical analysis. Applied Economics, 40(19), 2537–2555. https://doi.org/10.1080/00036840600970195
- Dobre, I., Alexandru, A. A., & Lepas, O. (2010). The USA shadow economy and the unemployment rate: Granger causality results. Journal of Applied Quantitative Methods, 5(1), 98–104.
- Feige, E. (1989). The meaning and measurement of underground economy. In E. Feige (Ed.), The underground economies: Tax evasion and information distortion (pp. 13–57). Cambridge University Press.
- Feld, L. P., & Schneider, F. (2010). Survey on the shadow economy and undeclared earnings in OECD countries. German Economic Review, 11(2), 109–149. https://doi.org/10.1111/j.1468-0475.2009.00466.x
- Giles, D. E., Tedds, L. M., & Werkneh, G. (2002). The Canadian underground and measured economies: Granger causality results. Applied Economics, 34(18), 2347–2352. https://doi.org/10.1080/00036840210148021
- Greenidge, K., Holder, C., & Mayers, S. (2005). Estimating the size of the underground economy in Barbados. In The annual review seminar Caribbean, Research Department, Central Bank of Barbados.
- Hassan, M., & Schneider, F. (2016a). Modelling Egyptian shadow economy: A MIMIC model and the currency demand approach. Journal of Economics and Political Economy, 3(3), 309–339.
- Hassan, M., & Schneider, F. (2016b). Size and development of shadow economies of 157 World wide countries, updated new measures from 1999-2013. Journal of Global Economics, 4(3), 1–14.
- Hoyman, M. (1987). Female participation in the informal economy: A neglected issue. The Annals of the American Academy of Political and Social Science, 493(1), 64–82. https://doi.org/10.1177/0002716287493001006
- Isachsen, A. J., & Strom, S. (1985). The size and growth of the hidden economy in Norway. Review of Income and Wealth, 31(1), 21–38. https://doi.org/10.1111/j.1475-4991.1985.tb00496.x
- Johnson, S., Kaufmann, D., Shleifer, A., Goldman, M. I., & Weitzman, M. L. (1997). The unofficial economy in transition. Brookings Papers on Economic Activity, 1997(2), 159–239. https://doi.org/10.2307/2534688
- Johnson, S., Kaufmann, D., & Zoido-Lobaton, P. (1998). Regulatory discretion and the unofficial economy. The American Economic Review, 88(2), 387–392.
- Lemieux, T., Fortin, B., & Frechette, P. (1994). The effect of taxes on labor supply in the underground economy. The American Economic Review, 84(1), 231–254.
- Macias, J. B., & Cazzavillan, G. (2010). Modeling the informal economy in Mexico. A structural equation approach. The Journal of Developing Areas, 44(1), 345–365. https://doi.org/10.1353/jda.0.0077
- Mauleón, I., & Sardà, J. (2017). Unemployment and the shadow economy. Applied Economics, 49(37), 3729–3740. https://doi.org/10.1080/00036846.2016.1267844
- Mazhar, U., & Méon, P. G. (2017). Taxing the unobservable: The impact of the shadow economy on inflation and taxation. World Development, 90, 89–103. http://dx.doi.org/10.1016/j.worlddev.2016.08.019
- Medina, L., & Schneider, F. (2018). Shadow economies around the world: What did we learn over the last 20 years? IMF Working Paper No. 18/17, Washington, D.C.
- Medina, L., & Schneider, F. (2019). Shedding Light on the Shadow Economy: A Global Database and the Interaction with the official one. CESifo Working Paper Series 7981, Munich, Germany.
- Mogensen, G. V. (1995). The shadow economy in Denmark 1994: Measurement and results. Study No. 3, Copenhagen, The Rockwool Foundation Research Unit.
- Sauka, A., & Schneider, F. (eds). (2016). Entrepreneurship and the Shadow Economy. Edward Elgar Publishing Company.
- Schneider, F. (2005). Shadow economies around the world: What do we really know? European Journal of Political Economy, 21(3), 598–642. https://doi.org/10.1016/j.ejpoleco.2004.10.002
- Schneider, F. (2007). Shadow economies and corruption all over the world: New estimates for 145 countries. The Open Access Open Assessment. E Journal 1 , (2007), 09 https://doi.org/10.5018/economics-ejournal.ja.2007-9.
- Schneider, F. (2015). Size and development of the shadow economy of 31 European and 5 other OECD countries from 2003 to 2014: Different developments? Journal of Self-Governance and Management Economics, 3(4), 7–29.
- Schneider, F., & Buehn, A. (2013). Estimating the size of the shadow economy: Methods. Problems and Open Questions. Turkish Economic Review, 3(2), 256–280.
- Schneider, F., & Buehn, A. (2018). Shadow economy: Estimation methods, problems, results and open questions. Open Economics, 1(1), 1–29. https://doi.org/10.1515/openec-2017-0001
- Schneider, F., Buehn, A., & Montenegro, C. E. (2010). New estimates for the shadow economies all over the world. International Economic Journal, 24(4), 443–461. https://doi.org/10.1080/10168737.2010.525974
- Schneider, F., Buehn, A., & Montenegro, C. E. (2010). Shadow Economies All Over the World: New estimates for 162 countries from 1999 to 2007. In F. Schneider (Ed.), Handbook on the shadow economy. Edwin Elgar 5356 .
- Schneider, F., & Enste, D. H. (2000). Shadow economies: Size, causes, and consequences. Journal of Economic Literature, 38(1), 77–114. https://doi.org/10.1257/jel.38.1.77
- Smith, P. M. (1997). Assessing the Size of the underground economy: The statistics Canada perspective. Canadian economic observer, catalogue no.: 11-010, 3.16-33, at 3.18.Spiro, Peter S. (1993): “Evidence of a Post-GST increase in the underground economy. Canadian Tax Journal/ Revue Fiscale Canadienne, 41(2), 247–258.
- Tanzi, V., 1999. Uses and Abuses of Estimates of The Underground Economy. The Economic Journal, 109(456), F338–F347.
- United Nations Development Program (UNDP) (2013). The informal sector in the Jordanian Economy’. United Nations Development Programme, United Nation University. https://www.jo.undp.org/content/jordan/en/home/library/democratic_governance/Informal_sector_gov.html
- Vo, D. H., & Ly, T. H. (2014). Measuring the shadow economy in the ASEAN nations: The MIMIC approach. International Journal of Economics and Finance, 6(10), 139–148. http://dx.doi.org/10.5539/ijef.v6n10p139
- Williams, C. C., & Schneider, F. (2016). Measuring the global shadow economy: The Prevalence of informal work and labor. Edward Elgar Publishing Company.
Appendix
Table A1. Causes of the hidden economy
Table A2. Indicators of the hidden economy
Table A3. ADF test for the MIMIC approach variables