
 ?Mathematical formulae have been encoded as MathML and are displayed in this HTML version using MathJax in order to improve their display. Uncheck the box to turn MathJax off. This feature requires Javascript. Click on a formula to zoom.
Abstract
This research offers a comprehensive review of the volatility spillover patterns in the Gulf Cooperation Council (GCC) stock market indexes covering daily data from 2/1/2004 to 5/11/2020. During this period, stock markets experienced fluctuations due to unexpected shocks, such as the international financial crisis, oil price shocks and, lately, the pandemic of COVID-19. The findings reveal a substantial increase in the connectedness of returns and volatilities in the GCC bloc during high stress periods with the COVID-19 era marking a historical high. That said, the results do not support significant changes in the directional patterns of volatility during the pandemic.
PUBLIC INTEREST STATEMENT
This research offers a comprehensive review of the risk spillover patterns in the Gulf Cooperation Council (GCC) stock market indexes covering daily data from 2/1/2004 to 5/11/2020. The sample period is highlighted with many turbulent periods including the international financial crisis, oil price shocks and the pandemic of COVID-19. The findings reveal a substantial increase in the risk spillover in the GCC bloc during high stress periods with the COVID-19 era marking a historical high. That said, the results do not support significant changes in the originators of risk transmissions across the region. Finally, the findings of the paper carry insights for policy-makers interested in preserving financial stability.
1. Introduction
Motivated by increased stock market integration and heightened fears associated with the recent Corona pandemic, we examine the volatility spillover patterns in the oil-rich Gulf Cooperation Council (GCC) bloc. Principally, we study the intensity and direction of spillovers during calm and high stress periods with a focus on the COVID-19 era. To describe the volatility spillover dynamics, we follow the spillover index method devised by Diebold and Yilmaz (Citation2012,Citation2009). The understanding of volatilities and markets developed here will be of interest to GCC policy-makers, investors and academics alike.
Financial markets are dynamic in nature and increasingly exhibit higher levels of financial and economic integration (Beine et al., Citation2010). This is already with us considering the substantial rise in cross-border capital flows and the decrease in financial barriers (Agenor, Citation2001). This tendency necessitates up-to-date assessment of the dynamics of financial markets. Another motivation to conduct this study stems from an argument proposed by Goodell (Citation2020) of long-term adjustments to financial systems resulting from the impact of the COVID-19 pandemic, including an increased potential for lower reliance on leverage by firms and a larger sensitivity to equity risk. Indeed, such changes in the dynamics of financial markets are harmful to diversification benefits and could impact the way shocks are transmitted among financial markets. In essence, the spread of the Coronavirus, which started in January-March 2020, has severely affected the financial markets around the world over a short period of time and the impact of this global response to the pandemic is historical and unprecedented when compared with deadlier viruses including the Spanish Flu in 1918 (Baker et al., Citation2020).
Zhang et al. (Citation2020) in his paper asserts that the risks in financial markets around the world have increased significantly in response to the COVID-19 pandemic, with financial markets becoming highly volatile and unpredictable. In the same vein, Ashraf (Citation2020) finds a decline in stock market returns in 64 countries as a response to the increase in COVID-19 pandemic cases. Finally, Bissoondoyal-Bheenick et al. (Citation2020) find, similar to other crises, a direct relationship between the severity of the COVID-19 pandemic and the connectedness between financial markets.
While the COVID-19 threat is global in nature, the unique position of GCC nations as oil-dependent economies is an additional risk, especially with the recent plummet in oil prices. Corbet et al. (Citation2020) note that the fall in demand due to the COVID-19 pandemic was linked to the drop in oil prices to almost $20 per barrel. Despite supply side interventions by oil producers, they maintain that WTI oil price difference reached a historical negative pricing as a consequence of low demand and inadequate storage capacity.
Even with their higher volatility levels, emerging markets enjoy higher average returns and low links with developed markets (Bekaert & Harvey, 1997a), so, they are targeted to secure benefits from cross-country diversification (Bekaert & Urias, Citation1996). Still within the umbrella of emerging markets, frontier markets are known for their small capital and limited integration with global markets (Bley & Saad, Citation2012). Yet, frontier markets demonstrate long-run growth potential thanks to their early stage of economic expansion (Chen et al., Citation2014).
The GCC countries have taken remarkable measures to enhance intra-regional financial integration and the development of their financial markets (Neaime, Citation2016). Consequently, in 2014, the MSCI upgraded the classification of both Qatar and the United Arab Emirates (UAE) from frontier to emerging markets, while the market of Saudi Arabia joined the MSCI list of emerging markets in 2019. Meanwhile, the rest of the GCC markets (i.e. Kuwait, Oman and Bahrain) are still classified as frontier markets. Discussing the peculiarities of the GCC markets, Balcilar et al. (Citation2015) argue that fundamental global uncertainties driving returns in advanced stock markets, such as credit market problems and global issues, impact the GCC markets in a different way. They attribute these differences to the following factors: first, the segmentation of the GCC markets when compared to other emerging markets; second, the nature of their exposure to oil prices as the GCC countries hold substantial oil and gas reserves; finally, the existence of sizeable foreign asset reserves and sovereign wealth funds. In essence, the GCC countries are in a good position to attract global funds given their low taxes, stable currencies and enormous hydrocarbon reserves. Except for Kuwait, the GCC nations adopt a pegged exchange rate regime to the $US, therefore forcing the financial authorities to harmonise their monetary policy with that of the US. Recognizing these characteristics, the GCC markets constitute a promising destination to secure investment and diversification gains for regional and international investors.
The flow of information across the GCC stock markets is considered a major determinant of cross-country return and volatility transmission patterns. The GCC countries share common characteristics. First, their economies are based on oil and gas. Therefore, volatility in oil prices is expected to impact their economies and consequently the return and volatility of their financial markets. Second, information transmission among the GCC markets could be due to the high integration and trade liberalisation agreements implemented over time. Although this integration improves the competitive power of the region, it inherently increases their vulnerability to shocks transmitted from one country to another. Hence, the results of this paper can provide the GCC policy makers with valuable insights on the track and intensity of spillovers within the region which can contribute to their efforts in preserving financial stability.
In this paper, we model the volatility spillovers in the GCC markets using the Diebold and Yilamz (Citation2009, Diebold & Yilmaz, Citation2012) connectedness index over a period ranging from 2 January 2004 to 11 November 2020. From a modelling viewpoint, this methodology has many attractive features: firstly, the simplicity of estimation; secondly, the ability to incorporate many variables in one system without suffering from over parameterisation as experienced in the GARCH family models; thirdly, modelling volatility and return spillovers is conducted separately; and, finally, the ability to measure the spillover transmission mechanism in a time-varying environment. The data are of daily frequency and incorporate different control variables related to different global shocks such as the large swings in oil prices, the 2008 financial crisis, and the COVID-19 pandemic.
We contribute to the literature from several angles: first, we add to the emerging markets literature by focusing on the GCC as a peculiar, oil-rich subset of emerging economies; second, we contribute to international finance literature wherein the study of volatility transmission is a main constituent; and finally, we join the discussion of the economic impact of COVID-19 on global financial markets.
This paper provides a literature review and demonstrates the methodology and empirical data, variables and results. This research can provide valuable insights to investors and fund managers who are attempting to diversify their portfolios and has further implications for stock exchange regulatory bodies to evaluate the different rules being set on issues such as price limits or margin setting. This is relevant since the GCC authorities set price limits, in which daily stock prices are not allowed to move beyond 10%.
2. Literature review
From the theory standpoint, this paper follows the hypothesis of heat waves and meteor showers described by Engle et al. (Citation1990). The hypothesis of heat waves asserts that most of the volatility sources are due to country-specific factors whereas the meteor shower points to shock transmission between different markets.
For the GCC bloc, two related strands may be identified. The first strand relates to stock market linkages and the transmission of shocks among the financial markets. For example, Neaime (Citation2016) reports significant return and volatility spillovers from Bahrain to both Saudi Arabia (KSA) and Kuwait. The researcher suggests that international investors would benefit from diversifying opportunities in the GCC markets. In a related study, Abraham and Seyyed (Citation2006) implement a bivariant conditional volatility (EGARCH) model to examine the volatility spillovers across the KSA and Bahrain using daily data from 1998 to 2003. The authors find an asymmetric information flow from Bahrain to the KSA. Awartani et al. (Citation2013), on the other hand, find that the KSA market is the main information transmitter to other GCC stock markets. They attribute this to the dominance of the Saudi market as the region’s largest in terms of market capitalisation and liquidity.
On the other hand, using daily stock market indices over the period from 3 January 1999 to 31 December 2004 Alkulaib et al. (Citation2009) find that the UAE market leads all other GCC markets, attributing this to fast growth in UAE financial markets.
Recently, Ziadat et al. (Citation2020) investigate information transmission patterns for the GCC financial markets from 2004 to 2019. Implementing both the Dynamic Conditional Correlation (DCC) model and the Diebold-Yilmaz spillover index to assess market linkages, the authors report a statistically significant return and volatility spillovers from both the US and the EU stock markets to the GCC markets. Consistent with the results found by Hung (Citation2021) and Alkulaib et al. (Citation2009), the researchers find the UAE market to be the main transmitter of return and volatility shocks in the GCC bloc.
A second strand of literature concentrates on the so-called financial contagion. For example, Ghorbel and Boujelbene (Citation2013) employ GARCH models to examine the conditional correlations and volatility spillovers between US, BRICFootnote1 and GCC stock markets from May 2005 to December 2011. They find evidence of a contagion effect during the 2008 financial crisis on both the BRIC and the GCC markets. Aloui and Hkiri (Citation2014) investigate both the long-term and the short-term dependence among the six GCC stock markets from 2005 to 2010. Using the wavelet technique, which helps to measure interdependence in time and frequency spaces, the researchers report an intensified level of co-movements among GCC financial markets during the Subprime crisis. In a related study, Neaime (Citation2016) reports a devastating impact on Kuwait, UAE, and Qatar through the trade and financial channels. Benlagha and El Omari (Citation2021) use oil prices, gold prices, the volatility of the S&P 500 index, and the world economic policy uncertainty index to explain the dynamic linkages of the Qatari market globally. Recently, Abid et al. (Citation2019) investigate the impact of oil price volatility on the interdependence between the US and the stock markets of the MENAFootnote2 region over the period 1 January 2004 to 1 November 2008. Using a multifactor model, their results point to the existence of financial contagion running from the US to the GCC markets. In essence, the researchers show the important role played by gas and oil markets in increasing the contagion between the US equity market and that of the GCC during market turmoil.
Given the recent emergence of the COVID-19 pandemic, a limited number of research papers investigates the impact of the pandemic on stock exchanges, stock market interdependence and volatility spillovers. Hence, we will focus on some of the research articles investigating the impact of the COVID −19 pandemic on different markets. For instance, Bissoondoyal-Bheenick et al. (Citation2020) examine the impact of the COVID-19 pandemic on return and volatility interdependence in G20 countries. They find a dramatic increase in the interdependence of both return and volatility across the different stages of the COVID-19 pandemic. In a recent study and using a DCC-GARCH framework and data from 1 May 2019 to 30 May 2020, Derbali et al. (2021b) provide evidence of the predictive ability of COVID-19 in explaining the correlation between the Chinese stock market and the markets of Japan, US, Canada, Russia, UK, Germany, Spain, France and Italy. In the same vein, Derbali et al. (2021a) demonstrate significant predictiveFootnote3 ability of COVID-19 innovations as determinants of the correlation among Bitcoin and Gold returns and volatilities. Interestingly, the results show that the Bitcoin-Gold correlation is more responsive to US-based COVID-19 innovations when compared to the Chinese ones.
3. Research methodology
The study follows the Diebold and Yilmaz (Citation2009, Diebold & Yilmaz, Citation2012) volatility spillover measure, that relies mainly on the forecast error variance decompositions from primary vector autoregressive. Their model is effective in measuring not only previous and current crises but also system-wide spillovers. The researchers utilise the variance decomposition suggested by both Koop et al. (Citation1996) and Pesaran and Shin (Citation1998) so maintaining the advantages of their general framework and circumventing Cholesky order variant classification.
The general k-variable and p-lagged VAR model is given by:
Where: xt is a vector of k endogenous variables. In this paper it refers to either stock index returns or volatilities; φ is a kxk matrix of parameters for each time p; εt (0, Σ) is a vector of disturbances which are assumed to be identically and independently distributed (iid) over time. Assuming stationarity of the covariance, we can rewrite Equationequation (1)(1)
(1) in an infinite moving average form as follows:
In Equationequation (2)(2)
(2) , Ai refers to the parameter matrices, which are defined recursively such that:
A1 = φ1Ai-1+ φ2Ai-2 + … + φpAi-p, with A0 is a kxk identity matrix. The decomposition of the variance allows us to calculate the proportion of the H-step ahead error variance in predicting our endogenous variables xi due to shocks that materialise from xj, where i ≠ j.
In order to compute the variance decomposition, we need innovations which are orthogonal. In certain identification schemes, such as that of Cholesky factorisations orthogonalise innovations, however the recognised decompositions are consequently based on how the variables are ordered. Given that we concentrate in our study on the direction of spillovers, it is preferable to use the decomposition scheme which is invariant to ordering. Thus, we implement the generalised Vector Auto Regressive (VAR) model as suggested by Koop et al. (Citation1996), and ; the KPPS), as their models satisfy previously mentioned objectives. The main advantage of using generalised VAR is that it assesses the contemporaneous innovations by using the historical observed error distributions. Thus, it is able to identify robust correlated innovations and variance decompositions which stay the same regardless of the order of markets.
The forecast error of H-step-ahead variance decomposition is captured in the following Equationequation (3)(3)
(3) :
Where: Σ refers to the estimated variance matrix of the error vector and σii is the estimated standard deviation of the error term for variable I; and ei is the selection vector which takes a value of one for the ith element and zero otherwise.
Next we normalise all of the elements in the matrix of variance decomposition by the sum of the elements of each row of the decomposition as follows:
The normalisation is done to make sure that under the cross-element as well as own variance contribution, by construction, adds to one under the generalised decomposition with and
.
The total spillover index is then defined as:
The directional spillover to variable i from all other variables j is given by:
With the reverse, i.e., from market i to all other markets j is given by
Thus, the net spillover from markets i to markets j is calculated by taking the difference between Equationequation (7)(7)
(7) and Equationequation (6)
(6)
(6) as follows:
The net spillover measure in Equationequation (8)(8)
(8) , identifies the net country transmitter or net receiver in the system. We apply the total spillover index to examine the trends of regional and local spillover activity. As in Diebold and Yilmaz (Citation2009, Diebold & Yilmaz, Citation2012), we employ a VAR with two-lags, 200-days window length and a forecast horizon of 10-days.
4. Data and variables description
We rely on daily closing prices of the seven GCC stock markets, namely the Kingdom of Saudi Arabia (Tadawul All Share Index; TASI), Kuwait Stock Exchange Index (KSE), Bahrain Stock Exchange Index (BSE), Abu Dhabi Index (ADX), Dubai Financial Market Index (DFM), Oman Stock Exchange (OSE) and Qatar Stock Exchange Index (QSE). Implementing daily data in volatility models is preferable since using less frequent data ignores large amounts of information which prevails in the underlying daily data.
The sample period starts from 2 January 2004 and ends 5 November 2020, with a total number of 4396 observations. Stock indices and oil prices are collected from DataStream. In addition, we use “Equity Market Volatility: Infectious Disease Tracker” from the Federal Reserve Bank of St. Louis to capture the economic uncertainty aspect of the pandemic. Finally, we resort to the “OxfordFootnote4 COVID-19 Government Response Tracker” for the GCC bloc to highlight government policy impact.
We calculate the return series as the percentage change in daily closing stock prices through applying the natural logarithmic difference. The plots of daily closing prices and daily returns of the seven GCC stock price indices are provided in , consecutively.
Figure 1. The plots of daily stock price indexes.Abu Dhabi Index (ADX); Bahrain Stock Exchange Index(BSE); Dubai Financial Market Index(DFM); Kuwait Stock Exchange Index (KSE); Oman Stock Exchange (OSE); Qatar Stock Exchange Index (QSE); and Saudi Arabia Tadawul All Share Index;(TASI).
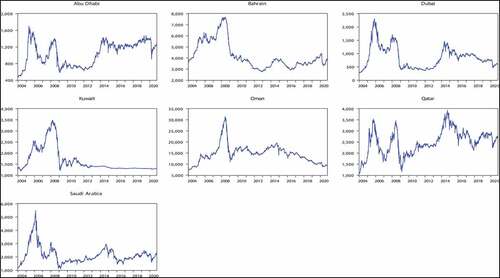
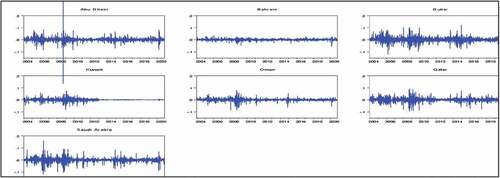
Figure 2. The plots of daily stock returns.Abu Dhabi Index (ADX); Bahrain Stock Exchange Index(BSE); Dubai Financial Market Index(DFM); Kuwait Stock Exchange Index (KSE); Oman Stock Exchange (OSE); Qatar Stock Exchange Index (QSE); and Saudi Arabia Tadawul All Share Index;(TASI).
reports the plots of the daily GCC stock price indices. The figures show some similarities in the trending behaviour of the GCC markets. The stock prices of all the GCC indices show an increase and stability from 2004 to 2007, before they dropped significantly during the financial crisis of 2007–2009. The drop in oil prices during the 2014–2016 period also led to a significant decline in stock price indices for oil-reliant GCC economies. Furthermore, prices show another plunge during the COVID- 19 pandemic in 2020. The plots of price series also show non-stationary price series.
shows the plots of GCC stock markets’ daily return indices. We can note similarities in return clustering among all the GCC stock markets during the periods of the financial crisis, the period of oil plunge (2014–2016) and during the COVID-19 period (beginning 2020).
Volatility of daily returns is calculated using the GARCH methodology, which utilises today’s information of the stock price index and that information from previous days. Within this, we chose the optimal GARCH specification based on the Akaike information criteria. The typical GARCH (1, 1) is chosen for Dubai, Bahrain, Oman and Kuwait. At the same time, the (asymmetric) EGARCHFootnote5 (1, 1) model is used to generate the volatility series in Abu Dhabi, Qatar and Saudi Arabia. shows the plots of the conditional volatility (generated from GARCH models) for all the markets under investigation.
Figure 3. The plots of GARCH volatility.Abu Dhabi Index (ADX); Bahrain Stock Exchange Index(BSE); Dubai Financial Market Index(DFM); Kuwait Stock Exchange Index (KSE); Oman Stock Exchange (OSE); Qatar Stock Exchange Index (QSE); and Saudi Arabia Tadawul All Share Index;(TASI).
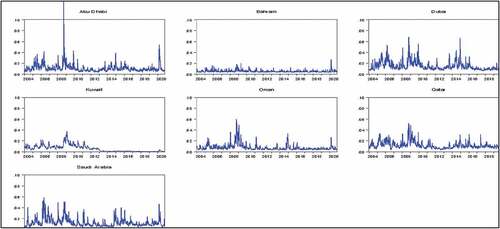
displays the plots of the GARCH volatility of the seven GCC stock market indices. These series show few peaks describing the turmoil periods with short durations, while in other periods it shows longer periods of low volatility. The figure also shows evidence of similar patterns for the markets during the financial crisis of 2007–2009, the period of oil drop in 2014–2016 and the period of the COVID-19 pandemic. However, we notice that some markets were more volatile (e.g., Abu Dhabi, Dubai, Qatar, Kuwait and the Kingdom of Saudi Arabia) and other markets less so (e.g., Oman and Bahrain).
depicts the descriptive statistics of stock return indices, and the conditional volatility (GARCH) for all indices under investigation. The average returns of all the indices are quite low but positive over the whole period. Standard deviations of return indices are close to zero, suggesting low deviation from the mean. The highest standard deviation is detected in the DFM Index (0.0166) and the lowest is detected in the BSE index (0.0056), thus DFM is the most volatile market. To examine the asymmetry threshold effect, we check the skewness of the return indices. Except for Bahrain, skewness of all return indices is negative, which implies that the returns distributions are skewed to the left. Results also show that the kurtosis for all indices is quite high, which means that the return distributions are heavy tailed. The results of Skewness, Kurtosis and Jarque-Bera suggest that our return series are not normally distributed and thus deviate from Gaussian distribution.
Table 1. Descriptive statistics of stock returns, conditional volatility and square volatility: daily data from 2 January 2004–5 November 2020
The same table also shows the descriptive statistics for the indices’ GARCH volatility. Results show that the mean of GARCH volatility is quite low for all indices and range between 0.007 for Oman and 0.015 for Dubai. In addition, both skewness and kurtosis figures indicate a departure from normal distribution, which is consistent with the outcome of the Jarque-Bera statistics.
5. Empirical results
We present in this section the analysis of the seven GCC countries’ stock market daily return indices and daily time series of volatility spillovers index values. In our construction of spillover matrices for our return () and volatility (), we use a VAR system with two lags, a moving window of 200 days and 10-steps ahead forecast.
Table 2. Static return spillover
Table 3. Static volatility spillover
6. A. return spillover
illustrates the spillover matrix for returns which expresses the fraction of the forecast error variance of one market returns due to shocks from/to another country. Each entry of the spillover matrix in the table corresponds to the estimated contribution to the forecast error variance of one country’s index coming from shocks to another country’s return index.
shows that the total return spillover index is 30.3 percent, indicating that 30.3 percent of the change in returns indices is due to the interaction and connectedness among the GCC markets. Thus, the information transmission among the stock returns of these countries is around 30%. The total contribution of different markets to the rest of return indices ranges from 11.8 to 55.8. This big range implies that these indices are heterogeneous in terms of information transmission intensity. Furthermore, the raw titled “to others” shows that the index that contributes the most to the system is DFM (55.8%) followed by ADX (40.2%) and the market with the least spillover to the system is the KSE (14%). also shows that the most affected market by the other markets is DFM (42.9%). Thus, we see that the Dubai financial market has the largest impact on the other markets return indices, at the same time it is the most affected by the other markets. This means that Dubai is a net contributor to the system, highly integrated intra-regionally and a dominant force within the region.
The table also depicts the results of net pair-wise directional spillovers. Results indicate that TASI, DFM and ADX are the net transmitters of information to other markets, while the other markets are net recipients of information shocks.
6.1. Dynamic return spillover index
From a time varying perspective, we calculate the dynamic spillover series with a rollover window of 200 days and 10-step ahead forecast horizons to analyse the time varying characteristics of the total return spillover index. plots the time varying total return spillover index. Evidently, we can identify three periods of high return spillover during the total period. The first period with a total spillover above 50% is between 2008 and 2010. This high spillover corresponds to the period of the financial crisis. The second abnormal period is associated with the oil price crash of 2014–2016 which reduced the income generated to the GCC countries as their economies are based mainly on oil. The third period (2019–2020) relates to the catastrophe of the COVID-19 pandemic which triggered an extraordinary level of information transmissions in the GCC bloc.
Figure 4. Time varying return spillover from VAR system with two lags, 200-day window and 10 step horizons.
7. B. conditional volatility spillover
7.1. The static system of conditional volatility spillover
Volatility in this paper is estimated using the GARCH methodology to capture the stylised facts of stock returns such as time variations in conditional volatility, asymmetry and volatility clustering. (A-1) reports the results of the conditional volatility spillover matrix of the GCC bloc. Each component in the matrix (i, j) corresponds to the estimated contribution to the forecast error variance of market i coming from shocks in market j. The raw sums “contribution to others” provides the total directional connectedness to the other indices from i, while the column sums “from” refers to the total directional connectedness from all indices to market i. The diagonal figures where i = j represent the own variance index estimates, indicating the forecast error variance of a market coming from its own shocks.
The total volatility spillover index results () of the complete sample is 24.10 percent, less than that of the return spillover index. This implies that the connectedness level is higher in returns as compared to volatility. The values of the conditional volatility “from others” range from 12.8% (KSE) to 34 (OSE), however the impact of the conditional volatility index on other markets is smaller. The least affected by the system shocks is KSE (12.8%), while OSE is the most affected by system shock followed by DFM (32.3%) and QSE (31.9%). Results also show that the volatility spillovers from TASI (42.7%) exert the highest influence on the system, while OSE (34%) is the most affected by the system’s shocks. Interestingly, while TASI’s contribution to the system ranks the highest (42%), shocks to TASI from the GCC exert marginal impact on TASI’s volatility (17%). This makes TASI the most exogenous market in the GCC bloc, which could be related to the large market capitalisation of the TASI (Saudi Arabia constitutes around 50% of the GCC’s total capitalisation) and its influence on oil prices via OPEC.Footnote6
The net-pairwise directional index results, also in , show the net transmitters of volatility to other markets as DFM, QSE and TASI, while other markets are net recipients of shocks.
7.2. The dynamic conditional volatility spillover
In the previous section we analysed the volatility spillover from a static perspective which assumes a constant connectedness between stock markets. In this way, the analysis may ignore or smooth over jumps resulting from different shocks during the period of study. Hence, the dynamic perspective allows us to link the periods of abnormal connectedness with specific global events. The calculation of the time varying volatility spillover index is conducted using a rollover window of 200-days and ten-step forecast horizons.
Plotting the time varying volatility spillover index to uncover time varying patterns () highlights three distinctive periods marked by intense spillovers. The first period with a recorded jump in spillover patterns (above 50%) concurred with the financial crisis 2008 and 2010. Another jump in the volatility spillover patterns precipitated the oil price plummets between 2010 and 2016. Finally, the spillover index reached 70% in the wake of the COVID-19 pandemic in 2020. In essence, while different crises coincided with notable volatility spillover hikes, the COVID-19 era in 2020 precipitated an unprecedented level of volatility spillovers. This echoes the severity and fear associated with this pandemic even when compared with the Subprime Crisis of 2008.
Figure 5. Time varying total conditional volatility spillover (GARCH) from VAR system with two lags, 200-day window and 10 step horizons.
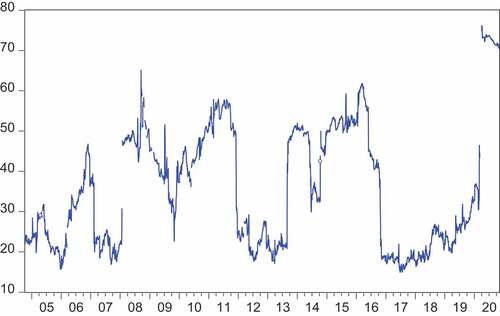
Overall, the spillover index readings remain relatively low which could be linked to the fact that these markets are emerging and thus less interconnected when compared with their developed counterparts. Moreover, the volatility links tend to boom and bust quickly during and after stress periods. This tendency opposes the link in returns where they have an up trending and gradual demeanour (see, Diebold & Yilmaz, Citation2009, Diebold & Yilmaz, Citation2012). Finally, concerning the difference between the COVID-19 and the Subprime crises, we note that the differences are largely due to the economic nature of the former and the pure financial nature of the latter.
depicts the net spillover patterns from the system to each GCC market. The visual inspection reveals considerable fluctuations in net spillovers over the investigated period. Interestingly, most of the GCC markets act as volatility receivers and yet, it is apparent that Saudi Arabia acts as the least recipient of volatility spillovers, followed by Abu Dhabi. Conversely, the frontier markets of Bahrain, Kuwait and Oman are the most vulnerable to spillovers.
Figure 6. Net spillover to all GCC markets.
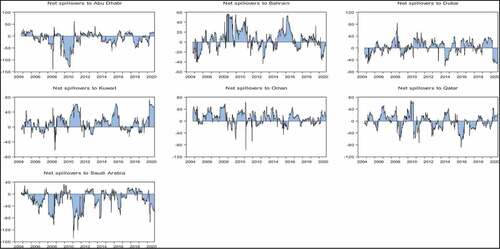
Given the uncertainties, during the financial crisis (2008–2010), a high spillover of volatility among financial markets prevails. Kuwait, Dubai, and Bahrain were the most recipients of volatility spillover, while TASI and Abu Dhabi were the least net recipients (i.e. net transmitters) of volatility spillovers. While both of these markets are among the most dynamic in the region, this can be related to the enormous oil production which generates substantial revenues capable of easing market related fears. Likewise, shocks in these markets, that enjoy an oil-financed safety cushion, can spread fear across the region.
It is interesting to note that during COVID-19 era, Kuwait was the highest net recipient of volatility transmitted by other GCC countries, followed by Oman, Qatar and Abu Dhabi, While Saudi Arabia (TASI), Bahrain and Dubai were net transmitters of volatility spillover for the other countries.
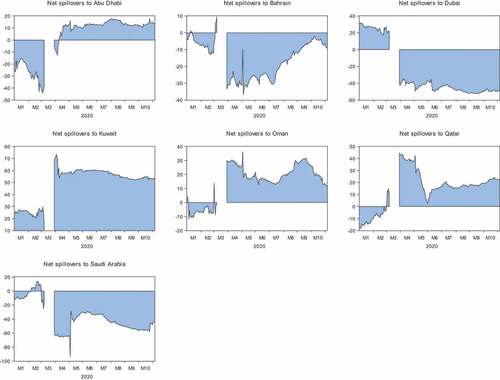
illustrates the net spillover of volatility during the COVID-19 pandemic. The figure shows that the net transmitters of volatility spillover are Saudi Arabia, Bahrain and Dubai. Other countries are considered net recipients of volatility spillover from the rest of the GCC block. The figure also shows the weight TASI plays in transmitting the volatility spillover to the rest of the GCC countries, as the volatility transmitted exceeds 60%.
Figure 7. Net volatility spillover from all countries to each single country during the COVID-19 pandemic.
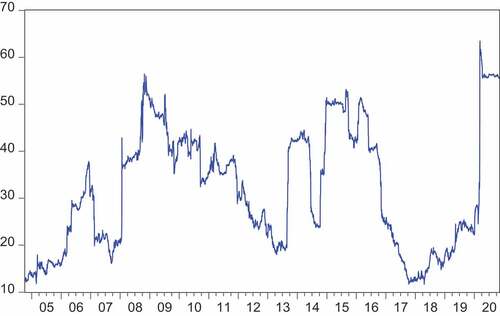
The high volatility spillovers seem to be synonymous with the COVID-19 era. Indeed, this could stem from a variety of factors which coincided with the pandemic. To explain our results, we focus our attention on two measures that reflect uncertainty. First, we exploit the “Equity Market Volatility: Infectious Disease Tracker” to capture the economic uncertainty aspect of the pandemic. Second, we resort to the “Oxford COVID-19 Government Response Tracker” for the GCC bloc to highlight the government policy impact.
The Equity Market Volatility: Infectious Disease Tracker identifies three indicators: stock market volatility, newspaper-based economic uncertainty and subjective uncertainty in business expectation surveys to quantify the changes in economic uncertainty (Baker et al., 2021).
This index is based on textual analysis gathering daily newspaper articles in around 3000 US newspapers that enclose at least one term out of four sets of terms; economic, financial, volatility, and epidemic. The latter segment incorporates the terms virus, flu, disease, coronavirus, MERS, SARS, Ebola, H5N1, H1N1.
shows the equity market volatility of the infectious disease tracker. From the figure, we can see a sharp increase in uncertainty during the month of March which precipitated the increase in global fears from the ramifications of the COVID-19 pandemic.
Figure 8. Equity market volatility: infectiousFootnote7 disease tracker.
The Oxford COVID-19 Government Response Tracker provides an aggregate and comparable measure of individual policy actions among nations to track the stringency of government responses to COVID-19 over time (Hale et al., Citation2020).
illustrates a spike in government responses in all GCC nations starting from March 2020. Also, the government responses appear to be harmonised across the GCC bloc. Such policies include travel bans, quarantines, and other curfew measures.
Figure 9. OxfordFootnote8 COVID-19 government response tracker for the GCC bloc.Source: Hale, T. and Webster, S., 2020. Oxford COVID-19 government response tracker.
In essence, we argue that the unprecedented spike in volatility spillovers during the COVID-19 epidemic can be triggered by cash flow uncertainties that are transmitted by the time variation in risk appetite.
8. Robustness check
Since today’s stock prices are affected by the previous days, it could be argued that volatilities using the GARCH method might produce a smoothened volatility series. Hence, to ensure the authenticity of our results, we employ the square root of squared returns as a second volatility estimate. We opt for this measure in lieu of the range volatility because daily highs and lows are not available for the GCC markets.
(section A-1) outlines the volatility spillover matrix in the GCC using the square root of squared returns. The results from this table are similar to those from using the conditional volatility approach. The total volatility spillover index of the complete sample (sets at 26.2%) is comparable to its GARCH based counterpart.
Table 4. Volatility spillover using the square root of squared volatility
The column “from others” shows that the value of the volatility ranges from 16.4% (BSE) to 33.4% (DFM) from other markets. The least affected by system shock is BSE (16.4%), while DFM (33.4%) is the most affected by system shock followed by QSE (33%) and OSE (31.1%). Therefore, the other GCC market contributes 33.4 percent of the forecasting variance of the DFM.
The figures also show that the volatility of DFM affects and was affected by the system shocks the most. While TASI contributes more to the forecasting volatility of other markets (31.6%), other GCC markets have little volatility spillover to TASI (21.6%). This might be due to the size of the TASI market as compared to the other GCC exchanges. Results of row “to others” in shows the contribution of each of the stock market indices to the volatility connectedness matrix. We can see that the contribution of each index to the volatility matrix ranges from 9.7% (BSE) to 40.1% (DFM).
(section B-2) outlines the results of net-pairwise directional index. Results show that the net transmitters of volatility to other markets are DFM, TASI and KSE to a lesser degree, while the other markets are net recipients of shocks. Our results here are consistent with those we find in previously, in the sense that DFM and TASI are the net transmitters while the others are net recipients of shocks.
9. Volatility spillover controlling for oil volatility
We should note here that oil prices fell severely, by around 30%, two months after the COVID-19 pandemic due to low global demand, OPEC’s temporary futile negotiations and the unexpected Saudi authorities’ oil price discount of $6 to $8 to their favoured customers. The change in oil prices is expected to have an impact on the GCC markets through its effect on the economy and company expected earnings.
Given the fact that the COVID-19 era witnessed some of the largest swings in oil history, it is important to distinguish whether or not the intense spillovers in the GCC are related to the joint effect of oil and the COVID-19 Pandemic. Hence, in this section, we control for the impact of oil volatility by introducing it to the system alongside the GCC markets.
The outcome shown in reveals that even after controlling for oil volatility the net transmitters of volatility to other markets are DFM, QSE and TASI, while other markets are net recipients of shocks.
Table 5. Volatility spillover controlling for oil volatility
10. Conclusions
The objective of this paper was to revisit the volatility spillover dynamics in the GCC bloc in the wake of the COVID-19 pandemic. The results point to a historic high spillover during the pandemic. Our research is a timely complement to the knowledge base on volatility spillover trends of emerging stock markets and their varying behaviour from developed markets. These differences may be due to institutional characteristics, regulatory environment, as well as cultural and behavioural factors.
Policy recommendations from the study revolve around the need for policymakers globally to reduce uncertainties in financial markets. This could be achieved by reducing policy inconsistencies and by enhancing monetary and fiscal policy coordination. That would guarantee the effective implementation of policy decisions and reduce the impact of the pandemic on the global economy. The length of the COVID-19 outbreak is both unknown and spreading to more countries around the world and careful monitoring to update these preliminary estimates as events unfold is a valuable focus of further study.
Disclosure statement
No potential conflict of interest was reported by the author(s).
Additional information
Funding
Notes on contributors
Salem Adel Ziadat
The research interests of Salem Ziadat are generally under the umbrella of international finance and energy finance. Precisely, the researcher focuses on the linkages between financial markets and the impact of oil prices on the financial markets. This area of research has generated attention due to the increase in the size of cross-country investments and the reliance on commodities as asset classes in global portfolios. Professor Ritab AlKhouri is a co-author of this project. Her research interests are in corporate social responsibility, risk management, and international finance. Currently, the researcher is engaged in a research project related to the impact of COVID-19 on the aviation industry.
Notes
1. BRIC is a grouping acronym which refers to the countries of Brazil, Russia, India and China.
2. Middle East and North Africa. The GCC is a subset of the MENA region.
3. Derbali et al. (2020a) explores the Fed’s announcement ability in explaining the correlations between Bitcoin and energy commodities.
4. Available online on https://covidtracker.bsg.ox.ac.uk/.
5. The EGARCH model by Nelson (Citation1991) accounts for the leverage effect.
6. Derbali et al. (2020b) show a conditional dependence between energy futures returns and OPEC-based predictors.
7. Baker, Scott R., Bloom, Nick and Davis, Stephen J., Equity Market Volatility: Infectious Disease Tracker [INFECTDISEMVTRACKD], retrieved from FRED, Federal Reserve Bank of St. Louis; https://fred.stlouisfed.org/series/INFECTDISEMVTRACKD, 18 February 2021.
8. Hale, Thomas, Sam Webster, Anna Petherick, Toby Phillips, and Beatriz Kira. 2020. Oxford COVID-19 Government Response Tracker. Blavatnik School of Government. Data use policy: Creative Commons Attribution CC BY standard.
References
- Abid, I., Stéphane, G., Guesmi, K., & Jamali, I. (2019). Transmission of shocks and contagion from U.S. to MENA equity markets: The role of oil and gas markets. Energy Policy, 134(110953). https://doi.org/10.1016/j.enpol.2019.110953
- Abraham, A., & Seyyed, F. J. (2006). Information transmission between the Gulf equity markets of Saudi Arabia and Bahrain. Research in International Business and Finance, 20(3), 276–21. https://doi.org/10.1016/j.ribaf.2005.05.007
- Agenor, P.-R. (2001). Benefits and costs of international financial integration: Theory and facts. Policy Research Working Paper; No. 2699. Washington, DC: World Bank. https://openknowledge.worldbank.org/handle/10986/19503
- Alkulaib, Y. A., Najand, M., & Mashayekh, A. (2009). Dynamic linkages among equity markets in the Middle East and North African countries. Journal Multinational Financial Management, 19(1), 43–53. https://doi.org/10.1016/j.mulfin.2008.03.002
- Aloui, C., & Hkiri, B. (2014). Co-movements of GCC emerging stock markets: New evidence from wavelet coherence analysis. Economic Modelling, 36(C), 421–431. https://doi.org/10.1016/j.econmod.2013.09.043
- Ashraf, B. N. (2020). Stock markets’ reaction to COVID-19: Cases or fatalities? Research in International Business and Finance, 54, 101249. https://doi.org/10.1016/j.ribaf.2020.101249
- Awartani, B., Maghyereh, A. I., & Al Shiab, M. (2013). Directional spillovers from the US and the Saudi market to equities in the gulf cooperation council countries. Journal of International Financial Markets, Institutions and Money, 27, 224–242. https://doi.org/10.1016/j.intfin.2013.08.002
- Baker, S. R., Bloom, N., Davis, S. J., Kost, K. J., Sammon, M. C., & Viratyosin, T. (2020). The unprecedented stock market impact of COVID-19 (No. w26945). National Bureau of Economic Research doi:10.3386/w26945
- Balcilar, M., Demirer, R., & Hammoudeh, S. (2015). Regional and global spillovers and Diversification opportunities in the GCC equity sectors. Emerging Market Review, 24, 160–187. https://doi.org/10.1016/j.ememar.2015.06.002
- Beine, M., Cosma, A., & Vermeulen, R. (2010). The dark side of global integration: Increasing tail dependence. Journal of Banking and Finance, 34(1), 184–192. https://doi.org/10.1016/j.jbankfin.2009.07.014
- Bekaert, G., & Harvey, C. R. (1997). Emerging equity market volatility. Journal of Financial Economics, 43(1), 29–77. https://doi.org/10.1016/S0304-405X(96)00889-6
- Bekaert, G., & Harvey, C. R. (1997). Emerging equity market volatility. Journal of Financial Economics, 43(1), 29–78 doi:10.1016/S0304-405X(96)00889-6.
- Bekaert, G., & Urias, M. S. (1996). Diversification, integration and emerging market closed-end funds. Journal of Finance, 5(1), 835–870 doi:10.1111/j.1540-6261.1996.tb02709.x.
- Benlagha, N., & El Omari, S. (2021). What determines the dependence between stock markets-crisis or financial and economic fundamentals? Applied Economics 54 (1) , 19–37. https://doi.org/10.1080/00036846.2021.1951443
- Bissoondoyal-Bheenick, E., Do, H., Hu, X., & Zhong, A. (2020). Learning from SARS: Return and Volatility Connectedness in COVID-19. Finance Research Letters, 41, 101796. https://doi.org/10.1016/j.frl.2020.101796
- Bley, J., & Saad, M. (2012). Idiosyncratic risk and expected returns in frontier markets: Evidence From GCC. Journal of International Financial Markets, Institutions & Money, 22(3), 538–554. https://doi.org/10.1016/j.intfin.2012.01.004
- Chen, M., Chen, P., & Lee, C. (2014). Frontier stock market integration and the global financial crisis”. North American Journal of Economics and Finance, 29, 84–103. https://doi.org/10.1016/j.najef.2014.05.004
- Corbet, S., Goodell, J. W., & Günay, S. (2020). Co-movements and spillovers of oil and renewable firms under extreme conditions: New evidence from negative WTI prices during COVID-19. Energy Economics, 92, 104978. https://doi.org/10.1016/j.eneco.2020.104978
- Derbali, A., Jamel, L., Ben Ltaifa, M., Elnagar, A. K., & Lamouchi, A. (2020). Fed and ECB: Which is informative in determining the DCC between bitcoin and energy commodities? Journal of Capital Markets Studies, 4(1), 77–102. https://doi.org/10.1108/JCMS-07-2020-0022
- Derbali, A., Naoui, K., & Jamel, L. (2021). COVID-19 news in USA and in China: Which is suitable in explaining the nexus among Bitcoin and Gold? Pacific Accounting Review, 33(5), 578–595. https://doi.org/10.1108/PAR-09-2020-0170
- Derbali, A., Naoui, K., Sassi, M. B., & Amiri, M. M. (2021). Do COVID-19 epidemic explains the dynamic conditional correlation between China’s stock market index and international stock market indices. The Chinese Economy, 1–16. https://doi.org/10.1080/10971475.2021.1958453
- Derbali, A., Wu, S., & Jamel, L. (2020). OPEC news and predictability of energy futures returns And volatility: Evidence from a conditional quantile regression. Journal of Economics, Finance and Administrative Science, 25(50), 239–259. http://dx.doi.org/10.1108/jefas-05-2019-0063
- Diebold, F. X., & Yilmaz, K. (2012). Better to give than to receive: Predictive directional measurement of volatility spillovers. International Journal of Forecasting, 28(1), 57–66. https://doi.org/10.1016/j.ijforecast.2011.02.006
- Diebold, F.X., and Yilmaz, K., 2009. Measuring financial asset return and volatility spillovers, with application to global equity markets. The Economic Journal, 119(534), pp.158–171.
- Engle, R. F., Ito, T., & Lin, W. (1990). Meteor showers or heat waves? Heteroskedastic intra-daily volatility in the foreign exchange market. Econometrica, 58(1990), 524–542. https://doi.org/10.2307/2938189
- Ghorbel, A., & Boujelbene, Y. (2013). Contagion effect of the oil shock and US financial crisis on the GCC and BRIC countries. International Journal of Energy Sector Management, 7(4), 430–447. https://doi.org/10.1108/IJESM-04-2012-0002
- Goodell, J. W. (2020). COVID-19 and finance: Agendas for future research. Finance Research Letters, 35, 101512. https://doi.org/10.1016/j.frl.2020.101512
- Hale, T., Webster, S., Petherick, A., Phillips, T., and Kira, B., 2020. Oxford COVID-19 government response tracker (OxCGRT). last updated, 8, p.30.
- Hung, N. T. (2021). Financial connectedness of GCC emerging stock markets. Eurasian Economic Review, 11(4), 753–773. https://doi.org/10.1007/s40822-021-00185-2
- Koop, G., Pesaran, M. H., & Potter, S. M. (1996). Impulse response analysis in nonlinear multivariate models. Journal of Economics, 74(1), 119–147. https://doi.org/10.1016/0304-4076(95)01753-4
- Neaime, S. (2016). Financial crises and contagion vulnerability of MENA stock markets. Emerging Markets Review, 27, 14–35. https://doi.org/10.1016/j.ememar.2016.03.002
- Nelson, D. B. (1991). Conditional heteroskedasticity in asset returns: A new approach. Econometrica: Journal of the Econometric Society, 59(2), 347–370. https://doi.org/10.2307/2938260
- Pesaran, H. H., & Shin, Y. (1998). Generalized impulse response analysis in linear multivariate models. Economic Letters, 58(1), 17–29. https://doi.org/10.1016/S0165-1765(97)00214-0
- Saadi-Sedik, T., & June, W. (2011). Global and regional spillovers to GCC equity markets. IMF Working Paper No. 11/138. https://ssrn.com/abstract=1869547
- So, M., Chu, A., & Chan, T. (2020). Impacts of the COVID-19 pandemic on financial market connectedness. Finance Research Letters, 38(2021), 101864. https://doi.org/10.1016/j.frl.2020.101864
- Zhang, D., Hu, M., & Ji, Q. (2020). Financial markets under the global pandemic of COVID-19. Finance Research Letters, 36, 101528. https://doi.org/10.1016/j.frl.2020.101528
- Ziadat, S., Herbst, P., & McMillan, D. G. (2020). Inter- and intra-regional stock market relations for the GCC bloc. Research in International Business and Finance, 54(101292), 101292. https://doi.org/10.1016/j.ribaf.2020.101292
