
 ?Mathematical formulae have been encoded as MathML and are displayed in this HTML version using MathJax in order to improve their display. Uncheck the box to turn MathJax off. This feature requires Javascript. Click on a formula to zoom.
Abstract
While there is a large body of research on the bank lending channel of monetary policy transmission and the distributional dependence of this transmission on bank characteristics, the asymmetric effect of bank capital on monetary policy—bank loan supply nexus has been ignored. To fill this void, the new post-estimation approach of marginal analysis based on the two-step system-GMM methodology is conducted for the dynamic panel data of Vietnamese commercial banks covering the period of 2007–2020. The results confirm the inertia related to loan growth and the presence of a monetary policy bank lending mechanism, which is robust across a series of monetary policy instruments and the approach of variable exclusion from the baseline model. In addition to previous empirical evidence on less sensitivity of well-capitalized banks to tightened monetary policy, this study shows the specific range value of bank capital that monetary policy stance has no impact on bank loan supply in a time of monetary restrictions. Furthermore, better capitalized banks could take more advantage of the expansionary monetary policy by lending more. The relevant policy recommendations for policy-makers are also provided to the best practice of monetary policy implementations considering these asymmetric effects.
PUBLIC INTEREST STATEMENT
Current paper addresses the different response of bank loan supply to the shocks of monetary policy depending on various levels of bank capital, which remains scarce in previous studies. Among financial indicators, the capital level of banks plays a critical role in maintaining lending activities and a buffer for bank’s stability. This study gives rise to paying much attention to the differentiated impact of bank capital on the well-established bank lending channel of monetary policy pass-through. Specifically, well-capitalized banks evidently benefit by lending more in periods of monetary policy loosening; however, these banks also show different responses of lending behaviors to monetary restrictions according to their different capital levels. In addition, we provide a detailed description for the marginal analysis in an attempt to encourage further research employing this approach in the topic of monetary policy transmission in bank-level data.
1. Introduction
The banking system holds a critical position in economic development by providing valuable financial resources as the form of bank lending finance for firms and households in developing countries (Sanfilippo-Azofra et al., Citation2018).Footnote1 In addition, the role of credit supply by banks is quite important to have proper understanding of the impact of monetary policy on the economic environment (Cantero-Saiz et al., Citation2014). Accordingly, the shocks caused by central bank’s monetary policy implementations could considerably affect the growth of loan supply, owing to the constrained access to the loanable funds (Ben & Blinder, Citation1988). This mechanism that monetary policy works is called the bank lending channel of monetary policy transmission (Altunbaş et al., Citation2002; Gambacorta, Citation2005; Kashyap & Stein, Citation1995a).Footnote2 For example, in a time of monetary restrictions, bank reserves and deposits tend to reduce, and the increased borrowing cost and difficulties in raising capital from external sources could reduce the lending ability of banks (Bashir et al., Citation2020). On the contrary, monetary policy loosening could stimulate the level of lending when banks have the opportunity to get access to banks’ loanable funds.
There has been an increasing debate about the response of bank loan supply to the shift of monetary policy depending primarily on bank’s characteristics (Altunbas et al., Citation2010; Kashyap & Stein, Citation1995b, Citation2000; Kishan & Opiela, Citation2000, Citation2006; Peek & Rosengren, Citation1995). Among these bank’s balance sheet items, bank capital is of great research interest in the aftermath of the financial crisis in the period 2007–2008 (Louhichi & Boujelbene, Citation2017) due to the vital role of bank capital that plays in creating sufficient capital buffers and stable financial resources, thereby maintaining and extending banks’ lending activities (Dang et al., Citation2021). In addition, bank capital has paid much attention because of its important role in sustaining lending during the crisis period and the new reforms on regulatory requirements of bank capital through the adoption of the Basel Accords (Sáiz et al., Citation2018). There is mounting literature on the distributional effect of bank capital on monetary policy pass-through via the bank lending mechanism; that is, bank capital has an implication in overcoming the decrease (increase) in bank loan supply caused by monetary tightening (loosening). The response of bank loan supply to both regimes of monetary policy shocks (i.e., monetary loosening and tightening) depending on various levels of bank capital has yet to be addressed sufficiently, especially in emerging markets. These asymmetric effects of bank capital on monetary policy transmission through the bank lending mechanism are our main focus.
Monetary policy transmission via the bank lending mechanism could respond differently across countries relying on the structure and efficiency of a country’s economic and financial system (Rashid et al., Citation2020). The relevance of the bank lending channel is rather limited in developed countries, such as the United State and Euro zone where it has a developed capital market (Sanfilippo-Azofra et al., Citation2018). Contrary to developing and developed countries, Vietnam, with several unique features of a typical emerging market, needs to be taken into consideration. First, after the implementation of the economy’s reform in 1986, Vietnamese banking system has experienced several reform programmesFootnote3 related to recapitalization and deregulation (Vu & Nahm, Citation2013). Among these reforms, regulatory bank capital is of great attention by policy-makers to assure the stability of the banking system, leading to changes in the implication of bank capital on the pass-through of monetary policy via the bank lending mechanism. Second, Vietnam, considered as a small open economy, has an under-developed financial market, leading to the fact that the economic agents depend mainly on the financing capital of the banking system. This specific economic framework could make monetary policy pass-through more efficient (Saxegaard, Citation2006; Vo & Nguyen, Citation2014). Third, in the aftermath of the financial crisis 2007, especially the peak of non-performing loans in 2012, there are a series of interest rates in navigating the credit supply and economic development by the State Bank of Vietnam (SBV). In particular, interbank interest rate, refinancing rate, rediscount rate, and lending rate are simultaneously adopted to achieve various macroeconomic objectives (Dang et al., Citation2021).
There are a number of studies investigating the impact of monetary policy in Vietnam. For example, Van Hai and Trang (Citation2015) using a VAR approach to investigate the implications of monetary transmission in Vietnam’s scenario. The findings show that the fluctuation in aggregate output could be affected by the variation in money demand and interest rates. Anwar and Nguyen (Citation2018) employing quarterly data for the period of 1992–2010 indicate that the Vietnam economy is relatively more prone to changes in foreign impulses, exchange rate, and interest rate. These studies utilize the aggregate data based on the approach of time-series estimation to test the existence of monetary policy pass-through, which could naturally not determine the role of bank-specific characteristics on monetary transmission via the bank lending channel.
Additionally, several studies address the bank lending channel of monetary policy transmission. For example, Vo and Nguyen (Citation2017) using a VAR model for monthly data of the period of 2003–2012 show the presence of the bank lending mechanism of monetary transmission. To take a further step, Dang et al. (Citation2021) investigate the role of bank diversification on the potency of the monetary pass-through bank lending mechanism, suggesting that the involvement of non-traditional operations could make the monetary transmission less efficient. However, these studies ignore the impact of monetary pass-through on bank loan supply relying on differentiated values of bank capital. Accordingly, this study could not exploit the benefits of continuous variables to address monetary policy pass-through via bank capital depending on both monetary loosening and tightening. Therefore, the asymmetric effects of monetary policy transmission via the bank lending mechanism across the different levels of bank capital are under-explored in the context of the emerging market like Vietnam. This research is also conducted to fill this void.
This study covers a comprehensive sample of 30 commercial banks in Vietnam over the period of 2007–2020. The two-step system-GMM estimator is performed to address the endogenous issue and unobservable heterogeneity. The findings indicate the persistence of bank loan supply and the existence of monetary policy transmission through the bank lending channel in Vietnam. Since the changes in the levels of bank capital could affect the association of monetary policy tools with bank loan supply, the unique marginal analysis together with the plot illustration is also employed to test the asymmetric impact of bank capital on the pass-through of monetary policy, providing a rich insight into the impact of monetary policy on bank loan supply depending on the differentiated level of bank capital. Specifically, there exists the range values of bank capital where the monetary policy has no effect on bank loan supply. Taking a step further relative to previous studies, well-capitalized banks could benefit more from lending extension in the monetary loosening. These findings could facilitate the decisions of policy-makers on taking into account the level of bank capital in an attempt to stimulate the bank loan supply based on the asymmetric effects of monetary policy in the contractionary and expansionary periods. Furthermore, it is important to interpret which levels of bank capital the bank lending mechanism of monetary policy is strengthened so that the decisions for monetary policy could be more effective.
Current study could make profound contributions to the extent of literature for several reasons. First, given the multi-dimensional nature of interest rates in Vietnam,Footnote4 this study utilizes a variety of instruments representing monetary policy (i.e., including lending rate, refinance rate, rediscount rate, and interbank interest rate), instead of focusing only on short-term money market rate which is commonly employed in previous studies (Altunbas et al., Citation2010; Leroy, Citation2014; Matousek & Solomon, Citation2018; Olivero et al., Citation2011; Sáiz et al., Citation2018). Indeed, there are very few research papers in Vietnam on monetary policy transmission using such a wide range of monetary proxies to represent the simultaneous adoption of monetary policy by the SBV.
Second, prior studies have commonly applied the macroeconomic time series to test the presence of bank lending mechanism of monetary policy pass-through (B. Bernanke, Citation1990a; B. B. Bernanke & James, Citation1990; Hoshi et al., Citation2007; Kashyap et al., Citation1992; Oliner & Rudebusch, Citation1993). However, the approach of using aggregate data receives much debate because of the identification problem as it is hard to separate the changes in bank loan supply due to the fluctuations in the demand side or supply side.Footnote5 More recently, the bank-level data has been utilized to address the cross-sectional heterogeneity bias relying on the differences of bank idiosyncratic characteristics. Therefore, the micro-level data are employed in this research to test the main role of bank capital on the monetary policy pass-through via bank loan supply.Footnote6
Third, to the best of our understanding, this is the first empirical research focusing on the asymmetric impact of bank capital on monetary pass-through via the bank lending mechanism in an emerging market. Apart from most previous studies testing the impact of monetary policy on bank lending at a certain figure of bank capital, this study allows all the possible values (that bank capital could obtain) in the primary purpose to examine the bank loan reaction to the monetary policy regime conditioned by different values of bank capital. The treatment of marginal effects with the squared interaction term is performed in baseline model, leading to more correct interpretation for policy practitioners and banking regulators of how bank capital could shape the impacts of monetary policy on lending channel in the periods of tightening and loosening regimes.Footnote7
Finally, one of the main drawbacks of previous studies on the role of bank capital in monetary policy transmission is that it mainly focuses on categorical variables to classify the levels of bank capital (i.e., low or well capitalization; Altunbaş et al., Citation2002; Gambacorta, Citation2005; Gambacorta & Mistrulli, Citation2004; Kishan & Opiela, Citation2000, Citation2006). This approach could limit the proper understanding of the results using these categorical variables and makes it impossible to compare differences between objects in the same group.Footnote8 Although there is mounting research on the usage of continuous variables to yield the interaction term of monetary policy and capital (Ehrmann et al., Citation2003; Gambacorta & Marques-Ibanez, Citation2011; Jimborean, Citation2009; Jiménez et al., Citation2012), this product term is not exploited to its full potential yet. Therefore, this study contributes to literature by extracting all information from the product term of continuous variables based on marginal effect analysis together with the plot chart construction, which is largely limited in empirical studies.
Following this introduction, the rest of this paper is constructed as follows: Section 2 provides the literature review on the bank lending channel of monetary policy transmission and the asymmetric effects of monetary policy contingent on bank capital. Section 3 presents the model, econometric estimation method, and data description. Section 4 focuses on the empirical findings and discussion, followed by conclusion of the paper in Section 5.
2. Literature review and hypotheses development
2.1. Literature on the existence of the bank lending channel
Monetary transmission via the bank lending channel is a well-established topic of interest from researchers and policy-makers (Khan et al., Citation2016). It does not come as a surprise, therefore, a strand of literature focuses largely on the existence of bank lending mechanism of monetary policy pass-through.Footnote9 In an earlier study of monetary policy pass-through via bank lending, Ben and Blinder (Citation1988) mentioned three assumptions to maintain the existence of bank loan responses to changes in monetary policy: (i) bank loan supply and bonds could not perfectly substitute for each other; (ii) policy-makers could make adjustment in the credit supply of financial intermediaries; and (iii) there is the existence of imperfectly adjusted prices in order to remove the problem of monetary neutrality. Drawing on these assumptions, a decrease in the supply of bank loans could distort the investment, leading to aggregate demand reduction.
The motives for the changes in bank loan supply affected by the monetary policy stance could stem from several aspects relating to the accessible loanable funds. Accordingly, bank loan supply could be affected by restrictive monetary policy due to the limited access to deposit’s availability from bank reserves constrained by the central bank (Kashyap & Stein, Citation1995a). Furthermore, deposit yields could be reduced relative to other assets in the period of monetary restrictions, thereby decreasing the household’s holding behavior of these funds (Kishan & Opiela, Citation2000). Due to the important role played by deposit funding for banks, a decrease in bank loan supply is followed by the deposit reduction that comes from the monetary tightening. On the other hand, financial frictions could be significantly reduced due to the monetary expansions, leading to the increase in the loanable assets (Gibson, Citation1997). Moreover, low interest rates caused by loosening monetary policy could bring the reduction into the bank risk portfolio, resulting in the relaxed credit standards and hence the increased loan supply.
Additionally, inaccessible external finances (especially market-based fundings) caused by monetary policy impulses could be one of the most critical factors inducing the bank loan reduction. The consequences of monetary policy could raise the risk awareness of these banks, deteriorate banks’ balance sheets, and increase the market funding cost (Disyatat, Citation2011), thus resulting in the changes in loan supply of banks. Therefore, the banking system is considered as a critical conduit in the monetary policy pass-through. This is more pronounced in the context of emerging markets where the important role of central banks could be represented and the economic agents are greatly reliant on the credit from banks (Vo & Nguyen, Citation2014). Based on these theoretical explanations and empirical arguments, we expect the existence of monetary policy transmission in Vietnam; that is, the monetary policy has a negative impact on bank loan supply. The following hypothesis is stated as:
H1: The monetary policy pass-through exits through the bank lending channel.
2.2. Balance sheet items, bank capital and monetary policy transmission via the bank lending channel
There has been a great deal of attention in the role of banks’ financial strength on the monetary policy pass-through via bank loan supply. The size, liquidity, and capital of banks are among the dominant indicators affecting the effectiveness of monetary policy stance (Kashyap & Stein, Citation1995a, Citation2000; Kishan & Opiela, Citation2000, Citation2006). Other papers consider the market competition or market concentration in determining the reaction of banks to monetary policy shocks (Adams & Amel, Citation2011; Olivero et al., Citation2011). More recently, risks of credit sources and the country’s sovereign are taken into account in analysis of the bank lending mechanism (Altunbas et al., Citation2010; Cantero-Saiz et al., Citation2014). As a whole, these studies report that due to the constrained accessibility to funding, there is less sensitivity to monetary policy shocks in banks with larger, more liquid, less poorly capitalized, higher credit risk, operating under more competitive banking systems and in economies with lower sovereign risk. More recently, Gomez-Gonzalez et al. (Citation2020) suggest the response of bank lending activities to monetary policy shocks depending on banks’ financial structure and investigate an asymmetric impact in which the bank lending channel is greater in times of monetary contraction than in times of monetary growth.
Among the proxies representing banks’ financial strength, bank capital has been regarded as the primary factor determining the adaptive response of bank loans to monetary policy shocks. Several studies display the role of bank capital on the bank lending channel of monetary policy transmission; however, the empirical findings are relatively inconclusive. Empirical research in the United States finds that bank lending of poorly capitalized banks is considerably influenced by monetary restrictions (Kishan & Opiela, Citation2000; Peek & Rosengren, Citation1995; Van den Heuvel, Citation2002).Footnote10 In addition to this perspective, Kishan and Opiela (Citation2006) indicate that monetary expansion shows no impact on bank lending extension. To highlight the importance of bank capital role, Bashir et al. (Citation2020) suggest that banks with larger assets’ base or well capitalization are better insulated against the changes in monetary policy shocks; hence, the bank lending mechanism of monetary policy pass-through could be weakened by banks with strong balance sheet strength. Other studies suggest that bank capital does not affect the lending activities of European banks during the period of contractionary monetary policy. Accordingly, possibly due to the problem of asymmetric information, banks would use capital to cushion the financial problems, rather than for lending purposes (Ehrmann et al., Citation2003; Gambacorta & Marques-Ibanez, Citation2011; Jimborean, Citation2009).
As compared to banks with well capitalization, under-capitalized banks could reduce their lending during the period of monetary tightening, owing to the following two reasons. First, poorly capitalized banks might face the severe problems related to information asymmetry and moral hazard and are perceived as high risk by the market. As a result, it is difficult to access external capital for these banks (Jayaratne & Morgan, Citation2000). Second, the monetary tightening through the increase in interest rates affects the cost of capital, thereby reducing profits and bank capital. This induces under-capitalized banks to reduce lending to a greater extent to reduce the risk of capital loss in the future (Bolton & Freixas, Citation2006).
Despite numerous studies that have addressed the role of capital in monetary policy transmission through the bank lending channel, little is known about the asymmetric impact of bank capital on the response of bank loan supply to monetary policy shocks, especially in emerging markets. Kishan and Opiela (Citation2006) indicate that monetary policy pass-through via the bank lending channel is different between the two regimes of monetary policy, i.e., the monetary restriction and expansion. In this regard, less capitalized banks will be more affected by contractionary monetary policy and benefit less from expansionary monetary policy than well-capitalized banks. Based on the sample of European banks in developed countries, Sáiz et al. (Citation2018) indicate that the impact of monetary policy on bank loan supply is significantly negative, irrespective of any level of bank capital; however, well-capitalized banks could get more benefit from monetary loosening since these banks could expand lending more than those with under capitalization. In other words, banks with different values of capital could respond differently to both regimes of monetary policy, such as monetary tightening and loosening. Therefore, we expect that the differential impact of each regime of monetary policy stance through the bank lending channel could be dependent on the different levels of bank capital, thus leading to hypotheses as follows..
H2a: There is less response of well-capitalized banks to restrictions under monetary policy loosening.
H2b: There is more response of well-capitalized banks to expansions under monetary policy tightening.
3. Methodology
3.1. Baseline econometric model
Adapted from the original models on the approach of Kashyap and Stein (Citation1995b), Kishan and Opiela (Citation2000), Kishan and Opiela (Citation2006), Altunbaş et al. (Citation2002), Gambacorta and Mistrulli (Citation2004), and Sanfilippo-Azofra et al. (Citation2018) for testing the impact of monetary policy and loan growth of banks, the baseline model is as followsFootnote11:
Specification (1) captures the reaction of bank loan supply to monetary policy shocks after controlling the impact of individual bank characteristics, the banking market structure and the macroeconomic factor. In this specification, the dependent variable, captures the loan supply growth for bank i in year t relative to year t-1. In accordance with previous research such as Sáiz et al. (Citation2018), Sanfilippo-Azofra et al. (Citation2018), and Dang and Nguyen (Citation2020). The lagged dependent variable,
is employed to remain the persistence of loan growth.Footnote12 To capture the Vietnam framework of diverse monetary policy instruments, the multiple proxies for monetary policy stance,
, are employed including the lending rate, Vietnam interbank interest rate, refinance rate and rediscount rate.Footnote13 Accordingly, the SBV has adopted simultaneous consonance of these policy tools to set the appropriate interest rate in responses to macroeconomic circumstances.Footnote14 The first different form of these policy interest rates are included to capture the monetary policy regime in which the interest rate increased, implying the tightening regime followed by the reduction in the growth of bank supply and vice versa (Dang, 2020; Sáiz et al., Citation2018).
3.2. Control variables
There are several well-accepted control variables in the interest rate—bank loan supply relation. Specifically, CAP represents the proportion of total equity over total assets; SIZE is the natural logarithm of total assets; LIQ is the cash and deposits divided by total assets; LLP stands for credit risk, calculated by the loan loss provision divided by gross loan. To address the endogenous issue, the one-period lagged form of these bank characteristics are incorporated based on the studies of Kashyap and Stein (Citation1995b) and Cantero-Saiz et al. (Citation2014). Furthermore, the interaction terms between the proxies for monetary policy () and control variables for bank idiosyncratic characteristics are included to reflect the banks’ reaction to monetary policy conditioned by its capital, size, liquidity and credit risk. In this regard, the banks with less capital, small size, low liquidity, and high credit risk are more sensitive to the shocks of monetary policy stance (Altunbas et al., Citation2010; Gambacorta & Marques-Ibanez, Citation2011; Kashyap & Stein, Citation2000). In other words, the impact of monetary policy on bank loan supply is weakened by large, more liquid, less poorly capitalized and low-risk banks. In model (1), the coefficients on bank characteristics such as
,
,
, and
represent the responses of bank loan supply to the shocks of monetary policy under the different bank-specific characteristics.
is an idiosyncratic error term.
Market concentration (MC) is calculated based on the approach of the Herfindahl Index pertaining to the total assets, which implies the market concentration (Sáiz et al., Citation2018). The variable GDPG represented by the annual growth rate of gross domestic product captures the conditions of the macroeconomic environment and loan demand. A large number of research studies have investigated the association of allocation structure in bank loan supply with the economy’s business cycle in which the economic growth could make a positive impact on bank lending (Bertay et al., Citation2012; Davydov et al., Citation2018; Zins & Weill, Citation2018). All studied variables are reported in .
Table 1. Summary of the studied variables
3.3. Normalized procedure for bank’s characteristics
Given the approach of Ehrmann et al. (Citation2003), Gambacorta (Citation2005), and Jimborean (Citation2009), to have proper understandings of the interaction terms between monetary policy tools and bank characteristics, variables controlling for bank characteristics are normalized in regard to the mean value of all banks in studied sample.
To be specific, each bank’s total assets is normalized by subtracting the natural logarithm of total assets for each bank from sample averages. In addition, other individual bank idiosyncratic characteristics, i.e., capitalization, liquidity, and credit risk are normalized by subtracting from the sample average for every single period and over the whole period. The normalization of bank individual characteristics aims to its summation equal to zero across the entire sample; hence, the parameter is straightforwardly interpreted as the impact of monetary policy for the average bank (Akinci et al., Citation2013; Ehrmann et al., Citation2003; Gambacorta, Citation2005). In addition, this normalized approach could eliminate a trend in size over the entire period and over every single period (Yang & Shao, Citation2016). Moreover, the marginal effect analysis could benefit from this normalization procedure by removing these normalized variables from the derivative of specification (1) with respect to monetary policy (Sáiz et al., Citation2018). These variables are adopted in the following forms:
where ,
,
,
, and
are cash and deposits, total equity, total assets, loan loss provisions, and total loans, respectively.
denotes the number of banks in the studied sample.
3.4. Marginal effect of monetary policy
The previous studies indicate that with the various values of bank capital, the monetary policy could vary during the periods of monetary tightening and loosening (Kishan & Opiela, Citation2006). Therefore, to capture the sufficient information in the marginal impact of monetary policy on the bank’s loan supply in relation to different levels of bank capital, the squared interaction term between continuous variables, , including monetary policy instruments and bank capital are incorporated into model (1) to obtain the main purpose of this research, forming the main research modelFootnote15:
The marginal effect of monetary policy on the growth of bank loan supply will rely on the value of bank capital. Hence, to obtain the appropriate interpretation of the marginal effect of monetary policy and capture this marginal effects, the derivative of specification (2) in terms of monetary policy instruments is taken as follows:
As the normalized form of CAP, SIZE, LIQ, and LLP with regard to its mean value, the marginal effect specification for an average bank is rewritten as followsFootnote16:
The marginal effect of specification (8) relies on the levels of monetary policy instruments; hence, two scenarios of monetary policy regime (i.e., tightening and loosening state of monetary policy) are separated to test the asymmetric effect between the contractions and expansions of monetary policy.Footnote17 Accordingly, in the contraction regime of monetary policy, the fall in bank loan supply driven by the increase in interest rate could be less affected for banks with more capital. Furthermore, the increase in loan growth because of a loosening monetary policy could be amplified for more capitalized banks. Therefore, banks with more capital are not sensitive to the restrictive monetary policy and take more advantage of loosening monetary policy (Kishan & Opiela, Citation2006), leading to expectation of the positive coefficient . The confidence intervals to test the significance of the marginal effect coefficient could follow the calculation as reported in Appendix C.
3.5. Econometric estimation
The proposed Equationequation (2)(2)
(2) is estimated by employing the approach of two-step system-GMM for the dynamics of panel data model, which is suitable for the data with large cross-sectional observations (N) and small time length (T).Footnote18 System GMM is characterized by the simultaneous estimation of levels and differences. Specifically, the difference equation uses the lagged values as the instruments, whereas the level equation employs the first-different lagged values as the instruments (Nguyen et al., Citation2020; Roodman, Citation2009). This method captures the circumstances when explanatory indicators are not closely exogenous and may be associated with prior and current error terms, and where the prevalent problems of autocorrelation, heteroskedasticity, and time fixed effects are present. Furthermore, this approach could address the biases related to inclusion of the lagged dependent variable and the endogenous issue among explanatory variables. More specifically, the nexus between bank lending and monetary policy could be hampered by the issue of endogeneity. Monetary policy could have an impact on bank loan supply; however, the banking system could influence the decisions of monetary policy implementation (Cantero-Saiz et al., Citation2014; Gambacorta & Marques-Ibanez, Citation2011).
There are a large number of studies employing GMM estimator such as Chen et al. (Citation2017), Mamatzakis and Bermpei (Citation2016), Matousek and Solomon (Citation2018), Bashir et al. (Citation2020), Ehrmann et al. (Citation2003), and Bhaduri and Goyal (Citation2015) rather than other approaches. First, two-step estimation process could offer more robust results than the one-step approachFootnote19 and also deal with over instruments by fitting the instruments’ lags (Roodman, Citation2009). Second, the S-GMM approach is more efficient than the first-difference GMM because it could allow including the lagged dependent variable as an explanatory variable in order to capture the dynamic modeling nature, address the individual specific effects, and deal with the endogeneity of explanatory variables. Third, the two-stage least squared (2SLS) estimation shows no robustness due to unknown heterogeneous characteristics which is effectively addressed by the use of two-step GMM (Bashir et al., Citation2020).
It is critical to note that the instruments are assured not to exceed the number of groups in the panel.Footnote20 Furthermore, two post-estimation diagnostic checks should be conducted to test the validity of the research regression framework: the Hansen test for validity of instruments and Arellano-Bond test for the presence of residuals’ second-order correlation with error terms. For the latter, the AR(1) and AR(2) values are employed to test the presence of the first-order serial relation and second-order relation to the error term.
3.6. Data descriptions
The study’s sample comprises 30 Vietnamese commercial joint stock banks covering the period of 2007–2020.Footnote21 The rationale of including only the commercial banks in the research sample is to alleviate the potential bias because of heterogeneous goals and operations arising from the different types of banks (Wang & Luo, Citation2021). Annual bank-level dataFootnote22 of the balance sheets and income statements are collected from the Bankscope database in comparison with the audited financial reports to check the data accuracy. The filtering criteria involve the elimination of banks without the five consecutive years of financial reports.Footnote23 Furthermore, banks involving the mergers or acquisitions in the studied period are excluded.Footnote24 For data of macroeconomic variables, the growth of gross domestic product information is sourced from World Development Indicators (WDI). The final sample includes 409 observations, accounting for approximately 90% of the Vietnamese banking sector’s total assets in any given year. Before making regression treatment, the winsorizing process is adopted for the micro-level variables at 2.5% and 97.5% of the interval levels to insulate potentially negative consequences of the extreme values.Footnote25
We do not use the subsamples according to the bank’s balance sheet items in our manuscript for several reasons. As noted in previous studies, two approaches have been used in the empirical research for investigating the bank lending mechanism. One approach is to separate banks by size, capitalization and liquidity (Altunbaş et al., Citation2002; Kashyap & Stein, Citation1995a, Citation2000; Kishan & Opiela, Citation2000, Citation2006). This approach needs a large number of banks, which is not an issue for the developed markets with sufficiently available data (Heryán & Tzeremes, Citation2017). The other approach is to employ a panel data model that facilitates the response of bank loan supply to monetary policy shocks to become reliant on the bank-specific characteristics, as discussed in Ehrmann et al. (Citation2003). This approach avoids the above problem associated with the number of banks, and this is therefore used in our paper.
shows the descriptive statistics for all studied variables. In the studied period, the annual growth of loan supply of banks is large, reaching the average value of 33.6%; meanwhile its standard deviation is high at 58.9 percentage point. The level of bank capital shows a wide range of the value distribution from 4.3% to 26.6% with the mean value of 10.2%, indicating a given level of safety for banks’ operation in Vietnam. The wide fluctuation of the values of other individual bank characteristics (i.e., SIZE, LIQ, and LLP) in terms of standard deviation and extreme figures imply the heterogeneous features among banks to obtain reliable results. In addition, the average value of the concentration measure is 0.097, showing a relatively high level of concentration in the Vietnam commercial banking system. With regards to monetary policy tools, the high standard deviation values and the wide range of extreme values show the considerable intervention of the central bank into the market.
Table 2. Descriptive statistics among variables
shows the correlation matrix for all studied variables, which captures the overall picture of the link among variables. The correlation for each pair of explanatory proxies is less than 0.8,Footnote26 supporting no evidence of potentially severe multicollinearity in regression estimation. Similar to Dang et al. (Citation2021), all indicators for monetary policy are highly correlated with each other, suggesting the simultaneous implementation of multiple monetary policy tools to achieve the monetary objectives. Due to high correlation, these instruments of monetary policy are treated in separate regressions.
Table 3. Correlation matrix among variables
4. Empirical findings and discussion
4.1. The existence of the bank lending channel
show the regression estimation results for the impact of multiple monetary policy tools on bank loan supply varied with the different levels of bank capital. In each table, the model (a) aims to regress the bank loan supply on its lagged form, bank capital and quadratic interaction term between bank capital and monetary policy instruments. The control variables and its product term with indicators of monetary policy are sequentially included in model (a), turning into model (b), (c), and (d), respectively. The final column, Model (e), reflects the sufficient variables illustrated in specification (2). The approach of variable inclusion is employed to investigate whether the bank lending—monetary policy instrument nexus is robust, regardless of controlled variables added.Footnote27
Table 4. The monetary policy transmission through the interbank interest rate conditioned by bank capital in the dynamic model
Table 5. The monetary policy transmission through the refinance rate conditioned by bank capital in the dynamic model
Table 6. The monetary policy transmission through the rediscount rate conditioned by bank capital in the dynamic model
Table 7. The monetary policy transmission through the lending rate conditioned by bank capital in the dynamic model
In all models across all tables, AR(1) and AR(2) values are statistically significant and insignificant, respectively. This implies that there is the absence of first-order serial correlation with residuals and the presence of second-order serial association with the error term. Furthermore, insignificant p-values of Sargan test show no endogenous problem and over-identification, thereby the valid instruments could be used. These post-estimation tests, therefore, qualify the estimation correctness of all models employing two-step system GMM.
As displayed in , the lagged bank loan supply is significantly positive with the current value of bank loan supply, suggesting that there is the persistence of bank loan supply or the dynamic nature in bank loan supply, similar to previous studies (Bashir et al., Citation2020; Dang et al., Citation2021; Matousek & Solomon, Citation2018).Footnote28 In addition, the monetary policy proxies have a negative impact on bank loan disbursal as expected, hence lending support for Hypothesis 1. This refers to the presence of monetary policy transmission via the bank lending channel, which is in line with several prior studies (Bashir et al., Citation2020; Rashid et al., Citation2020; Vo & Nguyen, Citation2014). This is coherent with Vietnam’s context when the economy and major economic agents are more dependent on the banking system and their lending, which validates the potency of monetary policy transmission through the bank lending mechanism (Dang & Nguyen, Citation2020; Vo & Nguyen, Citation2014).
4.2. The asymmetric effects of the monetary policy transmission depending on different values of bank capital
For all models, the squared interaction terms between monetary policy indicators and bank capital are significantly positive, indicating the significant evidence of the asymmetric effect of bank capital in both regimes of monetary policy. However, the utilization of interaction among continuous proxies (capital and monetary policy) could lead to the marginal effect analysis in which the impact of monetary policy on loan supply could rely on values that the bank capital variable (CAP) adopts. Based on the infinite values of CAP, the plots are constructed for model (e) with the full inclusion of variables in each table in order to have a better understanding of the results.Footnote29
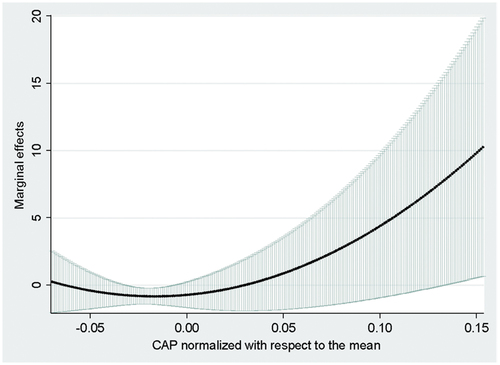
The black line of show the marginal effect of monetary policy on bank loan growth in regard to the normalized form of bank capital in the monetary contractions and expansion periods (i.e., the increased and decreased level of interbank interest rate of 2.55% and −1.92%, respectively). The confidence interval band of 90% illustrated by the range of gray stripes aims to determine the circumstances under which monetary policy significantly affects the bank loan supply.
Figure 1. The marginal impact of monetary policy on loan growth with respect to various levels of bank capital in case of the increase of short-term interbank interest rate by 2.55%.Note: Y-axis denotes marginal effect of monetary policy pass-through and X-axis is the level of bank capital in normalized form. The range of gray stripes refers to the confidence interval band of 90%Source: Author’s plot construction for interpretation of research results.a Further investigation with the lag of monetary policy
Figure 2. The marginal impact of monetary policy on the loan growth in regard to various levels of bank capital in case of the decrease of short-term interbank interest rate by −1.92%.Note: Y-axis denotes marginal effect of monetary policy pass-through and X-axis is the level of bank capital in normalized form. The range of gray stripes refers to the confidence interval band of 90%.Source: Author’s plot construction for interpretation of research results.a Further investigation with the lag of monetary policy
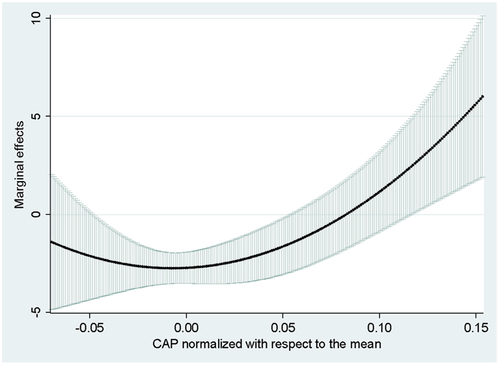
Based on the plot in for the contractionary monetary scenario, the negative impact of an increase in the interbank interest rate is relatively strong in banks with low levels of capital. In particular, for banks with the level of capital less than 0.053 (0.166 without normalization), the impact of monetary policy on bank loan supply is negatively significant, showing more sensitivity of these banks to the monetary contraction. In this interval, the marginal effect of monetary policy on bank loan supply has a range of −2.179 and −1.456. For banks with the capital level ranging from 0.054 to 0.116 (from 0.167 to 0.228 without normalization), there is no marginal effect on bank loan supply. However, when the capital level is 0.117 (0.229 without normalization) or greater, these banks are less affected by the contractionary monetary policy. These findings are consistent with prior studies to some extent, which indicates that banks with low (high) level of capital could be more (less) sensitive to monetary restrictions (Altunbaş et al., Citation2002; Rashid et al., Citation2020). In addition to these previous findings, this empirical result shows the presence of capital’s range of banks showing no impact of monetary policy on bank loan supply, thus not lending the support for Hypothesis 2a.
Given the plot in for the expansionary monetary scenario, if the marginal effect is negative, a decrease in the interest rate will reflect the positive sign, and vice versa (Sáiz et al., Citation2018). shows that when the level of bank capital increases, the positive effect of monetary policy accordingly increases (from the minimum value of 3.964 to the maximum one of 8.017). Therefore, banks with greater levels of capital could take advantage of the expansionary monetary policy. These results support that in a time of monetary expansion, the financial frictions are reduced and balance sheets are improved; hence, better capitalized banks could boost the loan supply more as compared to poorly capitalized counterparts. To further discussions, the banks that are less affected by monetary loosening could overcome the issues of informational asymmetry including moral hazard or adverse selection due to the strong motivation to operate in prudent ways (Holmstrom & Tirole, Citation1997). This leads to lending more and benefiting more from the extension of bank loan supply. In addition, the under-capitalized banks could not lend more under the period of monetary loosening, as compared to banks with abundant capital because they do not meet the sufficient capital requirement and have to curtail lending (Hosono, Citation2006). These results support Hypothesis 2a.
Concerning the interaction terms of monetary policy and bank-specific characteristics such as size, liquidity, and credit risk, the finding shows that larger, more liquid and low credit risk banks could be less affected by monetary policy shocks, suggesting the weakening effect of monetary policy on bank loan supply for banks with internal strength and low risk. These results are in line with most of the previous studies (Altunbaş et al., Citation2002; Bhaduri & Goyal, Citation2015; Rashid et al., Citation2020). These findings support that banks with larger size, more liquidity and less credit risk could be much more insulated from any changes in monetary policy shocks because of the accessibility to alternative funding sources and sufficient required buffers of capital to overcome the consequences of monetary policy shocks.
In addition, the product term of market concentration and monetary policy has a statistically positive sign, suggesting that banks operating in a more concentrated environment could be more prone to the monetary policy impulses. In this regard, the impact of monetary policy on the bank lending channel could vary due to the degree of market concentration, which has attracted no intention from the research in Vietnam’s banking context. In addition, the economic growth for all models has a positive influence on bank loan supply. This reflects the fact that the improvement of economic conditions could make a large number of projects more profitable, thereby raising the credit demand. These results are consistent with Bashir et al. (Citation2020) and Khan et al. (Citation2016).
show the robust results of the persistence of loan supply and the existence of the bank lending channel of monetary policy pass-through. Moreover, the asymmetric effects of monetary policy on bank loan supply based on marginal effect and the plot illustration (in ) also hold across other interest-based instruments of monetary policy (i.e., refinance rate, rediscount rate, and lending rate), indicating that there is the presence of bank capital range that the monetary policy transmission via bank lending could be ineffective, and well-capitalized banks could benefit more the loosening monetary policy as compared to banks with low capitalization.
Figure 3. The marginal impact of monetary policy on the loan growth with respect to various levels of bank capital in case of the increase of the refinance rate by 3.63%.Note: Y-axis denotes marginal effect of monetary policy pass-through and X-axis is the level of bank capital in normalized form. The range of gray stripes refers to the confidence interval band of 90%.Source: Author’s plot construction for interpretation of research results.a Further investigation with the lag of monetary policy
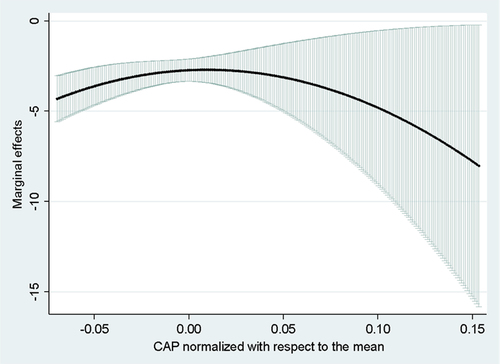
Figure 4. The marginal impact of monetary policy on the loan growth in regard to various levels of bank capital in case of the decrease of the refinance rate by—1.54%.Note: Y-axis denotes marginal effect of monetary policy pass-through and X-axis is the level of bank capital in normalized form. The range of gray stripes refers to the confidence interval band of 90%.Source: Author’s plot construction for interpretation of research results.a Further investigation with the lag of monetary policy
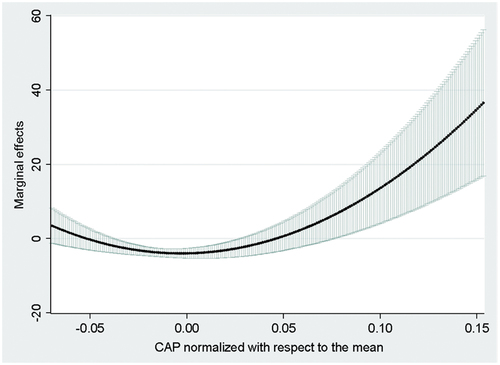
Figure 5. The marginal impact of monetary policy on the loan growth with respect to various levels of bank capital in case of the increase of the rediscount rate by 3.94%.Note: Y-axis denotes marginal effect of monetary policy pass-through and X-axis is the level of bank capital in normalized form. The range of gray stripes refers to the confidence interval band of 90%.Source: Author’s plot construction for interpretation of research results.a Further investigation with the lag of monetary policy
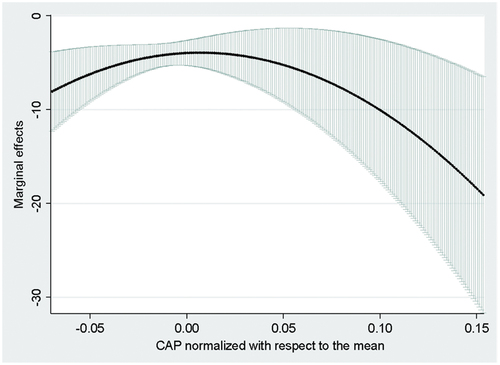
Figure 6. The marginal impact of monetary policy on the loan growth in regard to various levels of bank capital in case of the decrease of the rediscount rate by −1.60%.Note: Y-axis denotes marginal effect of monetary policy pass-through and X-axis is the level of bank capital in normalized form. The range of gray stripes refers to the confidence interval band of 90%.Source: Author’s plot construction for interpretation of research results.a Further investigation with the lag of monetary policy
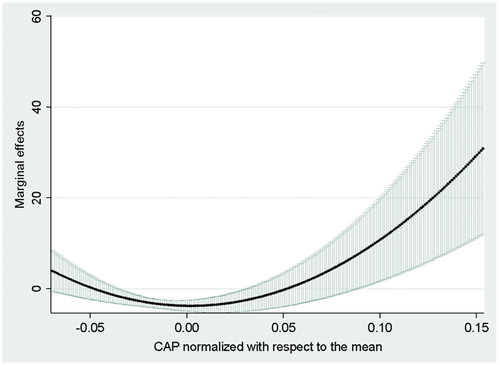
Figure 7. The marginal impact of monetary policy on the loan growth with respect to various levels of bank capital in case of the increase of lending interest rate by 1.83%.Note: Y-axis denotes marginal effect of monetary policy pass-through and X-axis is the level of bank capital in normalized form. The range of gray stripes refers to the confidence interval band of 90%.Source: Author’s plot construction for interpretation of research results.a Further investigation with the lag of monetary policy
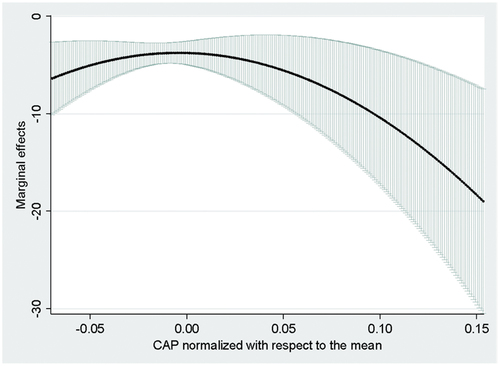
Figure 8. The marginal impact of monetary policy on the loan growth in regard to various levels of bank capital in case of the decrease of lending interest rate by −2.33%.Note: Y-axis denotes marginal effect of monetary policy pass-through and X-axis is the level of bank capital in normalized form. The range of gray stripes refers to the confidence interval band of 90%.Source: Author’s plot construction for interpretation of research results.a Further investigation with the lag of monetary policy
As noted in the work of Anwar and Nguyen (Citation2018), the impact of monetary policy on real economy has a significant lag.Footnote30 Therefore, the lagged form of all instruments of monetary policy should be included to capture the policy lag. As displayed in for findings based on the regression estimations with full variables and plot illustration for both monetary regimes of each model, the empirical results are virtually unchanged as compared to those reported previously. More specifically, the bank loan persistence and the presence of monetary policy transmission via the bank lending mechanism hold true in Vietnam. The squared interaction terms between variables accounting for monetary policy tools and bank capitalization are statistically significant across all models, suggesting the asymmetric signal in the impact of bank capital on monetary pass-through via the bank lending channel. The plot construction further provides the responses of bank loans to monetary shocks depending on the different values of bank capital. show the same pattern with , respectively, indicating the existence of the level range of bank capital that monetary policy is not effective in the monetary restrictions and more benefits that well-capitalized banks take by lending more.
Figure 9. The marginal impact of monetary policy on the loan growth with respect to various levels of bank capital in case of the increase of lending interest rate by 1.75%. Based on model (a) in .Note: Y-axis denotes marginal effect of monetary policy pass-through and X-axis is the level of bank capital in normalized form. The range of gray stripes refers to the confidence interval band of 90%.Source: Author’s plot construction for interpretation of research results.a Further investigation with the lag of monetary policy
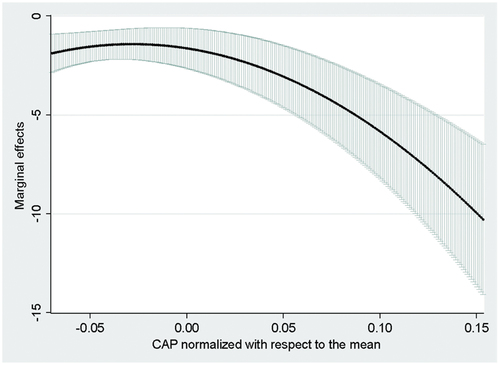
Figure 10. The marginal impact of monetary policy on the loan growth in regard to various levels of bank capital in case of the decrease of lending interest rate by −2.31%. Based on model (a) in .Note: Y-axis denotes marginal effect of monetary policy pass-through and X-axis is the level of bank capital in normalized form. The range of gray stripes refers to the confidence interval band of 90%.Source: Author’s plot construction for interpretation of research results
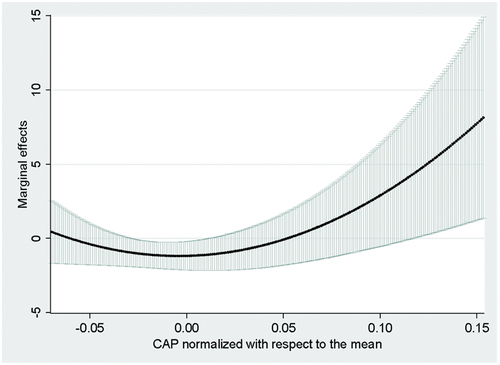
Figure 11. The marginal impact of monetary policy on loan growth with respect to various levels of bank capital in case of the increase of refinance rate by 3.59%. Based on model (b) in .Note: Y-axis denotes marginal effect of monetary policy pass-through and X-axis is the level of bank capital in normalized form. The range of gray stripes refers to the confidence interval band of 90%.Source: Author’s plot construction for interpretation of research results
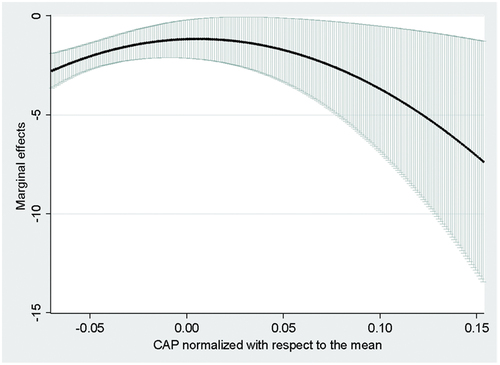
Figure 12. The marginal impact of monetary policy on the loan growth in regard to various levels of bank capital in case of the decrease of refinance rate by—1.42%. Based on model (b) in .Source: Author’s plot construction for interpretation of research results
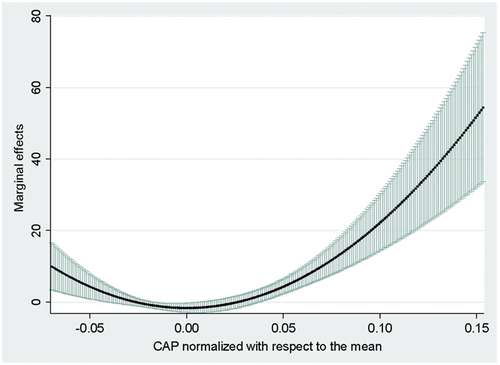
Figure 13. The marginal impact of monetary policy on the loan growth with respect to various levels of bank capital in case of the increase of the rediscount rate by 3.9%. Based on model (c) in .Note: Y-axis denotes marginal effect of monetary policy pass-through and X-axis is the level of bank capital in normalized form. The range of gray stripes refers to the confidence interval band of 90%.Source: Author’s plot construction for interpretation of research results
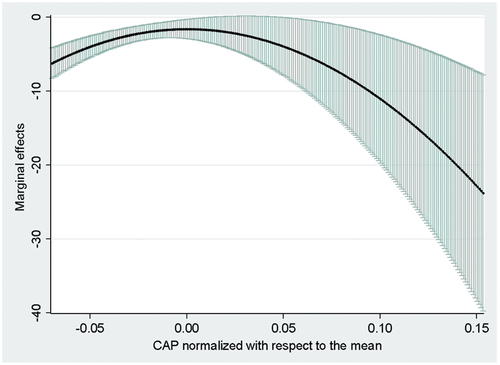
Figure 14. The marginal impact of monetary policy on the loan growth in regard to various levels of bank capital in case of the decrease of the rediscount rate by −1.49%. Based on model (c) in .Note: Y-axis denotes marginal effect of monetary policy pass-through and X-axis is the level of bank capital in normalized form. The range of gray stripes refers to the confidence interval band of 90%.Source: Author’s plot construction for interpretation of research results
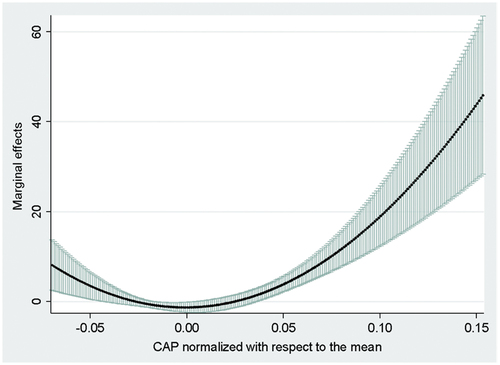
Figure 15. The marginal impact of monetary policy on the loan growth with respect to various levels of bank capital in case of the increase of short-term interbank interest rate by 2.47%. Based on model (d) in .Note: Y-axis denotes marginal effect of monetary policy pass-through and X-axis is the level of bank capital in normalized form. The range of gray stripes refers to the confidence interval band of 90%.Source: Author’s plot construction for interpretation of research results
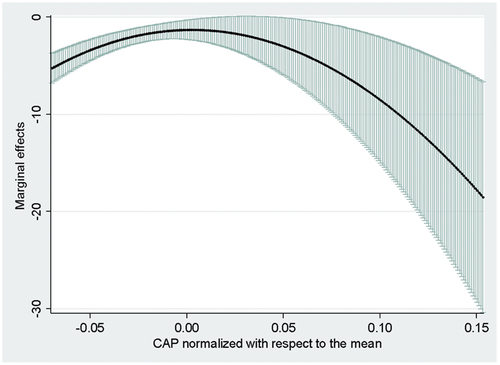
Figure 16. The marginal impact of monetary policy on the loan growth in regard to various levels of bank capital in case of the decrease of short-term interbank interest rate by −1.82%. Based on model (d) in .Note: Y-axis denotes marginal effect of monetary policy pass-through and X-axis is the level of bank capital in normalized form. The range of gray stripes refers to the confidence interval band of 90%.Source: Author’s plot construction for interpretation of research results
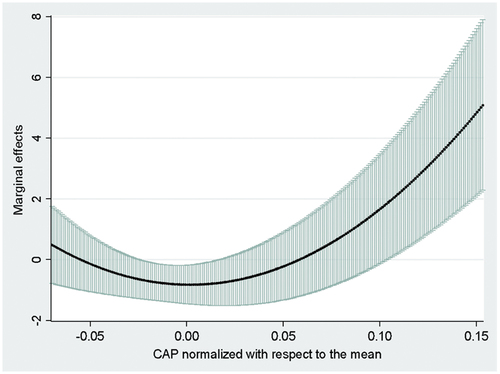
Table 8. The monetary policy transmission through the lagged interest-based instruments of monetary policy conditioned by bank capital in the dynamic model with full variables
5. Conclusion
The role of bank capital on the monetary policy transmission via bank lending channel has been paid increasing attention due to the pivotal position of banks in maintaining their credit supply, taking advantage of bank “buffers” against loss and risk, and meeting the capital requirement from regulators for the stability of the banking system. The main focus of this paper is to answer the question of how different responses of banks with different values of capital to the monetary policy transmission via bank lending channel. This research is motivated from the perspective of the distributional effect of bank capital on monetary policy pass-through (Altunbaş et al., Citation2002; Gambacorta, Citation2005; Jiménez et al., Citation2012; Kishan & Opiela, Citation2000, Citation2006; Van den Heuvel, Citation2002), especially via the bank lending mechanism. More precisely, under-capitalized banks could be more susceptible to contractionary monetary policy and that such banks have less benefit from expansionary monetary policy, as compared to well-capitalized peers.
However, previous studies commonly use the categorical levels of bank capital or the interaction term between monetary policy and bank capital to test the distribution effect of bank capital on monetary policy pass-through, which has been criticized for two primary disadvantages related to comparability and the sufficient information for analysis, respectively. In this regard, the post-estimation analysis of marginal effect combined with the plot illustration could supplementarily provide a more comprehensive picture of the different banks’ reaction to both regimes of monetary policy through the growth of bank loan supply when considering the various values of bank capital.
By using the marginal effect analysis for a sample of 30 Vietnamese commercial banks from 2007 to 2020, the research provides empirical evidence of the presence of monetary policy transmission via bank lending channel and the persistence of bank loan supply, which remains consistent with previous studies. These results hold true across (i) a series of instruments of the monetary policy, (ii) the approach adding each variable into the baseline model, and (iii) the inclusion of the lagged interest rate allowing for the lag policy, to check robustness of main relationships. In addition to the evidence of the distributional effect of capital in prior studies, this study shows that there is the presence of bank’s capital levels that monetary policy shows no effect on bank loan supply. Furthermore, well-capitalized banks could better gain benefits from the monetary expansion due to the increased ability to lend more, as compared to under-capitalized counterparts.
Given these findings, researchers could employ the marginal effect analysis associated with plots to identify the response of bank loan supply to monetary policy shocks depending on the various levels of bank capital, but limited to other bank’s balance sheet items. In addition, the policy-makers should carefully consider these findings to properly respond to the monetary policy adoption. Without a better interpretation of the asymmetric effect of bank capital on the monetary transmission of the bank lending mechanism, the desired outcomes from the implementation of monetary policy could not be obtained. These findings could have profound implications for capital management of commercial banks. One should note that monetary policy expansion with the aim of providing more credit to stimulate the economy will be effective if the banking system has a large level of capital. In other words, banks with under-capitalization do not benefit much from the monetary tightening as compared to banks with well capitalization. In the opposite case, contractionary monetary policy could lead to different responses in the growth of bank loan supply depending on the differentiated levels of capital. Specifically, banks with low capital levels would react more strongly to monetary policy while banks with high capital levels would not be affected much by monetary policy. Interestingly, banks with the average levels of capital seem to be neutral to monetary policy as the aforementioned result shows that there is no statistically significant effect of monetary policy on loan growth, especially for banks with the levels of capital around the average level.
This paper attempts to offer fresh insights on the asymmetry of bank capital, which is one of the most common individual bank characteristics. Further research, therefore, could address the asymmetric effect of other bank-specific factors on monetary policy transmission by benefiting greatly from the new approach of marginal effect. In this vein, the bank efficiency based on the approach of stochastic frontier analysis (SFA) could be added as the fifth bank-specific characteristic to provide more evidence to the extensive literature on the effectiveness of monetary policy depending on the bank’s efficiency. Additionally, in a broader context in banking system or financial environment, possible direction for the next study could explore the role of banking market structure or financial development on the effectiveness of monetary policy transmission via the bank lending channel. Besides, it could offer an unique finding when using unconventional monetary policy proxies instead of traditional ones into the current research’s model since there is much attention from researchers and academics for the role of non-traditional monetary policy after the 2007 global financial crisis (Derbali and Chebbi,Citation2018)
Our research highlights
A comprehensive sample of 30 commercial banks from Vietnam covering the period of 2007-2020.
The asymmetric effect of bank capital on the bank lending mechanism of monetary policy pass-through is explored.
The new approach of marginal effect analysis in combination with the representative plots is employed.
The persistence of bank supply and bank lending channels of monetary policy transmission exists.
There is the presence of bank capital levels that monetary policy has no influence on bank loan supply in a time of monetary restrictions.
During the monetary loosening, well-capitalized banks could benefit more by lending extension than poorly capitalized counterparts.
Acknowledgements
This paper captures the main part of the thesis conducted by Thanh Phuc Nguyen, Ph.D. Candidate of University of Economics Ho Chi Minh city, under the supervision of Ngoc Tho Tran. We also appreciate the helpful and constructive comments from Toan Luu Duc Huynh. We are also grateful for the valuable comments and suggestions from five anonymous reviewers that greatly improve the quality of this research.
Disclosure statement
No potential conflict of interest was reported by the author(s).
Additional information
Funding
Notes on contributors
Thanh Phuc Nguyen
Phuc Nguyen Thanh is a Ph.D. Candidate in the School of Finance from University of Economics Ho Chi Minh City, Vietnam (UEH). His research interests mainly revolve around topics related to banking and finance, risk management, and financial management. He has currently served as an anonymous reviewer for the Journal of Asian Business and Economic Studies (UEH).
Thi Thu Hong Dinh
Hong Dinh Thi Thu is a Ph.D and Senior Lecturer in the School of Finance from University of Economics Ho Chi Minh City, Vietnam (UEH). She is currently the Dean of the School of Banking (UEH). Her current research interests mainly include banking and finance, risk management, and financial markets.
Notes
1. According to (Citation2021), the banking system plays a leading position in the financing activities of modern economies. It is more pronounced in the context of ASEAN countries where the security and bond market are under-developed (Hamid & Yunus, Citation2020).
2. There are several transmission channels through which monetary policy could transmit such as risk-taking channel (Kishan & Opiela, Citation2012), interest rate channel (B. S. Bernanke, Citation1990), exchange rate channel (Golinelli & Rovelli, Citation2005), asset price channel (Mishra & Montiel, Citation2013), and credit channel (B. S. B. S. Bernanke & Gertler, Citation1995) but this paper is limited to analyzing monetary policy transmission through the bank lending channel. Accordingly, the bank lending mechanism emphasizes the role of credit supply to transmit monetary policy into the real economy (Hamid & Yunus, Citation2020).
3. Reform programmes include the ceilings for deposit and loan rate, restrictions for opening branching, constrained investment portfolios, and foreign penetration due to regulatory loosening.
4. See Appendix A for interest rate-based implementation by the SBV.
5. For instance, monetary tightening could limit the corporate investment by an increased interest rate, leading to a decrease in terms of demand side for bank loan supply. These policy shifts in loan demand could be considered as a macroeconomic shock. In addition, the heterogeneity in bank loan changes could be viewed as the shifts in the loan supply side. This could not be captured by the usage of time series data (Hosono, Citation2006).
6. The separation between loan supply side and loan demand side allows testing loan supply movements affected by bank-specific characteristics and this approach could not apply to the loan demand movements (Hamid & Yunus, Citation2020).
7. This approach is mainly focused on the evaluation of the difference of groups and periods for traditional financial research (i.e., market timing of mutual funds (Treynor & Mazuy, Citation1966)) but remains scarce in the analysis of the bank lending channel.
8. For example, Bashir et al. (Citation2020) has used the median value of each variable accounting for size, capitalization, and liquidity to divide the full sample into subsamples according to these bank-specific characteristics. However, Gambacorta (Citation2005) defined under-capitalized and well-capitalized banks as under 10th percentile and 90th percentile and greater, respectively.
9. These studies are summarized in Appendix B for more reference.
10. Studies conducted in Euro area also support that the under-capitalized banks are much more susceptible than well-capitalized counterparts (Altunbaş et al., Citation2002; Gambacorta, Citation2005; Gambacorta & Mistrulli, Citation2004; Jiménez et al., Citation2012).
11. Khan et al. (Citation2016) indicate the significant role of market concentration on monetary policy transmission via the bank lending mechanism for ASEAN countries. In this regard, the increase in market concentration could weaken the effectiveness of monetary policy. Therefore, the variables accounting for market concentration are included to test whether any meaningful linkage could be found between market structure and the monetary policy bank lending channel.
12. This approach has been widely conducted in previous studies (Ehrmann et al., Citation2001; Gambacorta, Citation2005; Gambacorta & Marques-Ibanez, Citation2011; Jimborean, Citation2009).
13. The best selection of interest rate-based monetary policy instruments are inconclusive (Altunbas et al., Citation2010; Chen et al., Citation2017; Ehrmann et al., Citation2003; Khan et al., Citation2016; De Moraes et al., Citation2016; Olivero et al., Citation2011; Sáiz et al., Citation2018; Yang & Shao, Citation2016).
14. For instance, the lending rate could affect the funding cost of borrowers while the refinance and rediscount rate are implemented by the SBV as the role of the last resort, applying for the direct loans and the discountable valuable papers, respectively. In addition, the reserve rate and basic interest rate tools are not employed in this paper due to the long-time stable characteristics.
15. To the best of understanding, scarce studies have included the squared interaction term between monetary policy proxies and the variables of interest to address the asymmetric impacts of the monetary policy via the bank lending mechanism (Cantero-Saiz et al., Citation2014; Sáiz et al., Citation2018; Sanfilippo-Azofra et al., Citation2018). For example, Sanfilippo-Azofra et al. (Citation2018) analyze the marginal effect of monetary policy changes on bank loan supply depending on the financial development levels, suggesting the potency of monetary policy transmission via the bank lending mechanism varying according to different figures of financial development.
16. The normalized bank-specific characteristics such as CAP, SIZE, LIQ, and LLP take the average zero in its values (Zhan et al., Citation2021).
17. In this study, the mean annual increase and decrease in ∆it could be employed to account for the contractionary and expansionary monetary policy, respectively (Sanfilippo-Azofra et al., Citation2018). Since the variable MC is not in the normalized form, the median value of MC is used to compute marginal values (Sáiz et al., Citation2018). In this regard, the increased mean values of lending rate, interbank interest rate, refinance rate, and rediscount rate are 1.83%, 2.55%, 3.63%, and 3.94%, respectively; meanwhile, the decreased mean figures of these interest rates are −2.33%, −1.92%, −1.54%, and −1.60%, respectively.
18. In the case of this research, 30 commercial banks and 14 years (from 2007 to 2020) were retrieved to build the panel data.
19. This method takes advantage of first-step residual estimation using as instruments to make regression coefficients more efficient than one-step system GMM (Arellano & Bover, Citation1995; Blundell & Bond, Citation1998).
20. The experiment approach is applied to a two-step system GMM to choose the optimal number of instruments, which avoids the over-fitting issue when the model has additional instruments (Matousek & Solomon, Citation2018).
21. Based on the bank information published by the SBV for the end of 2020, there are 31 commercial joint stock banks operating in Vietnam. Because of special controls in 2015, Dong A Commercial Joint Stock Bank (DAB) was removed from the studied sample to remain consistent in normal operation among these banks. All studied banks are reported in Appendix E. In addition, the standardized pattern of financial reports from Vietnamese commercial banks has been implemented since 2007. Furthermore, prior to 2007, the published and audited financial reports mainly belonged to a few large banks.
22. Several studies also employed the dataset on the annual basis (Gambacorta, Citation2005; Nguyen et al., Citation2020). These authors suggest that using the annual observations are enough to address the heterogeneity in the adjustment of bank lending supply to monetary policy.
23. This adoption could facilitate the testing of second-order serial correlations to remain the robust estimates carried out by system-GMM (Arellano & Bond, Citation1991).
24. For example, Hanoi Building Commercial Joint Stock Bank (HBB), Housing Bank of Mekong Delta (MHB), and Southern Bank (PNB) were removed due to being under mergers and acquisition in August—2012, May—2015, and October—2015, respectively.
25. This winsorizing approach is followed by the work of Dang and Nguyen (Citation2020).
26. The threshold value of 0.8 is similarly used by Vo (Citation2018).
27. For the research on bank lending channel, Cantero-Saiz et al. (Citation2014) has used the baseline model including well-established bank-specific characteristics (SIZE, LIQ, and CAP) and then adding the variable accounting for loan loss provision (LLP) into this model, followed by inclusion of the variable accounting for market concentration (MC). This approach is named as the “nested stepwise regression” (Zhan et al., Citation2021).
28. This means the extent to which a bank remains in the same distribution of loan supply, referring to the explanation of Le and Ngo (Citation2020) for bank profitability.
29. The sign of squared interaction terms between monetary policy and bank capital could reveal the asymmetric signal of bank capital’s impact on monetary policy transmission; hence, plot charts for both regimes of monetary policy are supplementary constructed to have the proper understandings of the response of bank lending to changes in monetary transmission, which could vary with the different levels of bank capital (Sáiz et al., Citation2018). We use the syntax of Stata 15.1 software as described in Appendix D.
30. Vo and Nguyen (Citation2014) also address the lag in policy’s effect by inclusion of a lagged interest rate in the model of monetary policy transmission of the bank lending channel.
31. This approach is similar to the confidence interval calculation in the work of Aiken et al. (Citation1991).
32. ∆it takes the specific mean increased/decreased value, thereby treated as a constant.
References
- Adams, R. M., & Amel, D. F. (2011). Market structure and the pass-through of the federal funds rate. Journal of Banking & Finance, 35(5), 1087–40. https://doi.org/10.1016/j.jbankfin.2010.09.020
- Aiken, L. S., West, S. G., & Reno, R. R. (1991). Multiple regression: Testing and interpreting interactions. sage.
- Akinci, D. A., Matousek, R., Radić, N., & Stewart, C. (2013). Monetary policy and the banking sector in Turkey. Journal of International Financial Markets, Institutions and Money, 27, 269–285. https://doi.org/10.1016/j.intfin.2013.08.001
- Altunbaş, Y., Fazylov, O., & Molyneux, P. (2002). Evidence on the bank lending channel in Europe. Journal of Banking & Finance, 26(11), 2093–2110. https://doi.org/10.1016/S0378-4266(02)00201-7
- Altunbas, Y., Gambacorta, L., & Marques-Ibanez, D. (2010). Bank risk and monetary policy. Journal of Financial Stability, 6(3), 121–129. https://doi.org/10.1016/j.jfs.2009.07.001
- Anwar, S., & Nguyen, L. P. (2018). Channels of monetary policy transmission in Vietnam. Journal of Policy Modeling, 40(4), 709–729. https://doi.org/10.1016/j.jpolmod.2018.02.004
- Arellano, M., & Bond, S. (1991). Some tests of specification for panel data: Monte Carlo evidence and an application to employment equations. The Review of Economic Studies, 58(2), 277–297. https://doi.org/10.2307/2297968
- Arellano, M., & Bover, O. (1995). Another look at the instrumental variable estimation of error-components models. Journal of Econometrics, 68(1), 29–51. https://doi.org/10.1016/0304-4076(94)01642-D
- Asbeig, H. I., & Kassim, S. H. (2015). Monetary transmission during a low interest rate environment in a dual banking system: Evidence from Malaysia. Macroeconomics and Finance in Emerging Market Economies, 8(3), 275–285. https://doi.org/10.1080/17520843.2015.1060248
- Bashir, U., Yugang, Y., & Hussain, M. (2020). Role of bank heterogeneity and market structure in transmitting monetary policy via bank lending channel: Empirical evidence from Chinese banking sector. Post-Communist Economies, 32(8), 1038–1061. https://doi.org/10.1080/14631377.2019.1705082
- Ben, B., & Blinder, A. S. (1988). Credit, money, and aggregate demand. American Economic Review, 78(2), 435–439. https://www.jstor.org/stable/1818164
- Bernanke, B. (1990a). The federal funds rate and the channels of monetary transmission. American Economic Association. Retrieved from
- Bernanke, B. S., & Gertler, M. (1995). Inside the black box: The credit channel of monetary policy transmission. Journal of Economic Perspectives, 9(4), 27–48. https://doi.org/10.1257/jep.9.4.27
- Bernanke, B., & James, H. (1990). The gold standard, deflation, and financial crisis in the Great Depression: An international comparison (0898-2937). Financial Markets and Financial Crisis, Hubbard, editor. Chicago: University of Chicago Press, 1991.
- Bertay, A. C., Demirgüç-Kunt, A., & Huizinga, H. (2012). Bank ownership and credit over the business cycle: Is lending by state banks less procyclical? The World Bank.
- Bhaduri, S. N., & Goyal, T. (2015). The bank lending channel of monetary policy transmission: Evidence from an emerging market, India. International Journal of Banking, Accounting and Finance, 6(1), 1–20. https://doi.org/10.1504/IJBAAF.2015.070505
- Blundell, R., & Bond, S. (1998). Initial conditions and moment restrictions in dynamic panel data models. Journal of Econometrics, 87(1), 115–143. https://doi.org/10.1016/S0304-4076(98)00009-8
- Bolton, P., & Freixas, X. (2006). Corporate finance and the monetary transmission mechanism. The Review of Financial Studies, 19(3), 829–870. https://doi.org/10.1093/rfs/hhl002
- Cantero-Saiz, M., Sanfilippo-Azofra, S., Torre-Olmo, B., & López-Gutiérrez, C. (2014). Sovereign risk and the bank lending channel in Europe. Journal of International Money and Finance, 47, 1–20. https://doi.org/10.1016/j.jimonfin.2014.04.008
- Chen, M., Wu, J., Jeon, B. N., & Wang, R. (2017). Monetary policy and bank risk-taking: Evidence from emerging economies. Emerging Markets Review, 31, 116–140. https://doi.org/10.1016/j.ememar.2017.04.001
- Dang, V. D., Dang, V. C., & McMillan, D. (2021). Bank diversification and the effectiveness of monetary policy transmission: Evidence from the bank lending channel in Vietnam. Cogent Economics & Finance, 9(1), 1885204. https://doi.org/10.1080/23322039.2021.1885204
- Dang, V. D., & Nguyen, K. Q. B. (2020). Monetary policy, bank leverage and liquidity. International Journal of Managerial Finance, 17(4). https://doi.org/10.1108/IJMF-06-2020-0284
- Davydov, D., Fungáčová, Z., & Weill, L. (2018). Cyclicality of bank liquidity creation. Journal of International Financial Markets, Institutions and Money, 55, 81–93. https://doi.org/10.1016/j.intfin.2018.02.014
- De Moraes, C. O., Montes, G. C., & Antunes, J. A. P. (2016). How does capital regulation react to monetary policy? New evidence on the risk-taking channel. Economic Modelling, 56, 177–186. https://doi.org/10.1016/j.econmod.2016.03.025
- Deng, X., & Liu, L. (2014). The bank lending channel: Evidence from Australia. Australasian Accounting, Business and Finance Journal, 8(2), 71–87. https://doi.org/10.14453/aabfj.v8i2.6
- Derbali, A.,& Chebbi, T. (2018). ECB monetary policy surprises and Euro area sovereign yield spreads. International Journal of Management and Network Economics, 81, 177–198. https://www.inderscienceonline.com/doi/abs/10.1504/IJMNE.2018.095193
- Disyatat, P. (2011). The bank lending channel revisited. Journal of Money, Credit, and Banking, 43(4), 711–734. https://doi.org/10.1111/j.1538-4616.2011.00394.x
- Ehrmann, M., Gambacorta, L., Martínez-Pagés, J., Sevestre, P., & Worms, A. (2001). Financial systems and the role of banks in monetary policy transmission in the euro area. https://dx.doi.org/10.2139/ssrn.356660
- Ehrmann, M., Gambacorta, L., Martinez‐Pagés, J., Sevestre, P., & Worms, A. (2003). The effects of monetary policy in the euro area. Oxford Review of Economic Policy, 19(1), 58–72. https://doi.org/10.1093/oxrep/19.1.58
- Ferri, G., Kalmi, P., & Kerola, E. (2014). Does bank ownership affect lending behavior? Evidence from the Euro area. Journal of Banking & Finance, 48, 194–209. https://doi.org/10.1016/j.jbankfin.2014.05.007
- Gambacorta, L. (2005). Inside the bank lending channel. European Economic Review, 49(7), 1737–1759. https://doi.org/10.1016/j.euroecorev.2004.05.004
- Gambacorta, L., & Marques-Ibanez, D. (2011). The bank lending channel: Lessons from the crisis. Economic Policy, 26(66), 135–182. https://doi.org/10.1111/j.1468-0327.2011.00261.x
- Gambacorta, L., & Mistrulli, P. E. (2004). Does bank capital affect lending behavior? Journal of Financial Intermediation, 13(4), 436–457. https://doi.org/10.1016/j.jfi.2004.06.001
- Gibson, M. S. (1997). The bank lending channel of monetary policy transmission: Evidence from a model of bank behavior that incorporates long-term customer relationships (Vol. 584). Board of Governors of the Federal Reserve System Washington, DC.
- Golinelli, R., & Rovelli, R. (2005). Monetary policy transmission, interest rate rules and inflation targeting in three transition countries. Journal of Banking & Finance, 29(1), 183–201. https://doi.org/10.1016/j.jbankfin.2004.06.021
- Gómez-González, J., & Grosz, F. (2007). Evidence of a bank lending channel for Argentina and Colombia. Cuadernos de Economía, 44(129), 109–126. https://dx.doi.org/10.2139/ssrn.356660
- Gomez-Gonzalez, J. E., Kutan, A., Ojeda-Joya, J. N., & Ortiz, C. (2020). Does the financial structure of banks influence the bank lending channel of monetary policy? Evidence from Colombia. International Journal of Emerging Markets, 16(4). https://doi.org/10.1108/IJOEM-08-2019-0664
- Hamid, F. S., & Yunus, N. M. (2020). Bank-lending channel of monetary policy transmission: Evidence from ASEAN. Global Business Review, 21(4), 892–905. https://doi.org/10.1177/0972150919856959
- Heryán, T., & Tzeremes, P. G. (2017). The bank lending channel of monetary policy in EU countries during the global financial crisis. Economic Modelling, 67, 10–22. https://doi.org/10.1016/j.econmod.2016.07.017
- Holmstrom, B., & Tirole, J. (1997). Financial intermediation, loanable funds, and the real sector. The Quarterly Journal of Economics, 112(3), 663–691. https://doi.org/10.1162/003355397555316
- Hoshi, T., Scharfstein, D., & Singleton, K. J. (2007). Japanese Corporate Investment and Bank of Japan Guidance of Commercial Bank Lending. In Japanese monetary policy (pp. 63–94)). University of Chicago Press.
- Hosono, K. (2006). The transmission mechanism of monetary policy in Japan: Evidence from banks’ balance sheets. Journal of the Japanese and International Economies, 20(3), 380–405. https://doi.org/10.1016/j.jjie.2005.07.003
- Jayaratne, J., & Morgan, D. P. (2000). Capital market frictions and deposit constraints at banks. Journal of Money, Credit, and Banking, 32(1), 74–92. https://doi.org/10.2307/2601093
- Jimborean, R. (2009). The role of banks in the monetary policy transmission in the new EU member states. Economic Systems, 33(4), 360–375. https://doi.org/10.1016/j.ecosys.2009.08.001
- Jiménez, G., Ongena, S., Peydró, J.-L., & Saurina, J. (2012). Credit supply and monetary policy: Identifying the bank balance-sheet channel with loan applications. American Economic Review, 102(5), 2301–2326. https://doi.org/10.1257/aer.102.5.2301
- Juurikkala, T., Karas, A., & Solanko, L. (2011). The role of banks in monetary policy transmission: Empirical evidence from Russia. Review of International Economics, 19(1), 109–121. https://doi.org/10.1111/j.1467-9396.2010.00935.x
- Kakes, J., & Sturm, J.-E. (2002). Monetary policy and bank lending:: Evidence from German banking groups. Journal of Banking & Finance, 26(11), 2077–2092. https://doi.org/10.1016/S0378-4266(02)00200-5
- Kashyap, A. K., & Stein, J. C. (1995a). The impact of monetary policy on bank balance sheets. Paper presented at the Carnegie-Rochester conference series on public policy, 42, 151–195. North-Holland. https://doi.org/10.1016/0167-2231(95)00032-U
- Kashyap, A. K., Stein, J. C., & Jeremy, C. (1995b). The role of banks in the transmission of monetary policy. Carnegie Rochester Conference Series on Public Policy, 42, 151–1956.
- Kashyap, A. K., & Stein, J. C. (2000). What do a million observations on banks say about the transmission of monetary policy? American Economic Review, 90(3), 407–428. https://doi.org/10.1257/aer.90.3.407
- Kashyap, A. K., Stein, J. C., & Wilcox, D. W. (1992). Monetary policy and credit conditions: Evidence from the composition of external finance. American Economic Review, 83(1), 78–98. Retrieved from https://www.nber.org/papers/w4015 Thank you
- Khalfaoui, H.,& Derbali, A. (2021). Money creation process, banking performance and economic policy uncertainty: Evidence from Tunisian listed banks. International Journal of Social Economics, 48(8), 1175–1190. https://doi.org/10.1108/IJSE-12-2020-0784
- Khan, H. H., Ahmad, R. B., & Gee, C. S. (2016). Bank competition and monetary policy transmission through the bank lending channel: Evidence from ASEAN. International Review of Economics & Finance, 44, 19–39. https://doi.org/10.1016/j.iref.2016.03.003
- Kishan, R. P., & Opiela, T. P. (2000). Bank size, bank capital, and the bank lending channel. Journal of Money, Credit, and Banking, 32(1), 121–141. https://doi.org/10.2307/2601095
- Kishan, R. P., & Opiela, T. P. (2006). Bank capital and loan asymmetry in the transmission of monetary policy. Journal of Banking & Finance, 30(1), 259–285. https://doi.org/10.1016/j.jbankfin.2005.05.002
- Kishan, R. P., & Opiela, T. P. (2012). Monetary policy, bank lending, and the risk‐pricing channel. Journal of Money, Credit, and Banking, 44(4), 573–602. https://doi.org/10.1111/j.1538-4616.2012.00502.x
- Le, T. D., & Ngo, T. (2020). The determinants of bank profitability: A cross-country analysis. Central Bank Review, 20(2), 65–73. https://doi.org/10.1016/j.cbrev.2020.04.001
- Leroy, A. (2014). Competition and the bank lending channel in the Eurozone. Journal of International Financial Markets, Institutions and Money, 31, 296–314. https://doi.org/10.1016/j.intfin.2014.04.003
- Li, N., & Lee, Y. (2015). The bank-lending channel of monetary policy transmission in China: A comparison between Chinese and foreign banks. Korea and the World Economy, 16(2), 167–193. http://www.akes.or.kr/wp-content/uploads/2018/03/16.2.1-Nan-Li_Yeonho-Lee-%EC%B5%9C%EC%A2%85.pdf
- Louhichi, A., & Boujelbene, Y. (2017). Bank capital, lending and financing behaviour of dual banking systems. Journal of Multinational Financial Management, 41, 61–79. https://doi.org/10.1016/j.mulfin.2017.05.009
- Mamatzakis, E., & Bermpei, T. (2016). What is the effect of unconventional monetary policy on bank performance? Journal of International Money and Finance, 67, 239–263. https://doi.org/10.1016/j.jimonfin.2016.05.005
- Matousek, R., & Sarantis, N. (2009). The bank lending channel and monetary transmission in Central and Eastern European countries. Journal of Comparative Economics, 37(2), 321–334. https://doi.org/10.1016/j.jce.2008.09.008
- Matousek, R., & Solomon, H. (2018). Bank lending channel and monetary policy in Nigeria. Research in International Business and Finance, 45, 467–474. https://doi.org/10.1016/j.ribaf.2017.07.180
- Meral, G. (2015). The effect of bank size and bank capital on the bank lending channel for Turkish banks. American Scientific Research Journal for Engineering, Technology, and Sciences (ASRJETS), 12(1), 1–28. https://asrjetsjournal.org/index.php/American_Scientific_Journal/article/view/596/501
- Mishra, P., & Montiel, P. (2013). How effective is monetary transmission in low-income countries? A survey of the empirical evidence. Economic Systems, 37(2), 187–216. https://doi.org/10.1016/j.ecosys.2012.12.001
- Nguyen, T. V. H., Pham, T. T. T., Nguyen, C. P., Nguyen, T. C., & Nguyen, B. T. (2020). Excess liquidity and net interest margins: Evidence from Vietnamese banks. Journal of Economics and Business, 110, 105893. https://doi.org/10.1016/j.jeconbus.2020.105893
- Oliner, S. D., & Rudebusch, G. D. (1993). Is there a bank credit channel for monetary policy? No. 93-8. Board of Governors of the Federal Reserve System (US).
- Olivero, M. P., Li, Y., & Jeon, B. N. (2011). Consolidation in banking and the lending channel of monetary transmission: Evidence from Asia and Latin America. Journal of International Money and Finance, 30(6), 1034–1054. https://doi.org/10.1016/j.jimonfin.2011.06.006
- Ono, S. (2015). Bank lending channel in monetary policy transmission: Evidence from Russia. International Journal of Economics and Finance, 7(4), 1–11. https://doi.org/10.5539/ijef.v7n4p1
- Peek, J., & Rosengren, E. S. (1995). Bank lending and the transmission of monetary policy. In Conference series-Federal Reserve Bank of Boston, 39, 47-68. Federal Reserve Bank of Boston.
- Rashid, A., Hassan, M. K., & Shah, M. A. R. (2020). On the role of Islamic and conventional banks in the monetary policy transmission in Malaysia: Do size and liquidity matter? Research in International Business and Finance, 52, 101123. https://doi.org/10.1016/j.ribaf.2019.101123
- Roodman, D. (2009). How to do Xtabond2: An introduction to difference and system GMM in Stata. The Stata Journal: Promoting Communications on Statistics and Stata, 9(1), 86–136. https://doi.org/10.1177/1536867X0900900106
- Sáiz, M. C., Azofra, S. S., Olmo, B. T., & Gutiérrez, C. L. (2018). A new approach to the analysis of monetary policy transmission through bank capital. Finance Research Letters, 24, 95–104. https://doi.org/10.1016/j.frl.2017.07.021
- Sanfilippo-Azofra, S., Torre-Olmo, B., Cantero-Saiz, M., & López-Gutiérrez, C. (2018). Financial development and the bank lending channel in developing countries. Journal of Macroeconomics, 55, 215–234. https://doi.org/10.1016/j.jmacro.2017.10.009
- Saxegaard, M. (2006). Excess liquidity and effectiveness of monetary policy: Evidence from sub-Saharan Africa. https://dx.doi.org/10.2139/ssrn.910680
- Treynor, J., & Mazuy, K. (1966). Can mutual funds outguess the market. Harvard Business Review, 44(4), 131–136.
- Van den Heuvel, S. J. (2002). Banking conditions and the effects of monetary policy: Evidence from US states. University of Pennsylvania.
- Van Hai, B., & Trang, T. T. M. (2015). The transmission mechanism of monetary policy in Vietnam: A VAR approach (No. 15/2015). Graduate Institute of International and Development Studies. Working Paper.
- Vo, X. V. (2018). Bank lending behavior in emerging markets. Finance Research Letters, 27, 129–134. https://doi.org/10.1016/j.frl.2018.02.011
- Vo, X. V., & Nguyen, P. C. (2014). Monetary policy and bank credit risk in Vietnam pre and post global financial crisis. In Risk management post financial crisis: A period of monetary easing. Emerald Group Publishing Limited. https://doi.org/10.1108/S1569-375920140000096011
- Vo, X. V., & Nguyen, P. C. (2017). Monetary policy transmission in Vietnam: Evidence from a VAR approach. Australian Economic Papers, 56(1), 27–38. https://doi.org/10.1111/1467-8454.12074
- Vu, H., & Nahm, D. (2013). The determinants of profit efficiency of banks in Vietnam. Journal of the Asia Pacific Economy, 18(4), 615–631. https://doi.org/10.1080/13547860.2013.803847
- Wang, R., & Luo, H. (2021). Real estate prices and bank risk-taking in Japan. Journal of the Asia Pacific Economy, 26(1), 158–181. https://doi.org/10.1080/13547860.2020.1729930
- Yang, J., & Shao, H. (2016). Impact of bank competition on the bank lending channel of monetary transmission: Evidence from China. International Review of Economics & Finance, 43, 468–481. https://doi.org/10.1016/j.iref.2015.12.008
- Zhan, S., Tang, Y., Li, S., Yao, Y., & Zhan, M. (2021). How does money market development impact the bank lending channel of emerging countries? A case from China. The North American Journal of Economics and Finance, 57, 101381. https://doi.org/10.1016/j.najef.2021.101381
- Zins, A., & Weill, L. (2018). Cyclicality of lending in Africa: The influence of bank ownership. Emerging Markets Review, 37, 164–180. https://doi.org/10.1016/j.ememar.2018.08.002
- Zulkhibri, M. (2013). Bank-characteristics, lending channel and monetary policy in emerging markets: Bank-level evidence from Malaysia. Applied Financial Economics, 23(5), 347–362. https://doi.org/10.1080/09603107.2012.725927
Appendix A:
The chart depicting a diverse monetary policy instruments in Vietnam
Figure A1. The interest rate for the monetary policy implementation in Vietnam for the period of 2007–2020.Sources: Author’s elaboration
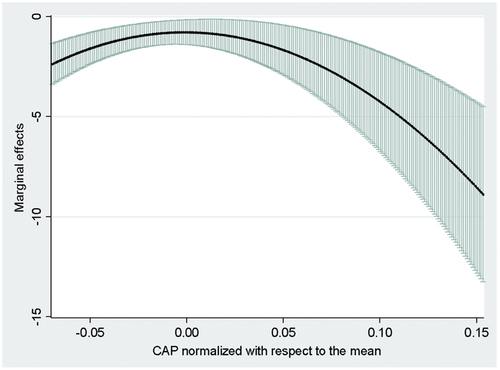
Contrary to other countries, the SBV has implemented monetary policy through a series of interest-related tools such as refinance rate, rediscount rate, lending rate and interbank interest rate in an attempt to navigate the inflation, economic growth, and macroeconomic factors. These targets have been contemporaneously taken into account by using various monetary policy instruments since 2000. In particular, the lending rate is used to provide short-term and medium-term credit for the private sector to finance their needs. Furthermore, the SBV applies the refinance rate and rediscount rate to short-term loans and discounted valuable papers, respectively. Interbank interest rate is the short-term lending rate between banks in the interbank market. Figure A1 shows frequently the simultaneous movement among these policy interest rates during the period of 2007-2020. Besides, to boost the economy, the interest-based instruments of monetary policy have been regularly navigated with a large scale, especially the period after the global crisis.
Appendix B:
The summary of previous studies on transmission of monetary policy via bank lending channel
Appendix C:
The more detailed calculation of confidence interval band in marginal effect analysis
According to EquationEquation (8)(8)
(8) , the marginal effect of monetary policy on the supply of bank loan is calculated as follows:
The standard deviation of is totally dependent not only on the standard deviation of
,
, and
, but also the value of
and
.
Due to the median value of (it could be considered as a constant), there is no effect of
on the statistical inference of results. Therefore, the average marginal effect of monetary policy is representedFootnote31:
where . To determine whether the effectiveness of monetary policy transmission bank lending mechanism is statistically significant (or
is significant), the confidence interval range needs to be reported, not just a band of confidence interval calculated by a point of
.
The standard error of
, therefore, is estimated as followsFootnote32:
Given the estimated standard deviation, the 90% confidence interval band could be obtained as follows:
Furthermore, CAP is considered as the continuous variable taking the possible value from minimum to maximum for all studied banks.
Appendix D:
The syntax for marginal effect estimation and plots
The marginal effects on bank loan supply and the plots for confidence intervals are estimated by using syntax “margins” for marginal effect estimation and “marginsplot” for plots in the Stata 15.1 software.
The representative syntax is “margins, dydx(changes in monetary policy instruments) at(lag.CAP = (range values of normalized capital) Changes in monetary policy instruments = (the average value of monetary policy instruments)) MC = (the median value of MC) (means) lag.SIZE lag.LIQ lag.LLP) level(90)”.
For example, the derivative of Specification (2) with respect to the lending rate as a monetary policy indicator under monetary policy tightening could be estimated by employing the syntax “margins, dydx(ΔLEND) at(l.CAP_Nor = (−0.070 (0.001) 0.154 ΔLEND = (0.018)) MC_Assets = (0.094) (means) l.SIZE l.LIQ l.LLP) level(90)”.
