
 ?Mathematical formulae have been encoded as MathML and are displayed in this HTML version using MathJax in order to improve their display. Uncheck the box to turn MathJax off. This feature requires Javascript. Click on a formula to zoom.
Abstract
Households around the world as well as in Indonesia have become exposed to a wider variety of vulnerabilities and risks in recent years due to an increase in the intensity and scope of natural disasters. This study aims to comprehensively examine the impact of natural disasters on Indonesian household welfare (consumption and poverty) using the Indonesian Family Life Survey (IFLS) of Wave 3 and 4. This study finds that households in rural areas are the most vulnerable to natural disasters; the average asset losses and medical/funeral costs from natural disasters are roughly USD 2,190/household. Our econometric models confirm that earthquakes are the most destructive disaster to affect household welfare, whereas droughts, forest fires, floods, and other disasters appear to have only moderate effects. Earthquakes reduce households’ probability of being non-poor by 5 percentage points. Disaster mitigation and preparedness play a significant role in reducing the devastating impacts of disasters and in lessening households’ vulnerability to poverty. The policy recommendations resulting from this study include advancing the provision of life and health insurance, promoting food buffers, and increasing households’ access to formal credit institutions.
PUBLIC INTEREST STATEMENT
The number of natural disasters appears to be increasing globally. In the case of Indonesia, natural disasters such as floods and droughts destroyed nearly 3.4 million hectares of crops, while floods and earthquakes destroyed roughly 96 thousand kilometres of roads. Households in Indonesia experienced asset loss and out-of-pocket costs from natural disasters on average around IDR 21.9 million (USD 2,190). Therefore, these have increased household’s welfare vulnerabilities. This paper examines quantitatively the relationship between natural disasters and household welfare and poverty by exploring a large-scale longitudinal survey of IFLS (Indonesia Family Life Survey). Our study will contribute to prepare better and effective ex-ante responses to ensure that any long-term negative consequences on people’s welfare may be minimized. This study confirms that earthquakes are the most destructive disaster affecting household welfare, while droughts and forest fires also significantly affect household welfare, particularly agricultural households. Disaster mitigation and preparedness play a significant role in reducing the devastating welfare impacts of disasters.
1. Introduction
Households throughout the world face a wide variety of risks from natural disasters including floods, droughts, and earthquakes. According to the Emergency Events Database (EM-DAT), the number of natural disasters appears to be increasing globally—from fewer than 100 per year in the mid-1970s to approximately 400 per year during the 2000s. In the case of Indonesia, according to the National Agency for Disaster Management (BNPB-Badan Nasional Penanggulangan Bencana), the intensity of natural disasters and the number of human victims of natural disasters have both increased significantly in recent years. From 2000 to 2015, for example, the number of people who died from disasters increased almost seventeen-fold compared to the period from 1986 to 1999. The 2004 Indian Ocean tsunami which devastated the Aceh Region was the largest contributor to the increase in deaths from 2000 to 2015. From 1990 to 2015, natural disasters such as floods and droughts destroyed nearly 3.4 million hectares of crops, while natural disasters such as floods and earthquakes destroyed roughly 96 thousand kilometres of roads. Thus, the magnitude of the social and economic consequences of recent natural events around the world, and in Indonesia specifically, has reinforced the need to place hazard-related concerns at the top of the global poverty and development agenda.
Households in low-income developing countries are particularly vulnerable to natural disasters Kurosaki et al. (Citation2012), mainly because household welfare levels are already closer to the poverty line and because such countries are more likely to lack early-warning systems and/or strong institutions for coping with disasters. The link between natural disasters and living standards is complex, however, and causality is difficult to capture empirically due to the lack of relevant studies in the literature (Sawada, Citation2007). The two-way relationship between vulnerability to natural disasters and poverty means that disasters can increase poverty, while higher levels of poverty mean disaster outcomes are likely to be much more severe. Several studies such as Chang (Citation2010), Noy (Citation2009), and Xiao (Citation2011) have assessed the impacts of disasters on economic welfare, using aggregate macroeconomic data that may not perfectly capture household welfare responses to disasters. However, the economics literature on the impact of natural disasters at the household level is still relatively scarce and in its nascency (Arouri et al., Citation2015; Morris & Wodon, Citation2003; Sawada, Citation2007; Takasaki, Citation2011) due to a scarcity of data and information on natural disasters using a standard household survey.
This paper examines quantitatively the extent to which natural disasters influence household welfare and poverty in Indonesia by utilizing a longitudinal data survey of the IFLS (Indonesia Family Life Survey). Although the consequences of disasters on household welfare are a critical issue in Indonesia, the subject remains a peripheral topic of research. Empirical studies of disaster impact on both household welfare and poverty (either in Indonesia or elsewhere) remain relatively scarce. Lindell and Prater (Citation2003) persuasively outline the policy relevance of studying the welfare impacts of natural disasters. Policy makers must first understand the impacts of natural shocks on poor households so that forthcoming disaster assistance will be more effective; second, specific population groups that are more vulnerable to natural hazards must be identified to enable planning of an effective ex-ante response to ensure that any long-term negative consequences on people’s welfare may be minimized.
The outline of this paper is as follows. It begins by providing a framework and literature review of the linkages between natural disasters, coping strategies/disaster preparedness, and household welfare (in terms of consumption and poverty). Section 3 reviews several issues of disaster exposure, damage and loss, and household welfare/poverty at the national, village, and household levels. The information provides a comprehensive picture of how disasters may influence household welfare. Section 4 outlines the research method, while section 5 discusses the estimation results of a regression analysis. Finally, the paper concludes with several important findings and policy recommendations.
2. Literature review: natural disaster, mitigation, and poverty
2.1. The link between natural disaster and poverty
While a natural hazard is defined as a natural event that threatens both life and property (e.g., earthquakes, typhoons, flooding, volcanic eruptions, and drought), disaster is generally described as the consequence of a natural hazard to individuals, societies, and the economy at large.Footnote1 Natural hazards such as earthquakes, tsunamis, and typhoons may result in numerous adverse physical impacts, depending on the hazard’s intensity and scope, the duration of its impact, and the probability of its occurrence. The physical impacts of disasters include casualties (people that are either killed or injured) as well as property and infrastructural damage at the village and regional levels. The socioeconomic impacts of natural hazards are also dependent upon socio-demographic and economic factors, such as household education level, asset ownership, and marital status.
Shocks such as natural disasters that result in lost human, physical, and social capital can reduce access to profitable opportunities in the future, either temporarily or permanently (Dercon, Citation2008). Two ways in which risks, and shocks may cause poverty are by leading households to give in to fate (i.e., the ex-post impact of shocks) and fear (i.e., the behavioural impact of shocks). Natural disasters produce fear, which may be significant enough for people to quit their jobs or leave potential business opportunities located in the disaster area. They may also give up or give in to fate, leaving behind casualties or abandoning damaged physical structures that it includes people’s home. Both fate and fear can drive households into poverty.
The damage that occurs can significantly decrease household welfare as well as their poverty status. For instance, the loss of crops results in losses to farmers’ income and, in some extreme cases, may lead to famine. The damage to property (such as housing, productive assets, and public facilities), loss of crops, the injury and death of family members, and disabilities caused by disasters, all lead to direct economic losses that can reduce household welfare and expose households to increased poverty as well as reducing economic mobility (Dartanto et al., Citation2020; Dartanto & Nurkholis, Citation2010, Citation2013). Natural disasters are also closely associated with girls entering child marriage that may result in adverse effects on women ranging from economic losses to health deterioration (Dewi & Dartanto, Citation2019). In the same case of natural disasters, there is poverty exposure bias in which poor people are often overexposed to droughts and urban floods (Winsemius et al., Citation2015).
The relationship between natural disasters and welfare/poverty can be a two-way process: not only do natural disasters increase the incidence of poverty, but poverty can in turn increase households’ exposure to natural hazards. A household’s vulnerability to natural shocks is determined by several factors (Lopez-Calva & Ortiz-Juarez, Citation2009): economic structure development stage, social and economic conditions, the availability of coping mechanisms, risk exposure, and the frequency and intensity of disasters. In the case of floods in Pakistan, Kurosaki et al. (Citation2012) found that 1) households that initially had fewer assets and experienced greater flood damage experienced more difficulties recovering from the disaster, and 2) aid recipients did not show higher or lower levels of recovery than non-recipients, especially in terms of housing damage. Elsewhere, a significant increase in poverty in disaster-affected municipalities was found in Mexico (Rodrigues-Oreggia et al., Citation2013), while in Nicaragua Van den Berg (Citation2010) was unable to find any direct evidence of disaster-induced “poverty traps”, although not all households were able to recover from disasters in a similar manner.
A complex, two-way relationship between disasters and economic and social well-being has been found in Fiji (Lal et al., Citation2009). While the study found that disasters increased poverty and reduced national economic growth, it also found increases in poverty from the impact of disasters’ outcomes were much more severe. The authors argued that a complex set of factors further influenced the depth and breadth of the relationship between disasters and poverty. In the United States, the poor were more vulnerable to natural disasters than their wealthier counterparts due to factors such as type and place of residence, building construction, and social exclusion (Fothergill & Peek, Citation2004). These studies together find that while hazards can never be fully eliminated, improved disaster preparedness, response, and recovery efforts can significantly reduce the devastating impacts of disasters on vulnerable communities.
Two further studies show that short-term constraints on recovery can cause poverty traps that result in a reduction in long-term macroeconomic growth (Stéphane Hallegatte & Dumas, Citation2009; Stephane Hallegatte et al., Citation2007). Access to resources for reconstruction, as well as the capacity to utilize those resources effectively, are both important in determining the speed and success of recovery efforts (Noy, Citation2009). On the other hand, Skidmore and Toya (Citation2002) explain the somewhat counterintuitive findings of their study suggesting that disasters may hasten the Schumpeterian “creative destruction” process, which states that recovery necessitates upgrades to equipment, infrastructure, and production processes, leading to the replacement of old technologies with new technologies.
In the case of Indonesia, adverse impacts of natural-disaster have disproportionately affected consumption-constrained households and increased projected poverty rates. Silbert et al. (Citation2011) show that factors related to economic development (such as household income level, urbanization, and institutional strength) determined losses from natural disasters. Using the Indonesian Family Life Survey (IFLS) dataset, Wong and Brown (Citation2011) found that households with a high degree of exposure to smoke from fires were more vulnerable in terms of total consumption than households with lower exposure rates. Resosudarmo et al. (Citation2012) suggest that in a village context, both the quality of village infrastructure and the existence of an industrial or business system provide the necessary support for the recovery efforts of small businesses, whereas aid distribution that is undertaken as early as possible will speed their recovery. In the case of disaster mitigation in Indonesia, households responses to extreme climate events in Indonesia have included evacuating and moving their belongings to safer places, repairing houses by using more resilient structures, installing pump machines, diversifying income sources, and borrowing money (Francisco et al., Citation2011). None of the households, however, had chosen disaster insurance as a disaster adaptation strategy.
2.2. Natural disasters, mitigation and poverty
The effects of natural hazards on households will depend on the existence of hazard-mitigation practices and disaster-preparedness practices. Having effective hazard-mitigation practices and disaster-preparedness practices in place reduces the physical impacts of a disaster. Hazard-mitigation practices are pre-impact actions that protect against casualties and damage at the time of a hazard’s impact. These include community-protection activities, land-use practices, and building-construction practices (Lindell & Perry, Citation2000). Disaster-preparedness practices also include pre-impact actions; they provide the human and material resources required to support active responses at the time of the hazard’s impact. These actions include being prepared with early-warning systems, evacuation routes, information centres, and shelters. Community-recovery resources in the form of community support such as community groups and prayer groups (arisan and pengajian, respectively, in Indonesian), family assistance, and food sharing can also reduce the hardships that result from disasters. Both community support and government assistance can minimize the socioeconomic impacts of disasters and can support households in expediting the disaster-recovery process.
Households generally try to actively manage disaster risks and shocks by choosing ex-ante strategies and/or ex-post strategies. While ex-ante strategies are used to protect households from shocks before events occur, ex-post strategies are used to reduce the adverse impacts of events once they have occurred. Ex-post strategies for coping with disasters include the use of informal credit, family labour adjustments, savings withdrawals, and the sale of assets. Ex-ante strategies, in contrast, include disaster preparedness, constructing resilient buildings, and buying insurance (Kunreuther & Michel-Kerjan, Citation2013). In choosing which strategy to apply, households’ choices will generally depend on their asset ownership, labour endowment, access to loans, government responses, and family assistance and structure (Dartanto et al., Citation2017; Dewi & Dartanto, Citation2019).
Francisco et al. (Citation2011) also define four types of coping strategy that is commonly used in response to natural hazards—behavioural, structural, technological, and financial—all of which may be categorized as ex-ante strategies. Behavioural strategies include preparing the means of evacuation, moving property to safer places, and storing food and safe drinking water; these types of strategies can minimize the adverse impacts of natural disasters. Structural strategies include, for instance, building a second floor to anticipate flooding and building earthquake-resilient houses. Technological strategies include installing early-warning systems that can alert the population when natural hazards occur so that they can seek safety. Finally, financial strategies include the buying of disaster insurance or life insurance, both of which can ensure financial security if the worst happens.
3. Overview of disaster, damage and losses in indonesia
3.1. Disaster, damage and losses at macro level
Indonesia has become more vulnerable to disasters in the last two decades; the intensity and scope of disasters and the number of disaster victims have both increased significantly. As illustrates, nearly forty times as many people were affected by disasters during the period 2000–2015 compared to the period 1985–1999. This jump in numbers is mainly due to the increased intensity and scope of disasters as well as improvements in recording measures and databases. Earthquakes and accompanying tsunamis are the deadliest types of disaster to afflict Indonesia, whereas flooding leads to mass evacuations. Because flooding can be predicted, however, the government of Indonesia has minimized the impact of floods, by taking preventive actions such as river and reservoir normalization, reforestation, and spatial planning.
Table 1. Number of human victims of natural disasters in Indonesia 1969–2015
shows the recorded economic damages caused by natural disasters. Flooding and droughts destroyed nearly 90 percent of total crops in Indonesia during the period 1990–2015. Households in rural areas and/or those working in the agricultural sector were the most vulnerable to disasters during that period. Community initiatives such as food buffers (lumbung desa in Bahasa Indonesia) can protect rural agriculture-based households from the hardships that come from flooding and droughts. Road and bridge damage can also have a significant impact on both the general economy and on household welfare. Flooding causes the most road damage, whereas earthquakes cause the most bridge damage. Such damage to the transportation network affects households’ accessibility to economic activities and disrupts the flow of goods and services as well as the delivery of disaster relief. Emergency responses involving the reconstruction of bridges and roads can also help to mitigate the adverse impacts of natural disasters on households.
Table 2. Economic damages caused by natural disasters in Indonesia 1990–2015
Various studies have demonstrated that negative shocks such as death and missing family members can quickly impoverish non-poor households (Corbett, Citation1989; Sevak et al., Citation2003). In addition, deaths preceded by prolonged or severe sickness often impose strains on the household economy. These households are sometimes forced to sell land for medical treatment, which might impoverish the household (Dartanto & Nurkholis, Citation2010). In contrast, the number of injured, evacuated, and otherwise affected households as a result of disasters is not significantly correlated with the provincial poverty rate. Suffering minor injury or being evacuated from one’s home are temporary conditions and thus do not cause poverty. Based on this correlation, the impact of natural disasters on household welfare and poverty appears to depend on the level of damage and loss that has occurred.
3.2. Disaster, damage and loses at village and household level
While the BNPB dataset is generally used to analyse the national-level relationship between natural disasters and household welfare/poverty, this study uses the 2007 version of the Indonesian Family Life Survey (henceforth “IFLS4”) to analyse natural disasters, damage, and loss at the village and household levels.Footnote2 The IFLS is a longitudinal survey of thirteen major provinces whose residents account for approximately 83 percent of the country’s population (Strauss et al., Citation2004).Footnote3 The IFLS survey collects data on individual respondents and their households as well as community facilities and activities. IFLS4 interviewed 13,535 households, consisting of 6,596 original IFLS1 households, 3,366 older “split-off” households, and 3,573 newer split-off households (J. Strauss et al., Citation2009; Thomas et al., Citation2012). Compared to IFLS1, 2, and 3, IFLS4 recorded the impacts of natural disasters on households and villages (313 villages) comprehensively and in detail, including, damage and loss, disaster mitigation, and preparedness at the village level.
At the village level, the survey reported that 28.12 percent of villages had experienced floods and fires. The proportion of villages that had experienced earthquakes and landslides was 18.85 percent and 9.58 percent, respectively; drought, a source of disaster particularly for farmers, affected 8.63 percent of villages. Combined, disasters damaged village infrastructure and facilities such as housing (42.11 percent), roads (33.33 percent), schools (16.37 percent), places of worship (13.45 percent), business centres (8.19 percent), and health facilities (7.6 percent; see, ). Damage to roads and bridges disrupted villages’ connectivity, which then impeded the flow of goods and services as well as aid to the afflicted villages. Damages to business centres generally hamper the disaster-recovery process due to the slowing of economic activities. The collapse of schools from disasters exacerbates psychological trauma for children due to the loss of a place to play, learn, and socialize, while damage to health facilities increases the number of casualties due to the lack of places to stage emergency responses and administer first aid.
Table 3. Damage facilities at village level caused by natural disaster
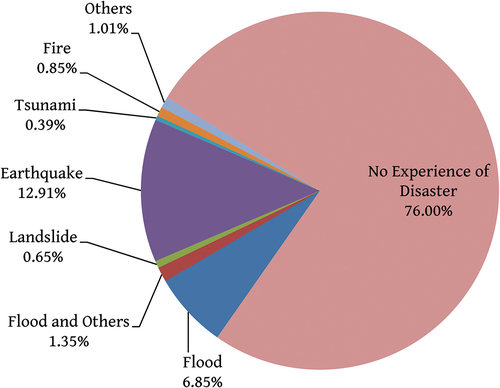
shows the composition of households that have been affected by disasters. At the individual household level, only 24 percent of households had experienced a disaster: 12.9 percent had experienced earthquakes, whereas 6.85 percent had experienced flooding. Not all households that experienced disasters suffered severe impacts; IFLS4 shows only 26 percent of households that experienced disasters were severely affected. A household that has experienced disaster but not been severely impacted by it may not necessarily see their welfare level decline.
According to the IFLS, 4,331 households reported that natural disasters had damaged the value of their business assets by 1.73 million Indonesian rupiah (IDR; approximately USD 173) on average, whereas 777 households reported that natural disasters had damaged the value of their non-business assets by IDR 10.4 million (USD 1,040) on average. Among 821 households, the out-of-pocket medical costs and/or funeral costs caused by natural disasters was on average IDR 11 million (USD 1,100). The asset losses and out-of-pocket costs were around IDR 21.9 million (around USD 2,190).Footnote4 Losing assets and money due to medical and funeral costs may result in a lowering of household welfare. Non-poor households may become impoverished following a large loss from a disaster as well as the medical costs subsequently incurred. Other households might be forced to sell their assets (such as land and livestock) during the recovery process or for medical treatment. The loss of productive assets can easily lead to poverty for such households.
Figure 1. Household experiences of disaster (N = 12,987).Source: Author’s calculation based on IFLS4
shows a cross-tabulation between households that have experienced disaster and their household poverty status in 2007. The table does not completely portray whether disasters can impoverish household because the proportion of poor households and non-poor households that have experienced natural disasters are quite similar. The exception is only to be found in the case of earthquakes, where there is a 3 percent difference between the proportion of poor and non-poor households that have experienced disasters. Two factors could explain the seemingly vague correlation between disaster experience and poverty status in 2007. First, only one-quarter of households that had experienced disaster were severely affected; second, one-third of those severely affected households were better off since the disaster, because their disaster compensation was higher than the original costs stemming from the disaster.
Table 4. Cross-tabulation between disaster experience and poverty status in 2007
3.3. Disaster preparedness
Although natural hazards cannot be eliminated, improving disaster preparedness and responses can reduce human casualties and the adverse effects of natural disasters. Village preparedness for disasters essentially includes trainings and briefings; trainings may be in hazard-mitigation practices, such as organizing food storage, volunteering, and shelters, whereas briefings provide instructions for early responses to natural hazards. As a country that is susceptible to disaster, hazard-mitigation preparedness in Indonesia should be prioritized to reduce the physical and social impacts of disaster. However, only 36 percent of the surveyed villages (113 of 313 villages) had conducted both trainings and briefings, whereas 61 villages had conducted briefings without trainings and 12 villages had conducted trainings without briefings. Around 18 percent (23 out of 125) of villages that had conducted a training had allocated IDR 84.1 million (USD 8,400) on average for disaster preparedness.
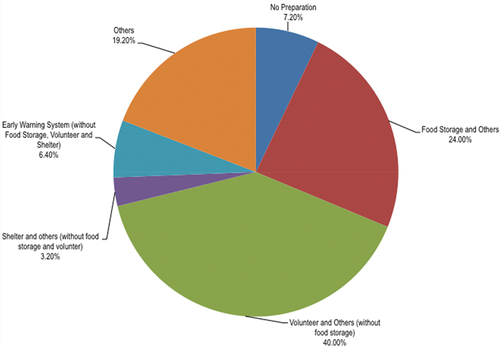
illustrates the different types of disaster preparedness. As shown in the figure, food storage and volunteering are two well-known activities for hazard-mitigation preparedness. Based on these figures, although natural hazards frequently occur in Indonesia, the nation’s communities are not well prepared to respond to these hazards. The lack of hazard-mitigation preparedness will effectively increase the adverse impacts of disasters on Indonesian society.
Figure 2. Types of village preparedness for natural disasters (N = 125).Source: Author’s calculation based on IFLS4
4. Research methodology
This study proposes three econometric models to examine whether natural disasters and mitigations can affect households’ consumption and poverty status.Footnote5 We consider the estimation of three econometric models to confirm the consistency and robustness of the estimation results vis-à-vis natural disasters’ ability to reduce household welfare or change households’ poverty status.
The first econometric model examines the relationship between households’ natural-disaster experience during the last five years (2002–2007) and per-capita household consumption in 2007; the negative coefficient of disasters indicates a household’s reduced welfare. The second econometric model examines whether households’ natural-disaster experience during the last five years (2002–2007) influences household poverty status in 2007. In this model, a household’s decreased per-capita consumption does not necessarily imply a household’s changed poverty status: if household per-capita consumption decreases but the decrease does not place the household below the poverty line, then the household’s poverty status is not considered to have changed. Though the two models are estimated using cross-sectional data from IFLS4, a significant relationship between the occurrence of a disaster and low consumption still means that the disaster caused the household to fall into poverty. This is because the IFLS-recorded disasters occurred within the five years before the survey was conducted, which means that these disasters occurred during the period 2002–2007.
The third econometric model examines the impact of natural disasters on households’ changing poverty status between 2000 and 2007 by using IFLS3 & IFLS4. If a household’s poverty status changed from “non-poor” in 2000 to “poor” in 2007, then this would imply that a disaster had strongly affected household welfare. This study applies the expenditure-based poverty calculation, the official poverty line of 2000 and 2007, and the poverty measures of the “FGT” formula, named for the formula’s authors (Foster et al., Citation1984).Footnote6 This study only analyses the “P0” (the head-count index) of the FGT poverty measurement.
The exploratory variables in this study are divided into two main groups: household-level exploratory variables and village-level exploratory variables. The exploratory variables included in the model consider the data available from IFLS3 and IFLS4 as well as variables used in previous studies (Dartanto et al., Citationforthcoming, Citation2020; Dartanto & Nurkholis, Citation2013; Noy, Citation2009; Silbert et al., Citation2011; Van den Berg, Citation2010; Wong & Brown, Citation2011). The present study initially intended to also include coping strategies activated in response to natural disasters, although this proved to be impossible due to the unavailability of data from IFLS 4. The econometric models are shown below.
where:
= per-capita consumption expenditure in 2007;
i = household-i, i = 1, …, n.
Model 1 is a linear model that is estimated using the ordinary least square (OLS) method, while models 2 and 3 are limited-dependent variable-of-logit (ordered logit) models that are estimated using maximum likelihoods. Each model is estimated twice: first using only household-level explanatory variables and second using both household-level and village-level explanatory variables. The double estimations are intended to check the consistency and robustness of the regression coefficient estimates when the regression specification is modified by adding explanatory variables.
5. The impact of natural disasters on household welfare
5.1. Disasters and household consumptions
OLS estimations of both model 1a and 1b confirm that only earthquakes consistently and significantly influenced per-capita consumption in 2007. Households that had experienced an earthquake during the period 2002–2007 tended to have lower per-capita consumption compared to households that had not experienced an earthquake. Households with disaster experience might have lost some of their productive assets, experienced housing damage, or may even have lost family members. Each of these losses will cause a household’s welfare to decrease, as indicated by reduced per-capita consumption. Because the coefficient magnitudes of other disasters were found to be significant in model 1a but not in model 1b, we can say that this variable was not robust in terms of influence on per-capita consumption in 2007. The coefficient estimates of flooding are counterintuitive since the coefficients in both models 1a and 1b were shown to be positive, which means that households that have experienced flooding tend to have increased per-capita consumption. Floods—mostly temporarily flooding—occur frequently every year in Indonesia and may not destroy many household properties; floods, therefore, may not have a significant effect on household consumption.Footnote8
According to model 1b (shown in ), drought and forest fires can significantly reduce per-capita consumption. Drought leads to crop failure since droughts mean that there is not enough water for crops to grow; crop failure can occasionally lead to famine in some rural areas. Drought may also force some households to seek out additional water sources that are located at some distance from their residences to meet household daily needs. These households are thus forced to spend more time collecting water, which in turn reduces the time they can spend on income-earning activities. Reduced working hours can shrink both household income and household consumption.
Table 5. The impact of disaster on household consumption and poverty in 2007
Similarly, to drought, forest fires also significantly reduce per-capita consumption. Households in those villages that have experienced forest fires tend to have lower per-capita consumption. Forest fires spread smoke pollutants that can disrupt and hinder social activities, notably outdoor activities, since the smoke is often dangerous to breathe. Smoke can also cancel or delay flights due to low visibility and may disrupt educational and working activities due to the unhealthy conditions smoke creates. If this condition persists for a week or more, then economic activities may slow, eventually reducing both household income and consumption.
In terms of damage from disasters, not all the coefficient estimates of model 1b were as expected. Damage to business centres and other facilities was found to be negatively related to household per-capita consumption. Damage to business centres (such as the market in a village) interrupts a village’s economic activities due to the inability of farmers and small-medium enterprises (SMEs) to sell their products; this condition will also decrease households’ sources of income. Disruptions to the transportation network (from damage to roads and bridges) does not appear to disrupt household consumption: in theory, this disruption should decrease both household income and consumption, since the transportation network is a necessary condition for the movement of goods and services. One possible reason for this counterintuitive finding is that roads and bridges from disasters during the period 2002–2007 had been repaired or rebuilt by the time of the survey and therefore did not lead to a decrease household consumption in 2007.
(model 1b) confirms that disaster-preparedness practices provide protection to households when disasters occur. Households in those villages that have undertaken disaster-preparedness practices tend to have higher per-capita consumption. Such practices can minimize the adverse impacts of disaster in such a way that households will still be able to maintain their welfare after a disaster has occurred. Model 1b also confirms that disaster preparedness in terms of shelter and food storage can ensure that households will preserve their levels of per-capita consumption after a disaster has struck. This finding is similar to that of Fothergill and Peek (Citation2004) who found that improving disaster preparedness could significantly reduce the adverse impacts of disasters.
The estimated coefficients of other control variables (such as socio-demographic variables and village infrastructure variables) were as expected. For instance, households with more members tended to have lower per-capita consumption, while households with higher educational attainment tended to have higher per-capita consumption. This is because higher educational attainment is related to increased chances of earning a higher salary or income. The availability of village infrastructure (such as formal credit institutions and medical facilities) also positively correlates with per-capita consumption. Formal credit institutions may help households to smooth their consumption by providing credit when necessary.
5.2. Disasters and household poverty status in 2007
The previous section analysed whether disasters reduce household consumption; this section focuses on whether a disaster could determine a household’s poverty status in 2007. Compared to per-capita consumption, household poverty status is a stronger indicator of household welfare. Households that have experienced a decrease in per-capita consumption do not necessarily fall into a state of poverty; if per-capita consumption does not fall below the poverty line, then the household will still be categorized as “non-poor.”
Similar to the finding from model 1, earthquakes are one type of disaster that consistently and significantly influence household poverty status. Households that have experienced an earthquake have a higher probability of being poor. The probability of being poor increased by 1.9 percentage points for earthquake-affected households during the period 2002–2007. Earthquakes may cause damage to physical assets as well as sickness and even death of family members; both force households to spend a great deal of resources on the recovery process and medical treatment. These conditions might influence a household’s 2007 poverty status. Other disasters, the costs of damage, and the ratio between the costs of damage and assistance did not significantly influence household poverty status in 2007.
Model 2b confirms that forest fires significantly determined household poverty status in 2007. Households in villages that were affected by forest fires tended to have a higher probability of being poor (by approximately 3 percentage points). This finding is consistent with the same finding from model 1b, which showed that forest fires reduced per-capita consumption and thus could impoverish households. In the case of droughts, although they did not significantly determine poverty status in 2007, this type of disaster should be looked at more carefully, since households in villages that had experienced drought tended to be poor in 2007. Although damage to both business centres and other facilities were not statistically significant, they did increase the probability of being poor.
Model 2b confirms that disaster-preparation activities may effectively protect households from falling into poverty. Households in villages that had experienced a disaster and had disaster-preparation practices in place tended to be non-poor at the time that the disaster occurred. Disaster-preparation practices such briefings, spreading information about disasters, and implementing early-response systems all encourage households to prepare disaster-mitigation practices; one such example is by constructing earthquake-resistant buildings. Implementing such practices may lead to a decrease in the probability of widespread destruction of buildings and severe injuries, thus reducing recovery costs. The types of preparation activities, however—such as the building shelters, the provision of adequate food storage, and the use of early-warning systems—did not significantly determine household-poverty status in 2007.
Model 2a and 2b confirm that socio-demographic variables such as the size of a household, educational attainment of the household head, the age of the household head, and the ownership of livestock were important factors in determining household-poverty status in 2007. Households with more members tended to be poor, whereas households with higher educational attainment tended to be non-poor. The probability of a household being poor was also increased by having more members given a fixed income, an increase in the number of members forces households to reduce their per-capita consumption levels to support the additional member(s). Having a better education raises the probability of a household being non-poor because a higher education level provides more opportunities to find better jobs with a higher income. The ownership of livestock is also positively correlated with a household’s non-poor status in 2007, since the ownership of livestock is a common coping strategy during shocks such as disasters. When households experience shock, they can easily convert their livestock to cash, thus smoothing their consumption.
Model 2b also verifies that access to formal credit institutions is an important factor in helping households maintain their consumption levels and avoid becoming impoverished when shocks such as disasters occur. The probability of being non-poor for households in villages with formal credit institutions increased by around 0.3 percentage points in 2007.
5.3. Disasters and poverty dynamics from 2000 to 2007
Models 1 and 2 were used to check whether disasters affected household welfare in terms of per-capita consumption and poverty status in 2007. Model 3 further analysed whether disasters that households have experienced during the period 2002–2007 can change a household’s poverty status from “non-poor” in 2000 to “poor” in 2007. This study would have difficulty concluding that disasters could reduce household welfare if we used only the results from models 1 and 2, because both models are based on estimations of cross-sectional data.Footnote9
The results of model 3 (), however, can provide stronger evidence of the impact of disasters on household welfare. This is because model 3 allows us to capture whether the change in household poverty status during the period 2000–2007 was influenced by households’ experience with the disasters that had occurred during the period 2002–2007. Model 3 also adds new exploratory variables to ensure the robustness of its estimations. These new exploratory variables include change in marital status, change in household size, change in educational attainment, shock from the death of a family member, and shock of becoming unemployed. Many previous studies—such as those of (Dartanto et al., Citation2020; Dartanto & Nurkholis, Citation2013)—confirm that changes in socioeconomic status and shocks are highly correlated with poverty dynamics (i.e., changes in poverty status).
Table 6. Marginal effects of the impact of disaster on changing poverty status during 2000–2007 (ordered logit model (model 3))
Our estimations provide strong evidence that earthquakes and other disasters significantly affect household-poverty status as shown by the negative coefficient (see, ). Households that have been affected by earthquakes and other disasters tend to be among the “chronic poor” (i.e., they remain poor over the course of two periods) and “transient poor (-)” (i.e., they change from being non-poor to poor). In addition, for households that experienced an earthquake during the period 2002–2007, the probability of remaining poor during the two following periods (i.e., being among the “chronic poor”) increased by 0.5 percentage points, while the probability of becoming impoverished (i.e., moving into “transient poverty [-]”) increased by 3.7 percentage points.
These figures imply that earthquakes can easily impoverish formerly non-poor households and can hinder households from escaping poverty. Earthquakes as well as other disasters may result in casualties (i.e., deaths and severe injuries) among the general population and damage to certain physical assets. This will in turn create a significant financial burden on households that need to pay for medical treatment and the recovery process. Therefore, non-poor households typically become poorer, while only some of them may become poor after earthquakes have struck. Furthermore, although the estimated coefficients of other negative shocks (such as the death of a family member or unemployment) are expected to increase the probability of households joining the chronic poor, these factors do not appear to be statistically significant. Finally, the average cost of disaster damage is not a significant factor in determining household-poverty status.
Similar to earthquakes, droughts and forest fires are the most important factors to potentially change household-poverty status. Households in areas that have been affected by droughts and forest fires tend to be among the chronic poor and transient poor (-) categories. Similar to the explanation for models 1 and 2, droughts and forest fires disrupt economic activities and lower a household’s income which can, in turn, easily plunge a household into poverty. Droughts and forest fires increase the probability of joining the chronic poor by 1 percentage point and 0.8 percentage points, respectively, whereas each disaster also increases the probability of joining the transient poor (-) group by 0.7 percentage points and 0.6 percentage points, respectively.
The destruction of business centres significantly changes a household’s poverty status, since it will reduce economic transactions; this, in turn, means less income for affected households, which can lead to impoverishment. The ordered logit estimations as in also support the findings of models 1b and 2b, which found that road network damage does not decrease household welfare. The reason for this is similar to the explanation for model 1b: the immediate reconstruction of previously damaged roads and bridges prevented adverse impacts that might otherwise have affected household welfare in 2007. The consistent results from models 1b, 2b, and 3 also indicate that disasters may speed the Schumpeterian creative-destruction process through the replacement of old infrastructure.
Disaster-preparation practices can prevent households from becoming impoverished; this is evident in the finding that households in villages that have disaster-preparation practices in place tend to be non-poor. The probability of being non-poor for these households increased by around 2.6 percentage points during the period under consideration. Disaster-preparation practices might reduce the probability of widespread destruction and/or casualties and thus will help to keep households from becoming impoverished. The types of preparation practices, however—such as the building of shelters, the provision of adequate food storage, and the use of early-warning systems—did not significantly determine changes in poverty status during the period 2000–2007. Although not statistically significant, the use of shelters and early-warning systems are two types of disaster-preparation practices that appear to be effective in preventing households from becoming impoverished.
The control variables of the socio-demographic variables we have examined (such as marital status, change in marital status, household size, change in household size, educational attainment, change in educational attainment, and age of household head) were found to be important factors in determining changes in poverty status. These results also support the findings of Dartanto and Nurkholis (Citation2013). Change in the demographic variable of marital status due to divorce often results in the loss of productive family members (either the wife or the husband). This change could reduce the household’s economic capacity. In addition, an increase of one family member was found to be associated with becoming impoverished or falling into hardship condition, since existing resources must be redistributed to support an additional member. Changes in the educational attainment of the household head was found to be positively correlated to the probability of being in the “never poor” category. The inclusion of a household head who has attained more education increased the probability of being in the “never poor” group by 7.1 percentage points. Parallel to the findings of models 1b and 2b, model 3 also confirms that access to formal credit institutions is an important factor in household welfare. Formal credit institutions provide an alternative so that households may smooth their consumption with lower interest rates.
6. Conclusion
Indonesia has become vulnerable due to recent increases in the intensity and scope of disasters that have resulted in more victims than was the case during earlier periods. Nearly forty times as many people were affected by disaster during the period 2000-2015 compared to the period 1985-1999. After observing the national data and the household data from IFLS, this study found that households in rural areas and/or those that work in the agricultural sector are the most vulnerable or the most exposed to disaster, particularly drought and floods. At the household level, even though asset loss and out-of-pocket costs from natural disasters average around IDR 21.9 million (USD 2,190) per household, not all disasters lead to adverse impacts on society. Only one-quarter of those households that have experienced a disaster were severely affected by them.
Our three econometric models confirm that earthquakes are the most destructive disaster affecting household welfare. Earthquakes can cause formerly non-poor households to become poor due to asset loss, damage costs, and casualties. Droughts and forest fires also significantly affect household welfare, particularly agricultural households, both of which are vulnerable to forest fires. In contrast, flooding and other disasters have a lesser effect on household welfare.
The government should also pay more attention to rebuilding damaged business centres (such as markets) to hasten the recovery process, since this study has shown that damage to business centres negatively affects household welfare and poverty status. Moreover, households in those villages that have experienced damage to the road and bridge network due to disasters often become better off, in the sense that their welfare (i.e., consumption) increases and their poverty status improves. One possible reason for this is that damaged roads and bridges are often rebuilt immediately after a disaster has struck and are replaced by upgraded infrastructure.
Similarly, to other studies, this study has found that the implementation of disaster-mitigation preparations such as trainings and briefings could reduce the impacts of disasters as well as households’ vulnerability to becoming impoverished once disaster has struck. The government of Indonesia should actively encourage and support villages or other communities to engage in disaster-preparation practices such as distributing information about disasters, implementing early-response systems, and preparing shelters to reduce the probability of massive destruction and/or casualties. One important policy recommendation to protect households from negative shocks is to expand household access to formal credit institutions; they can help households in smoothing their consumption when shocks occur by providing credit at lower interest rates.
This study, however, has various limitations, especially in terms of coverage of study, data, and methodology. Further investigation into the impact of natural disasters on household welfare are very important and timely, especially in the time of COVID-19. The main areas for future research are four-fold. The first of these is the bidirectional relationship between natural disasters and household welfare: Natural disasters affect household welfare. At the same time, the poor are most likely to live in disaster prone areas and least likely to have disaster insurance. A second area for further research is the possibility of providing disaster insurance for protecting household welfare, which is an urgent policy issue. Third, the use of longer panel data is possible because IFLS wave 5 is currently available. Finally, the use of a quasi-experimental methodology such as difference in difference regression (DID) could improve the results and ensure causal inference of the relationship between natural disasters and household welfare.
Acknowledgements
The author would like to thank the Economic Institute for ASEAN and East Asia (ERIA) for the generous financial support in conducting this research, HIBAH PITMA A 2019 for the partial financial support for rewriting and converting the research report into a manuscript, and Theresia Kinanti Dewi and Edith Zheng Wen Yuan for their research assistance.
Disclosure statement
No potential conflict of interest was reported by the author(s).
Additional information
Funding
Notes on contributors

Teguh Dartanto
Teguh Dartanto is a Dean, Faculty of Economics and Business, Universitas Indonesia. He was formerly Vice Dean and a Head of the Department of Economics at Universitas Indonesia. Teguh Dartanto is also a Head of Cluster Research on Poverty, Social Protection and Human Development in the same department. His expertise lies in poverty analysis, social protection, development economics, and health economics. His research has been published in numerous journals, including The Lancet, Applied Health Economics and Health Policy, Economic Modelling, Tobacco Control, World Development Perspectives, International Journal of Environmental Research & Public Health, Vulnerable Children and Youth Studies, Bulletin of Indonesian Economic Studies, Energy Policy and Singapore Economic Review. He is actively engaged in research collaboration with domestic and international counterparts such as JPAL Southeast Asia, ANU, ADB, UNDP, JICA, and OECD. Prior to that, he received a Monbukagakusho Scholarship to pursue his Master of Economics degree at Hitotsubashi University and then his Ph.D. in International Development at Nagoya University.
Notes
1. The adverse impacts of disasters on an economy or a society may be categorized into two definitions: damages to stock (including physical and human capital) and loss of flows due to business interruptions, such as production and/or consumption losses.
2. One potential dataset for exploring the issue of natural disasters is the Village Potential database (PODES), which records natural disasters that occur throughout all villages in Indonesia; however, this dataset does not record the socioeconomic impacts of disasters at the household level.
3. The thirteen provinces are North, West, and South Sumatera; West, Central, and East Java; DKI Jakarta; DI Yogjakarta; Bali; West Nusa Tenggara; South Kalimantan; and South Sulawesi.
4. The exchange rate in 2006–2007 was around US$ 1 = IDR 10,200.
5. Even though, there is a possibility of two-way relationship between disasters and poverty as mentioned in the literature review, this study only focuses on examining the relationship between natural disasters and poverty due to several data limitation.
6. The FGT classification of poverty follows this equation:
where P is the poverty index, n is the total population size, z is the poverty line, is the income of the
individual (or household), q represents the number of individuals just below or at the poverty line, and
is a parameter for the FGT class. The average national poverty line is IDR 103,904 (2000) and IDR 166,642 (2007). The present study, however, applies the provincial poverty line, which varies among provinces as well as between rural and urban areas.
7. The category of “chronic poor” refers to those households that remained in the “poor” category during two periods of analysis (2000 and 2007). The “transient poor (-)” category means that households were non-poor in 2000 but had become poor by 2007, while “transient poor (+)” refers to households that were categorized as poor in 2000 but had become non-poor by 2007. The “never poor” category is assigned to those households that were always non-poor during both periods of the survey.
8. Around 30 percent of households received disaster compensation that was more substantial than the costs of the original damage.
9. The cross-sectional data could result in non-robust estimations due to the endogeneity problem as well as coincident outcomes because explanatory variables of disasters represent experiences (i.e., conditions during the period 2002–2007), whereas per-capita consumption and poverty status represent a recent status.
References
- Arouri, M., Nguyen, C., & Youssef, A. B. (2015). Natural disasters, household welfare, and resilience: Evidence from rural vietnam. World Development, 701, 59–31. https://doi.org/10.1016/j.worlddev.2014.12.017
- Chang, S. E. (2010). Urban disaster recovery: A measurement framework and its application to the 1995 Kobe earthquake. Disasters, 34(2), 303–327. https://doi.org/10.1111/j.1467-7717.2009.01130.x
- Corbett, J. (1989). Poverty and sickness: The high costs of III-Health. IDS Bulletin, 20(2), 58–62. https://doi.org/10.1111/j.1759-5436.1989.mp20002008.x
- Dartanto, T., Bastiyan, D. F., & Sofiyandi, Y. (2017). Are local governments in Indonesia really aware of disaster risks? In AIP Conference Proceedings (Vol. 1857, p. 110006). Bandung Institute of Technology, Bandung, Indonesia, AIP Publishing LLC. https://doi.org/10.1063/1.4987125
- Dartanto, T., Can, C. K., Moeis, F. R., & Rezki, J. F. (forthcoming). A dream of offspring: Two decades of intergenerational economic mobility in Indonesia. Bulletin of Indonesian Economic Studies, 1–50. https://doi.org/10.1080/00074918.2021.1970109
- Dartanto, T., Moeis, F. R., & Otsubo, S. (2020). Intragenerational economic mobility in Indonesia: A transition from poverty to middle class during 1993-2014. Bulletin of Indonesian Economic Studies, 56(2), 193–224. https://doi.org/10.1080/00074918.2019.1657795
- Dartanto, T., & Nurkholis. (2010). Income shocks and consumption smoothing strategies: An empirical investigation of maize farmer’s behavior in Kebumen, Central Java, Indonesia. Modern Economy, 1(3), 149. https://doi.org/10.4236/me.2010.13017
- Dartanto, T., & Nurkholis. (2013). The determinants of poverty dynamics in Indonesia: Evidence from panel data. Bulletin of Indonesian Economic Studies, 49(1), 61–84. https://doi.org/10.1080/00074918.2013.772939
- Dercon, S. (2008). Fate and Fear: Risk and its consequences in Africa. Journal of African Economies, 17(2), ii97–ii127. https://doi.org/10.1093/jae/ejn019
- Dewi, L. P. R. K., & Dartanto, T. (2019). Natural disasters and girls vulnerability: Is child marriage a coping strategy of economic shocks in Indonesia? Vulnerable Children and Youth Studies, 14(1), 24–35. https://doi.org/10.1080/17450128.2018.1546025
- Foster, J., Greer, J., & Thorbecke, E. (1984). A class of decomposable poverty measures. Econometrica, 52(3), 761. https://doi.org/10.2307/1913475
- Fothergill, A., & Peek, L. A. (2004). Poverty and disasters in the United States: A review of recent sociological findings. Natural Hazards, 32(1), 89–110. https://doi.org/10.1023/B:NHAZ.0000026792.76181.d9
- Francisco, H. A., Predo, C. D., Manasboonphempool, A., Tran, P., Jarungrattanapong, R., The, B. D., & Zhu, Z. (2011). Determinants Of Household Decisions On Adaptation To Extreme Climate Events in Southeast Asia. Research Report No. 2011-RR5. Singapore: Economy and Environment Program for Southeast Asia (EEPSEA), International Development Research Centre . https://econpapers.repec.org/paper/eepreport/rr2011074.htm
- Hallegatte, S., & Dumas, P. (2009). Can natural disasters have positive consequences? Investigating the role of embodied technical change. Ecological Economics, 68 (3), 777–786. https://ideas.repec.org/a/eee/ecolec/v68y2009i3p777-786.html
- Hallegatte, S., Hourcade, J.-C., & Dumas, P. (2007). Why economic dynamics matter in assessing climate change damages: Illustration on extreme events. Ecological Economics, 62 (2), 330–340. https://ideas.repec.org/a/eee/ecolec/v62y2007i2p330-340.html
- Kunreuther, H., & Michel-Kerjan, E. (2013). Natural Disasters in Lomborg, Bjorn). Global Problems Smart Solutions: Costs and Benefits.Cambridge: Cambridge University Press. https://doi.org/10.1017/CBO9781139600484010
- Kurosaki, T., Khan, H., Shah, M. K., & Tahir, M. (2012). Household-level recovery after floods in a developing Country: Further evidence from khyber pakhtunkhwa, Pakistan. PRIMCED Discussion Paper Series 27, Institute of Economic Research, Hitotsubashi University. https://ideas.repec.org/p/hit/primdp/27.html
- Lal, P. N., Singh, R., & Holland, P. (2009). Relationship between natural disasters and poverty: A Fiji case study. SOPAC Miscellaneous Report 678.International Strategy for Disaster Reduction . https://www.iucn.org/sites/dev/files/import/downloads/poverty_a_fiji_case_study_final020509.pdf
- Lindell, M. K., & Perry, R. W. (2000). Household adjustment to earthquake hazard. Environment and Behavior, 32(4), 461–501. https://doi.org/10.1177/00139160021972621
- Lindell, M. K., & Prater, C. S. (2003). Assessing community impacts of natural disasters. Natural Hazards Review, 4(4), 176–185. https://doi.org/10.1061/(ASCE)1527-6988(2003)4:4(176)
- Lopez-Calva, L. F., & Ortiz-Juarez, E. (2009). Evidence and policy lessons on the links between disaster risk and poverty in Latin America. MPRA Paper 18342. University Library of Munich, Germany. https://ideas.repec.org/p/pra/mprapa/18342.html
- Morris, S. S., & Wodon, Q. (2003). The allocation of natural disaster relief funds: Hurricane mitch in honduras. World Development, 31(7), 1279–1289. https://doi.org/10.1016/S0305-750X(03)00072-X
- Noy, I. (2009). The macroeconomic consequences of disasters. Journal of Development Economics, 88(2), 221–231. https://doi.org/10.1016/j.jdeveco.2008.02.005
- Resosudarmo, B. P., Sugiyanto, C., & Kuncoro, A. (2012). Livelihood recovery after natural disasters and the role of aid: The case of the 2006 yogyakarta earthquake. Asian Economic Journal, 26(3), 233–259. https://doi.org/10.1111/j.1467-8381.2012.02084.x
- Rodrigues-Oreggia, E., Fuente, A., Torre, R., Moreno, H. A. (2013). The impact of natural disasters on human development and poverty at the municipal level in mexico. The Journal of Development Studies 49(3), 442–455 https://doi.org/10.1080/00220388.2012.700398 .
- Sawada, Y. (2007). The impact of natural and manmade disasters on household welfare. Agricultural Economics, 37(S1), 59–73. https://doi.org/10.1111/j.1574-0862.2007.00235.x
- Sevak, P., Weir, D. R., & Willis, R. J. (2003). The economic consequences of a husband’s death: Evidence from the HRS and AHEAD. Social Security Bulletin, 65, 31–44. https://pdfs.semanticscholar.org/f49a/5624b8f3f441e199abf7bdf7534aace8044d.pdf?_ga=2.194622509.1831053723.1587006620-1499255353.1560670152.
- Silbert, M., Del, M., & Useche, P. (2011). Repeated natural disasters and poverty in island nations: A decade of evidence from Indonesia. https://bear.warrington.ufl.edu/centers/purc/docs/papers/1202_Silbert_Repeated_Natural_Disasters.pdf
- Skidmore, M., & Toya, H. (2002). DO NATURAL DISASTERS PROMOTE LONG-RUN GROWTH? Economic Inquiry, 40(4), 664–687. https://doi.org/10.1093/ei/40.4.664
- Strauss, J., Beegle, K., Sikoki, B., Dwiyanto, A., Herwati, Y., Witoelar, F., & Corporation, R. (2004). The third wave of the indonesia family life survey (IFLS3): Overview and field report. March 2004. WR-144/1-NIA/NICHD.
- Strauss, J., Witoelar, F., Sikoki, B., & Wattie, A. M. (2009). The Fourth Wave of the Indonesian Family Life Survey (IFLS4): Overview and Field Report. https://www.rand.org/well-being/social-and-behavioral-policy/data/FLS/IFLS/ifls4.html
- Takasaki, Y. (2011). Targeting cyclone relief within the village: Kinship, sharing, and capture. Economic Development and Cultural Change, 59(2), 387–416. https://doi.org/10.1086/657126
- Thomas, D., Witoelar, F., Frankenberg, E., Sikoki, B., Strauss, J., Sumantri, C., & Suriastini, W. (2012). Cutting the costs of attrition: Results from the Indonesia family life survey. Journal of Development Economics, 98(1), 108–123. https://doi.org/10.1016/j.jdeveco.2010.08.015
- Van den Berg, M. (2010). Household income strategies and natural disasters: Dynamic livelihoods in rural Nicaragua. Ecological Economics, 69(3), 592–602. https://doi.org/10.1016/j.ecolecon.2009.09.006
- Winsemius, H. C., Jongman, B., Veldkamp, T. I. E., Hallegatte, S., Bangalore, M., & Ward, P. J. (2015). Disaster risk, climate change, and poverty: Assessing the global exposure of poor people to floods and droughts. Policy Research Working Paper November 2012. Washington D.C:The World Bank. https://doi.org/10.1596/1813-9450-7480
- Wong, P. Y., & Brown, P. H. (2011). disasters and vulnerability: Evidence from the 1997 forest fires in Indonesia. The B.E. Journal of Economic Analysis & Policy, 11(1). https://doi.org/10.2202/1935-1682.2658
- Xiao, Y. (2011). Local sasters. Journal of Regional Science, 51(4), 804–820. https://doi.org/10.1111/j.1467-9787.2011.00717.x