
 ?Mathematical formulae have been encoded as MathML and are displayed in this HTML version using MathJax in order to improve their display. Uncheck the box to turn MathJax off. This feature requires Javascript. Click on a formula to zoom.
Abstract
Small scale irrigation has multi-dimensional effects on the livelihood development of the rural people in Ethiopia. Thus, the main objective of this study was to examine the impact of small-scale irrigation on farmers’ livelihood. A stratified random sampling technique was applied to select 96 users and 162 non-user sample respondents. The collected data were analyzed using descriptive statistics and an econometric model. Binary logit and Endogenous switching regressions model were employed to identify the determinant of small-scale irrigation participation and its impact on farmers’ livelihood respectively. The Binary logit model result indicates that age and age square of the household, own cultivated land, off-farm job participation, extension contact, distance from homestead to a nearly local market, distance from home to the scheme, and having irrigation user neighbor are significant factors affect farmers’ decision to practice irrigation. To capture the impact of irrigation on farmers’ livelihood, the total income of the household was used in the endogenous switching regression model. The model result shows that the positive and significant impact of irrigation schemes had increased users’ total income by 7829 ETB (8.5%), as compared to non-users. This shows how significant the role of a small-scale irrigation scheme in improving the livelihood condition of farmers in the study area. The finding of this study shows that improving access to market and water for irrigation, provision of extension, and other complementary services would increase the participation of irrigation and improve livelihood.
PUBLIC INTEREST STATEMENT
Ethiopia has many international rivers, high groundwater potential, natural lakes suitable for irrigation, which believes to have 5.1 million hectares of land that can be developed through irrigation but the irrigated area of land is only 10%. Agricultural production in the country predominantly depends on rainfall and drought is becoming frequent many people have been repeatedly exposed to hunger and famine. Irrigation farming regarded as a strategy for agricultural transformation in the developing country for food security, poverty reduction, and livelihood development by transforming subsistence agriculture. The country intensively constructs various irrigation schemes. Thus, expanding irrigation schemes requires, quantifying and examining the real impact of these schemes, identifying socio-economic and institutional problems and putting the possible implications is essential. The study concluded that irrigation farming increased income significantly. It is therefore recommended that small scale irrigation is good strategies to improve agricultural production, asset, income and livelihood.
1. Introduction
Ethiopia is one of the agrarian economies in East Africa with a total area of 1.13 million km2, of which, 1.12 million km2 is covered by land and 0.01 million km2 by water bodies. The country has an arable land area of 10.01% (0.11 million km2) with only 0.65% covered by permanent staple according to (MoWIE, Citation2002). Furthermore, the country has many international rivers, high groundwater potential, natural lakes suitable for irrigation, and believe to have 5.1 million hectares of land that can be developed through irrigation but the irrigated area of land is only about 10% of the total cultivated land (MoWE, Citation2012).
Irrigation farming is under a new emphasis on food security, poverty reduction, and livelihood development by transforming subsistence agriculture. It is considered a basis to stimulate economic growth and rural development by maximizing production and productivity, increased farm income, create employment opportunities, and ensure the livelihood of rural people (Kissawike, Citation2008).
Small scale irrigation serves as one of the strategies to reduce poverty, to stabilize agricultural production and mitigate the negative impacts of erratic rainfall, to ensure household food security, and to improve the livelihood situation of the community. It enables us to meet food self-sufficiency, obtain reasonable income, and accumulate different assets (Bekele, Citation2011). However, irrigation projects have been unsuccessful mainly due to inadequate participation by beneficiaries and unstable land tenure (Mengistie & Kidane, Citation2016).
Agricultural production in Ethiopia predominantly depends on rainfall and drought is becoming frequent many people have been repeatedly exposed to hunger and famine. Additionally, most of the settlement areas are degraded, per capita land availability is diminished and productivity of land and labor are reduced and agricultural production is also affected by the variability of rainfall and drought (Seleshi et al., Citation2007). Small scale irrigation could provide opportunities to cope with the problem of rainfall variability enhance productivity per unit of land, and increase the volume of annual production, earning higher and more stable incomes for livelihood improvement (Smith, Citation2004).
Mekdela woreda has endowed with beautiful diverse natural resources and has a great potential of small-scale irrigation through small dams, underground water, river diversion, surface water harvesting, and other mechanisms. However, irrigation is not a simple silver bullet (Awulachew, Citation2005). It brings positive returns only if it is complemented by other components of the agricultural system. Unfortunately, the country’s agricultural sector is characterized by traditional technologies and poor systems.
There are empirical studies about the impact of small-scale irrigation on household’s livelihood income like Kuwornu and Owusu (Citation2012) in Ghana, Zhou et al. (Citation2009) in China, Gathala et al. (Citation2013) in India, Sikhulumile and W (Citation2014) in South Africa, (Abdissa et al., Citation2017; Gebrehiwot et al., Citation2017; Tesfaye & Beshir, Citation2018; Zeweld et al., Citation2015) in Ethiopia found positive impacts of using small scale irrigation on income. Awulachew et al. (Citation2010) also argues that water resource management in agriculture is a critical contributor to households’ economic and social development of Ethiopia. Other studies failed to show significant positive results Gebremedhin and Peden (Citation2003) indicated that in irrigation has less impact on agricultural yields than expected. Conversely, Lipton et al. (Citation2003) acknowledged the various forms by which the benefits of irrigation can improve the livelihoods of both irrigation user and non-users that include increased production and income, reduced risk, and job creation for rural landless people.
Despite several small scale irrigation impact studies elsewhere, there remains a need for quantitative impact evaluations of Ethiopia’s specific irrigation scheme on their impact on farmer’s income and asset change for livelihood improvement. This is because irrigation schemes are not homogenous between (and even within) countries but are case-specific due to factors such geographic location, natural resource base, technology, plot size, farmer profile, and marketing opportunities. Providing irrigation structure to farm households is not a guarantee to improve livelihood as economic and social problems continue to affect farmers’ livelihood in the study area. Moreover, an enabling socio-economic environment like access to roads, markets, credit, training, and information must be provided to the poor farmers to make them engage in small scale irrigation farming and ensure their livelihood (Norton, Citation2010). Irrigation water use in Ethiopia one of the most important issues affecting agricultural activities in terms of the level of agricultural production income, capability of assuring of food security and sustaining livelihood. Expanding irrigation schemes requires quantifying and examining the real impact of these schemes, identifying socio-economic and institutional problems and putting the possible implications is essential to improve agricultural production, asset, income and livelihood. Such issues instigate for further study.
2. Research methods
2.1. Description of the study area
Mekdela district is one of the rural woreda of Amhara National Regional State. Located in the South Wollo zone, 553 Kilometers North East of Addis Ababa and 152 Kilometers of the West direction of Dessie. It is bordered by woredas of Dawunt & Delanta to the North, Saint to the South, Tenta to the East, and South Gonder to the West. The district comprises 31 Kebele Administrations ().
Figure 1. Location map of the study area.
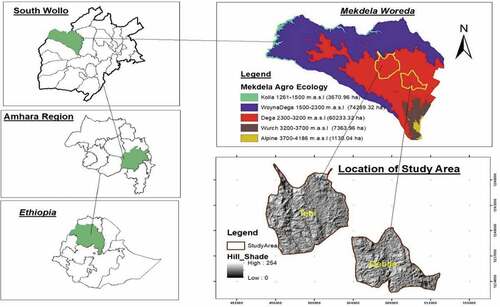
The district is inhabited by 165,754 people, out of which 80,452 (48.5%) are males and 85,302 (51.5%) females (CSA, Citation2013). Only 5% of the population lives in urban areas. The total area of the woreda is 147,384 hectares with diverse landscape features of which 37,189 hectares cultivable out which 8,271 hectares irrigable, 37,294 hectares grazing, 36,995 hectares forestry, and grassland, 26,417 hectares bare land, 1203 hectares institutional buildings and residential lands, and 15 hectares water body.
The livelihood of people living in the study area is mainly dependent on agriculture. Crop and livestock production systems are the main livelihood strategy for much of the population in the district. The crops grown include teff, barley, wheat, bean, malt barley, sorghum, finger millet, haricot bean, chickpea, and others. Different vegetables and fruits such as tomato, potato, onion, lettuce, carrot, garlic, banana, mango, and apple are growing using irrigation both at the rainy and dry seasons. Irrigation in the study area is practiced from different sources such as micro dams (earth and concrete), river diversion, Arce ware dams, shallow wells, and ponds. The livestock reared includes cattle, equines, shoats, and poultry, which is the main source of household income and employment in the study area.
2.2. Data type and methods of data collection
In this study, both primary and secondary data were used. Both formal and informal survey procedure was used to collect primary data. The formal survey was undertaken through interviews with selected irrigation user and non-user farmers using a pretested semi-structured questionnaire. Secondary data was collected from published and unpublished documents, and internet sources.
2.3. Sampling techniques and sample size determination
Out of six Kebele’s that small scale irrigation extensively practiced in Mekdela woreda, two kebeles (Qebtia and Tebi) were randomly selected. The target population of the study consists of all farmers from the selected kebele communities of each irrigation scheme that are irrigation users and non-users in the study area(). The study employed the “with” and “without” approach by comparing farmers who used irrigation and farmers who did not use irrigation.
Table 1. List of target population of the study
A stratified random sampling technique was used to select sample respondents. Household heads from the two kebeles with respective irrigation schemes were identified and stratified into two strata user and non-user households. To ensure a fair representation of irrigation users a list of the irrigating farmers was obtained from scheme management, and farmers stratified according to their location on the scheme. From these sub-strata, random selection was done to obtain a sampled respondent.
Therefore, the researchers used(Yamane, Citation1967) to determine the required sample size a 95% confidence level.
Where: n = the number of required samples of each irrigation scheme (sample size); N = total households of each irrigation scheme (population size); e = confidence level (0.06)
Therefore, 96 irrigators and 162 non-irrigators with a total of 258 sample households were interviewed()
Table 2. Sampled household of the study
2.4. Methods of data analysis
Descriptive statics and econometric analysis were used to analyze the collected data from the sample respondent of irrigation users and non-user. Mean and percentages were used to examine and understand the socio-economic situations of the sample households. Moreover, a t-test was used to compare irrigation users and non-users in terms of different explanatory variables. Econometric analysis logit model and Endogenous switching regression model were used to identify the determinants of participation and the impact of the small-scale irrigation scheme on farmers’ livelihood respectively.
2.4.1. Econometric model specification: ESR
There are various econometric models for estimating the impact of small scale participation on user’s income. The most widely used models and techniques for the cross-sectional survey are simple comparison of mean of irrigation users and non-users, ordinary least square by regressing irrigation participation as a binary variable and propensity score matching. However, these approaches assume that irrigation participation is exogenously determined, while it is endogenous (Di Falco & Veronesi, Citation2018; Khanal et al., Citation2018). If participation was assigned randomly, its impact on yield can be easily estimated with the comparison of user and non-users. However, if the farmers who participate have different characteristics from the non-users, the comparison between the two groups might be biased. In the study area, the interventions of small-scale irrigation schemes were not randomly distributed and the decision to participate in small-scale irrigation farming is voluntary, it is very likely that the estimate of the simple OLS be biased (Maddala, Citation1986a). It is usually difficult to model unobservable characteristics, for instance, skill and motivation of the farmer. It is usually difficult to model unobservable characteristics, for instance, skill and motivation of the farmer (Gorst et al., Citation2018 & Khandker et al., Citation2010). It is very likely to have a correlation that the user farmers participate and gain better income, and hence the impact of adaptation might be overestimated due to this omitted unobservable. The other option that the existing literature widely used is the propensity score matching. It requires unconfoundenness where all the variables that affect the treatment and the outcome must be observed (Caliendo & Kopeinig, Citation2008) assuming no selection bias due to unobserved characteristics. However, unobservable characteristics are unavoidable in the participation and production framework. Thus, matching helps control only for observable differences, not unobservable differences. According to (Alene & Manyong, Citation2007) self-selection into an intervention utilization would be the source of endogeneity, and failure to account for this bias would obscure the true impact of the intervention. As a result, the best model for resolving the selection bias issue is the ESR. It is possible to estimate the impact of participation on income by correcting the selection bias. Thus, the endogenous switching approach is far better than OLS in cases where unobservable factors simultaneously affect the participation decision and the income of farmers..
2.4.2. Endogenous selection and switching regression model
The endogenous regression model is two stage (Di Falco et al., Citation2011). ESR measuring the impact of the program when treatment has not been randomly assigned and the treatment variable as endogenous is by using the instrumental variable (IV) method. The idea is to find an observable exogenous variable that influence the participation variable but do not influence the outcome of the program if participating (Khandker et al., Citation2010).
ESR designs account for both endogeneity and sample selection bias by estimating a simultaneous equation model using full information maximum likelihood method, it allowed us to control both selection and unobserved heterogeneity issues that may arise onwards doing the basic estimation procedure (Lokshin & Sajaia, Citation2004). Moreover accounting for selection bias arising from unobserved factors that potentially affect both the decision to use irrigation and the outcomes, it controls for structural differences between the irrigation users and non-users regarding the outcome functions (Alene & Manyong, Citation2007).
Following (Lokshin & Sajaia, Citation2004), in this approach, there are two stages, first the decision to use irrigation (selection equation) is modeled by standard limited dependent variable models, and second, the outcome variables are then estimated separately for each group conditional on having the selection equation. Therefore, the selection equation is a dichotomous choice, where a smallholder farmer decides to use irrigation when there is a positive perceived difference between having the scheme and not having the scheme. Consider a farm household that faces a decision on whether or not to use irrigation. Let the indicator variable be
taking a value of 1 for households who decided to use irrigation and 0 otherwise.
This leads to two possible states of the world: a decision to use irrigation (=1) and not to use irrigation (
=0), and two population units:
Let’s denote the benefits to the household of using irrigation ( and the benefits of the household not using irrigation (
. Under a non-random utility framework, a rational farm household will choose to use irrigation if the benefit of participation is positive i.e.
>
or
the net benefit
is represented by a latent variable.
Conditional on households’ decision to use irrigation denoted by a selection function (), there are two potential outcomes to the two population units: the outcome of the irrigation user
and the outcome of the non-user (
). This can be put in a potential outcome framework as:
The gain from the intervention is provided as . Hence, taking a simple difference and averaging cannot give the effect of the intervention, causing a “missing data” problem (Heckman et al., Citation2001). Therefore, following (Lokshin & Sajaia, Citation2004) the selection equation as a latent variable framework can be expressed as:
Conditional on selection, the outcomes are represented by a switching regime as follows:
Where is vectors of observed characteristics that determine the selection equation (includes household, demographic, socioeconomic, and farm characteristics);
and
are vectors of explanatory variables assumed to be weakly exogenous and determine the outcomes of irrigation users and non-users. Although Z and X can overlap, there must be at least one variable in Z is required not to be included in X to properly identify the outcome equations and
,
and
are a vector of unknown parameters to be estimated. The
and
are livelihood indicators (outcome variables), in this case, income for regime 1 and regime 2 respectively. According to this study, income (
where
represents the income of the irrigation users whereas,
are the income of the non-users, respectively. The error terms of the continuous outcome equations (
and
and selection equation
.
Following (Foltz, Citation2004), this paper, first assumes that the unobserved residual effects of the selection equation are independent of unobserved residual effects of the outcome equations of the two regimes. That is
This implies that sample partitioning between the irrigation user and non-user is entirely exogenous to their behavior so that an exogenous switching structure results. The unconditional expectation of these models can be expressed by Applying ordinary least squares to give a consistent estimate of the .
However, there is a high likelihood that uncontrolled factors simultaneously influencing the selection equation and the level of outcomes (livelihood indicators), so that ) ≠ 0. Under this scenario sample separation between the irrigation users and non-user households become endogenous to their behavior and governed by the selection equation regime. Here, the paper assumed a trivariate normal distribution of error terms, with zero mean and a covariance matrix represented by Σ i.e. (
,
,
) ~ (0, Σ). Further justification, the error term v of selection equation is correlated with the error terms
and
of outcome equations. Accordingly, the expected values of
and
would be non-zero conditional upon the selection equation. This makes ordinary least square estimates to be more biased. The covariance matrix Σ is expressed as follows:
Where var () =
is the variance of the error term in the selection EquationEquation (1)
(1)
(1) , var (
) =
and var (
) =
, are the variances of the error terms in the outcome functions EquationEquation (2)
(2)
(2) and (3) respectively, and cov (
, cov (
). Whereas the cov (
) is not defined, as
and
are never observed simultaneously (Lokshin & Sajaia, Citation2004).
=1, because
is estimable up to a scalar factor (G S Maddala, Citation1983).
The endogeneity can be tested with estimates of the covariance terms. If =
= 0, one has a model with an exogenous switching; on the other hand, if either
or
is non-zero, one has a model with an endogenous switching (G S Maddala, Citation1986b). Consequently, the significance of the correlation coefficients between
and (
) and between
and
needs to be tested (Lokshin & Sajaia, Citation2004). In line with standard statistical arguments,
and
must lie between −1 and 1, and
and
must be always positive
Based on the argument on the distribution of disturbance terms, the logarithmic likelihood function can be formulated following the procedure by (Lokshin & Sajaia, Citation2004) whom they depend on their derivation on (G S Maddala, Citation1983).
Where F (.) is a cumulative normal distribution function, f (.) is a normal density distribution function is an optional weight for observation
, and
Where j =1, 2
In addition to the endogeneity test, and
provide economic interpretation depending on their signs. If
and
have opposite signs, households decide whether to have irrigation or not based on comparative advantage (Fuglie & Bosch, Citation1995; Maddala, Citation1983). That is, irrigation users enjoy above-average total income once having irrigation whereas, non-users enjoy above total income when not having irrigation. Alternatively, if
and
have the same signs, it demonstrates “hierarchical sorting” (Fuglie & Bosch, Citation1995) suggesting that the irrigation users’ income is above the average level whether or not they have irrigation but get better off having than not having. Similarly, the non-users’ income is below the average level in either case but get better off choosing not having irrigation. Moreover, the coefficient
and
can give evidence for model consistency under a condition
(Trost, Citation1981). This implies that the irrigation user enjoys an income level than they would if they did not have irrigation.
The key issue in controlling for the endogeneity of the selection equation is identification. It is necessary of finding instrumental variables that could be strongly correlated with the selection equation (EquationEquation 1(1)
(1) ) but not the livelihood outcome equations (EquationEquations 3
(3)
(3) and Equation4
(4)
(4) ). From the variables in the data set, this study uses the distance from the household’s residence to the irrigation scheme and irrigation user neighbor used as instrumental variables are properly identify the model (). Following (Di Falco et al., Citation2011), the validity of the selection instruments was tested. According to his argument, a variable is a valid selection instrument, if it will significantly affect the selection variable (irrigation) but it will not affect the total income households that did not use irrigation. The average treatment effect on the treated (ATT) and untreated (ATU) were computed by comparing the expected values of the outcome of the irrigation user and non-user households in actual and counterfactual scenarios. The estimates from endogenous switching regression allow for the computing of the expected values in the real and hypothetical scenarios: Following model estimation, Stata allows calculation of the following conditional expectations (Lokshin & Sajaia, Citation2004).
Table 3. Conditional expectations, treatment, and heterogeneity effects
Table 4. The description of variables and their measurements used in ESR
Actual expected outcome: irrigation users
Counterfactual expected outcome: irrigation users
Counterfactual expected outcome: non- users
Actual expected outcome: non-users
Equation (EquationEquation 6(6)
(6) ) and (EquationEquation 9
(9)
(9) ) represent the actual expectations observed from the sample, while (EquationEquation 7
(7)
(7) ) and (EquationEquation 8
(8)
(8) ) are the counterfactual expected outcomes. Given the above formulation, the following mean outcome difference can be calculated and compared. The expected change of irrigation users that means the effect of treatment on the treated (ATT) is computed as the difference between Equation (6) and (7):
Similarly, the expected change in the non-users, the effect of the treatment on the untreated (ATU) is the difference between Equation (7) and (9):
The treatment effects can be differentiated from the heterogeneity effect because of the presence of unobservable characteristics. Therefore, “the effect of base heterogeneity” () for the group of households that decided to use irrigation is defined as the difference between (EquationEquation 6
(6)
(6) ) and (EquationEquation 7
(7)
(7) ):
Similarly, “the effect of base heterogeneity” () for the group of households that decided to not to use irrigation is defined as the difference between (EquationEquation 8
(8)
(8) ) and (EquationEquation 9
(9)
(9) )
Finally, the effect called “transitional heterogeneity” (TH), estimates whether the effect of having irrigation is larger or smaller for households that use irrigation or for the households that did not use in the counterfactual case that they did use. It is the difference between (EquationEquation 10(10)
(10) ) and (EquationEquation 11
(11)
(11) ), i.e. (
) minus (
) ():
3. Result and discussion
3.1. Descriptive analysis
The demographics and socio-economic characteristics of the sample population of the irrigation users and non-users with comparison groups are presented in () below. The average age of household heads of the irrigation user is nearly 39.5 years while that of the non-user is approximately 45.7 years.Footnote1
Table 5. Respondents socioeconomics characteristics
Ninety-four percent of irrigator are male-headed households compared to 82% of non-irrigators () According to the FGD and KI report, in the study area, female-headed households hardly faced labor shortage for irrigation as well as rain-fed farming due to physical, technological, socio-cultural and psychological fitness of farm instruments to females than males. To overcome the challenge, different governmental and non-governmental organizations were given training, demonstration, irrigation technology, and improved seed for female household heads. The average household size of the irrigation user was 4.2 and non-users were found to be 4.7 ().
In terms of educational status, 43% of irrigator households are literate headed compared to 24% of non-irrigators who are illiterate. Adult labor of the irrigation users was approximately 4.3 compared with the non-users 4.1 (). The size of the labor force in the household is expected to contribute to a variation in participation decisions in small-scale irrigation and level of income. According to FGD and KII report, in the study area, labor is highly required in time of weeding, harvesting, threshing, watering, livestock herding, and plowing, especially in time of watering for irrigation users because it is a daily and year-round activity.
Cultivated land appears to be the most important scarce factor of production. The average owns cultivated landholding of the sampled households was 1.2 hectare. In comparing with the user and non-user, the average cultivated land size of the irrigation user was 1.4 ha, and the non-users were 1.04 ha (). According to the FGD and KII report, in the study area, own land, rented land, shared cropping lands and gift lands are a common practice of farming. Shared cropped land and rented land are mainly done through contractual arrangements to share the harvest and tend to occur when the owner of the land cannot cultivate by himself/herself. Mostly, the agreement is for a short temporary period (for one year or two to three years) based on rented or different crop sharing agreement.
The distance of irrigated land from home in comparison with irrigation status, non-irrigation users are located far away from the irrigation scheme with an average distance of 3.32 km compared to users 1.67 km (). Credit is the main source of finance for poor farmers to purchase input and ultimately to adopt new technology. The comparison by access to irrigation the survey result revealed that 58% of the irrigation users and 30% of the non-users had utilized credit for the support of farming ().
Farm animals have an important role in rural livelihood. They are a source of draught power, to supplement protein needs, like prestige, cash, animal dung for organic fertilizer, and means of transport. Like many other similar studies, it was measured in terms of Tropical Livestock Units. The average livestock holding of the irrigation user was 5.37 TLU and the non-users were 4.84 TLU ().
Thirty-seven percent of irrigators participated in off-farm income generation activities whereas 75% of the non-irrigators participated in off-farm income activities (). In developing countries, a social network such as neighbors, friends, and families are the main source of information and confidence in the process of technology or new practice utilizations. Irrigation users are more connected to each other 81% of irrigators have irrigation participated neighbors than 26% of non-irrigators ().
3.2. Econometric results
3.2.1. Factors influencing participation in irrigation
The binary logit model was used to estimate the household decision to the participation of an irrigation scheme ().
Table 6. Marginal effects from logit estimation for determinants of participation in irrigation
The analysis of the binary logit model shows that out of the 14 hypothesized variables eight explanatory variables were identified as a significant variable that affects the household participation decision in the irrigation scheme in the study area. These are the age of the household (Agehh) and the age square of the household (Aghh2), Own cultivated land (Owncultland). Adult labor (Adult labor), off-farm job participation (offpart), extension contact (Extencontact), distance from homestead to market (Distmkt), distance from homestead to the scheme (Dischme) in ().
A link test was done to determine the association among the independent variable (Daryl Pettitt, Citation1989; Pregibon, Citation1979). The value of the link test, in the logit regression model, looks every bit as reasonable as the original model. The link test reveals no problems with our specification variable having seen a dataset. Moreover, the link test p-value (0.353) was statically insignificant means no enough evidence to say that the model is miss specified (). Therefore, the irrigation decision model can be explained through the included explanatory variables. Additionally, the Pseudo R-square indicates that about 88.5% of the variation in the irrigation decision model can be explained through the included explanatory variables. The overall model is statistically significant at a P-value of 0. 000. Hence, the chosen observable characteristics adequately explain the probability of participation ().
3.2.1.1. Age of the household
The analysis showed that it negatively and significantly influenced the probability of household heads to use irrigation at a 5% significance level (). This may be because the use of irrigation is labor-intensive and exhaustive work that the older household heads cannot tolerate this challenge. In another way, the negative sign indicates that younger farmers use irrigation than older farmers. Koundouri et al. (Citation2006) also found that the older the household head the less motivated to adopt new irrigation technology. The marginal effect also confirms that the age of the household head increases by 1 year to a certain level, the probability of participation in small scale irrigation would decrease by 1.9%, other variables in the model remaining constant.
3.2.1.2. Own cultivated land
The analysis showed that the variable has a positive sign and it was significant at 1% probability level (). In the study area households with larger cultivated land produce a relatively sufficient amount of crop for consumption and sell with both irrigation and rain-fed farming system. The marginal effect also confirms that the household owned one more hectare of its own land for irrigation the probability of participation would increase by 3.36%.Similar results were reported by Abdissa et al., Citation2017.
3.2.1.3. Off-farm job participation
The analysis showed that it negatively and significantly affects the decision to use irrigation at a 5% significance level (). Thus, farmers engaged in off-farm activities less likely to participate in irrigation. Participation in non-farm activity may restrict the allocation of labor to farm activities. The marginal effect of this variable also confirms that household heads that are engaging in non-farm participation are 6.5% less likely to participate in small scale irrigation than those household heads that have not participated in non-farm activities. A similar result was reported by Abdulai and Huffman (Citation2014). Whereas Nonvide, Citation2019 reported a positive relation off-farm job and irrigation participation.
3.2.1.4. Extension contact
The finding showed a positive and significant effect on the decision to use irrigation at a 5% significance level (). It indicates that sampled households having a greater number of contacts with development agents are more likely to use irrigation; access to updated support leads the probability of adopting new technology. Compared to households with no or little extension contact of their counterparts. The marginal effect of this variable also revealed that the probability of using irrigation increased by 3.2% as a household has extension contact (). This result is consistent with (Abdissa et al., Citation2017; Sikhulumile & W, Citation2014).
3.2.1.5. Distance from residents’ homestead to the nearly local market
The model result showed a negatively and significantly affected household participation decision at a 1% significance level (). As the distance of the market far from the homestead, farmers incur high marketing and transportation cost while marketing farm products inconvenience in transporting perishable products. The households might choose to sell their product at a cheaper price to local and neighbor traders. The marginal value of this variable suggests that for a one-kilometer distance from a market a household resides the possibility of partaking in irrigation farming decreases by 0.93% (). Therefore, households that are far apart from the local market might discourage to use irrigation. This result is in line with other studies conducted by Abdissa et al., Citation2017; De Haan, Citation2012; Hichaambwa, Citation2015; Sikhulumile & W, Citation2014. They suggested that the better the household access to the market the more probable to participate in irrigation.
3.2.1.6. Distance of residence from irrigation scheme
The model result showed a negative and significant effect on the household’s decision to use irrigation at a 5% significance level (). The negative relationship tells us that when the household head’s residence is far from the irrigation scheme; the household heads have less probability to use irrigation. The marginal effect also describes that when a household became far from the water source by 1 kilometer, the possibility of partaking in irrigation decreases by 13.2%. The result is consistent with the finding of Abdissa et al., Citation2017; Kuwornu & Owusu, Citation2012.
3.2.1.7. Irrigation user neighbor
The model result showed a negative and significant effect on the household’s decision to use irrigation at a 10% significance level (). In developing countries, a social network such as neighbors, friends, and families is the main source of information and confidence in the process of technology or new practice. Hence, the existence of a neighbor user (farmer to farmer contact) is expected to influence peer fellow neighbors to participate in irrigation farming. The marginal effect of this variable also revealed that the probability of using irrigation increased by 6.27% as a household has extension contact. The result is consistent with the finding of Gebrehiwot et al., Citation2017.
3.2.2. Endogenous switching regression model livelihood estimation result
The estimation result for the endogenous switching regression is given in (). The estimation were carried out with full information maximum likelihood procedure in STATA using the move stay command (Lokshin & Sajaia, Citation2004) to examine whether the irrigating farmers had been aware of the changes in their mode of life or not. Total income of the household where livelihood indicators of the study; estimated using the selection equation as the bases of separation across the two groups of households. The model diagnostics test Wald chi2 (12) indicates the overall fitness of the model at less than 5% significance level for outcome variable income. The result of the likelihood ratio test reported in () rejects at 5% significance level the hypothesis that the two equations are jointly independent. This result suggests that the two equations were jointly dependent.
Table 7. Full-information maximum-likelihood estimate of the switching regression
Moreover, the estimated coefficient of correlation between the selection equation and household total income of irrigation users was negative and statistically significant at 1%, indicating a failure to reject the hypothesis of sample selection bias (). This confirms the presence of selection bias suggesting that addressing the self-selection bias issue by accounting for both observable and unobservable factors is a prerequisite for obtaining consistent and unbiased treatment effect of participation on small-scale irrigation. The negative and significance of indicates negative selection bias, suggests that farm households that choose to use irrigation obtain higher income due to unobserved characteristics than a random farm household in that regime. It further suggests that farm households that did not use irrigation receive neither higher nor lower income than a random farm household in that regime. Similarly, the correlation coefficient irrigation participation and non-user income
were negative but not significantly different from zero. It indicates that, without use in irrigation, there would be no significant difference in the average behavior of the two farm household groups which arises from unobserved effects.
The estimated results presented in also demonstrate that a significant variation on the impacts has been revealed across the two groups of households. These variations were accounted for the irrigation user statuses of households, keeping other things remain constant. This implies that the condition to use irrigation distorted the effect of explanatory variables across the two groups of households.
The ESR model result shows the age of the household head and adult labor in adult equivalent positively affect irrigation user income whereas the age of the household head square and distance to the nearest local market affects negatively user income. Variables like own cultivated land, livestock ownership, farming experience, and the number of extensions contact affect non-user income positively and the age of the household head square affects negatively nonusers’ income.
An important question is whether farmers that use small-scale irrigation improve their livelihood status in terms of total income. The results, obtained using Equationequations (6(6)
(6) up to 14), are presented in . In other words, to evaluate the impacts of small-scale irrigation on farmers’ livelihood; the conditional expected total income by the irrigation users
are compared with what they would have enjoyed the non-users
). As shown from , the observed difference in total income between the irrigation users and non-users (ATE) was ETB 70419 (240%) ((a)—(b)). However, this simple comparison is misleading because unobserved factors that may impact both outcome variables were not accounted for.
Table 8. Test of the predicted total income of irrigation user and non-user households
Hence, following, (Carter & Milon, Citation2005) the base heterogeneity due to the potential unobservable effect on the livelihood outcome variables was included to get the true impact estimate. Within the counterfactual condition, that irrigation users placed in the non-users status (BH1Y) in () households would be expected to earn, an average of, ETB 63547 more income. Similarly, the counterfactual condition that the non-users placed in the irrigation user’s status
, would expect to earn, an average of, ETB 62590 earn income.
Therefore, income counterfactual conditions, the users under the status of access to irrigation were performing better than the non-users. These results in access to irrigation effects are larger for the counterfactual non-user households, resulting in a positive transitional heterogeneity effect of outcome variables (ETB 957Footnote2) more income.
The survey result revealed that the actual expected income of the irrigation users was approximately ETB 99852, while the expected income that the same irrigation users would have enjoyed if they did not use irrigation
was approximately ETB 92023. Therefore, the observed income gap (ATT) was found to be ETB 7829 (8.5%) due to irrigation access. Similarly, the counterfactual of the non-users (if non-users decided to use irrigation) (ATU) was ETB 6871 (23.3%) higher income than their counterpart. Both results were statistically significant at less than a 1% significance level. The result was in agreement with other studies that report a positive link between irrigation participation and income (Adego et al., Citation2019; Gebrehiwot et al., Citation2017; Kuwornu & Owusu, Citation2012; Li et al., Citation2020; Nonvide, Citation2019; Zeweld et al., Citation2015).
This study indicates that irrigated agriculture has brought positive changes to respondents’ income, which enables them to send their children to schools, buy livestock, build up assets, cover medical expenses, purchase inputs, buy more food and non-food items. Generally, the estimated treatment effects show that the use of small-scale irrigation places farmers in a better livelihood position.
4. Conclusion and recommendation
The study was undertaken to examine the impact of small-scale irrigation on farmer’s livelihood in the case of mekdela woreda, northeast Ethiopia. The logit model result indicates that age and age square of the household, own cultivated land, adult labor, extension contact, and accesses to off-farm income, distance from homestead to the nearly local market, and distance from home to the irrigation water source are significantly affecting farmers participation to use small scale irrigation.
The endogenous switching regression model was employed to estimate the impact of small-scale irrigation on farmers’ livelihood. The model considers selection bias associated with the endogeneity of irrigation participation. The ESR model result shows the age of the household head and adult labor in adult equivalent positively affect irrigation user income whereas the age of the household head square and distance to the nearest local market affects negatively user income. Variables like own cultivated land, livestock ownership, farming experience, and the number of extensions contact affect non-user income positively and the age of the household head square affects negatively. Hence using small-scale irrigation had increased irrigation user’s income by 7829 ETB (8.5%), as compared to non-user. The results indicate that small scale irrigation schemes have a profound effect on household income for their livelihood improvement.
Expanding the access and capacity of small-scale irrigation and creating additional access through integrated water investment is important to increase users’ farm income leads to households’ livelihood improvement. Market infrastructure, like rural road construction and provision of transportation facilities, could connect irrigating farmers to the market and minimizes their marketing cost. Thus, striving to create market linkage for their farm product could raise farm income, asset formation, and would be the most urgent action required. The policy implications of the above findings are improving access to water for irrigation and market, and raising farmers’ awareness through extension and provision of other complementary services would enhance the participation of irrigation.
Disclosure statement
The authors declares no competing interests.
Additional information
Funding
Notes on contributors

Eliyas Assefa
Eliyas Assefa an Agricultural Economist works on government and non-governmental organizations projects as Monitoring and Evaluation Officer, Project coordinator and project technical officer positions. He has implementing and design several projects, Monitoring and Evaluation Plans, Carried out analysis of commodity value chains. He has worked on projects focus on livelihood improvement of poor household and youth, economic empowerment of women and people with disabilities. Now, he is a Project coordinator in Women Empowerment Action. Impact and adoption analysis, socio-economics assessments, gender-related analysis, value chain, and supply chain analysis, sustainable livelihood analysis, poverty analysis, and economic valuation are the author’s interest areas of research.
Notes
1. This operationalize as the study year.
2. 1USD = 28.1089 ETB @ survey time 2019.
References
- Abdissa, F., Tesema, G., & C, Y. (2017). Impact analysis of small scale irrigation schemes on household food security the case of Sibu Sire District in Western Oromia, Ethiopia. Irrigation & Drainage Systems Engineering, 06(2 ). https://doi.org/10.4172/2168-9768.1000187
- Abdulai, A., & Huffman, W. (2014). The adoption and impact of soil and water conservation technology: An endogenous switching regression application. Land Economics, 90(1), 26–20. https://doi.org/10.3368/le.90.1.26
- Adego, Tsega, Simane, Belay, & Woldie, Getachew A. (2019). The impact of adaptation practices on crop productivity in northwest Ethiopia : An endogenous switching estimation.Published in Development Studies Research (pp. 5095). https://doi.org/10.1080/21665095.2019.1678186
- Alene, A. D., & Manyong, V. M. (2007). The effects of education on agricultural productivity under traditional and improved technology in northern Nigeria: An endogenous switching regression analysis. Empirical Economics, 32(1), 141–159. https://doi.org/10.1007/s00181-006-0076-3
- Awulachew, S. (2005). in Ethiopian agricultural development: Assessment of existing situation. International Water …. http://publications.iwmi.org/pdf/H037499.pdf
- Awulachew, Seleshi Bekele, Erkossa, Teklu, & Namara, Regassa. (2010). } Irrigation potential in Ethiopia: constraints and opportunities for enhancing the system. https://doi.org/10.21955/GATESOPENRES.1114943.1 https://www.semanticscholar.org/paper/Irrigation-potential-in-Ethiopia%3A-constraints-and-Awulachew-Erkossa/4c8046c96fc043e2f2983417fb7984c1dab2ab47.
- Bekele, D. (2011). Linking irrigation farmers to markets : The case of murtute irrigation farmers, Ethiopia. Erasmus University.
- Caliendo, M., & Kopeinig, S. (2008). Some practical guidance for the implementation of propensity score matching. Journal of Economic Surveys, 22(1), 31–72. https://doi.org/10.1111/j.1467-6419.2007.00527.x
- Carter, D. W., & Milon, J. W. (2005). Price knowledge in household demand for utility services. Land Economics, 81(2), 265–283. https://doi.org/10.3368/le.81.2.265
- CSA. (2013). Population projections for Ethiopia from 2007 to 2037. July, 173.
- De Haan, L. J. (2012). The livelihood approach: A critical exploration. Erdkunde, 66(4), 345–357. https://doi.org/10.3112/erdkunde.2012.04.05
- Di Falco, S., Veronesi, M., & Yesuf, M. (2011). Does adaptation to climate change provide food security? A micro-perspective from Ethiopia. American Journal of Agricultural Economics, 93(3), 829–846. https://doi.org/10.1093/ajae/aar006
- Falco, Salvatore, & Veronesi, Marcella. (2018). Managing environmental risk in presence of climate change: The role of adaptation in the Nile Basin of Ethiopia. In Climate Smart Agriculture (pp. 497–526 https://econpapers.repec.org/scripts/redir.pf?u=https%3A%2F%2Fdoi.org%2F10.1007%252F978-3-319-61194-5_21;h=repec:spr:nrmchp:978-3-319-61194-5_21). Springer.
- Foltz, J. D. (2004). Credit market access and profitability in Tunisian agriculture. Agricultural Economics, 30(3), 229–240. https://doi.org/10.1111/j.1574-0862.2004.tb00191.x
- Fuglie, K. O., & Bosch, D. J. (1995). Economic and environmental implications of soil nitrogen testing: A switching‐regression analysis. American Journal of Agricultural Economics, 77(4), 891–900. https://doi.org/10.2307/1243812
- Gathala, M. K., Kumar, V., Sharma, P. C., Saharawat, Y. S., Jat, H. S., Singh, M., Kumar, A., Jat, M. L., Humphreys, E., Sharma, D. K., Sharma, S., & Ladha, J. K. (2013). Optimizing intensive cereal-based cropping systems addressing current and future drivers of agricultural change in the northwestern Indo-Gangetic Plains of India. Agriculture, Ecosystems & Environment, 177, 85–97. https://doi.org/10.1016/j.agee.2013.06.002
- Gebrehiwot, K. G., Daniel, M., & Woldu, T. (2017). The impact of micro-irrigation on households’ welfare in the northern part of Ethiopia: An endogenous switching regression approach. Studies in Agricultural Economics, 119(3), 160–167. https://doi.org/10.7896/j.1707
- Gebremedhin, B., & Peden, D. (2003). P Policies and institutions to enhance the impact of irrigation development in mixed crop–livestock systems. Integrated water and land management research and capacity building priorities for Ethiopia, 168.Policies and institutions to enhance the impact of irrigation development in mixed crop-livestock systemsLength: pp. 168-184. International Water Management Institute.
- Gorst, A., Dehlavi, A., & Groom, B. (2018). Crop productivity and adaptation to climate change in Pakistan. Environment and Development Economics, 23(6), 679–701. https://doi.org/10.1017/S1355770X18000232
- Heckman, J., Tobias, J. L., & Vytlacil, E. (2001). Four parameters of interest in the evaluation of social programs. Southern Economic Journal, 68(2), 210. https://doi.org/10.2307/1061591
- Hichaambwa, M. (2015). Determinants and welfare effects of smallholder participation in horticultural markets in Zambia. AfJARE, 10(4), 279–296 doi:http://dx.doi.org/10.22004/ag.econ.229810 http://purl.umn.edu/229810.
- Khanal, U., Wilson, C., Lee, B. L., & Hoang, V.-N. (2018). Climate change adaptation strategies and food productivity in Nepal: A counterfactual analysis. Climatic Change, 148(4), 575–590. https://doi.org/10.1007/s10584-018-2214-2
- Khandker, R. S., Gayatri, B. K., & Hussain, A. S. (2010). Handbook on Impact. In Learning (Vol. 1 (Washington DC 20433: The World Bank) 262 , Issue 1).
- Kissawike, Kalunde. (2008). Irrigation-based Livelihood Challenges and Opportunities A gendered technography of the Lower Moshi irrigation scheme in Tanzania 978-90-8504-913-5 .
- Koundouri, P., Nauges, C., & Tzouvelekas, V. (2006). Technology Adoption Under Production Uncertainty: Theory and Application to Irrigation Technology. American Journal of Agricultural Economics, 88(3), 657–670. https://doi.org/10.1111/j.1467-8276.2006.00886.x
- Kuwornu, J. K. M., & Owusu, E. S. (2012). Irrigation access and per capita consumption expenditure in farm households : Evidence from Ghana Journal of Development and Agricultural Economics . 4(3), 78–92. https://doi.org/10.5897/JDAE11.105
- Li, J., Ma, W., Renwick, A., & Zheng, H. (2020). The impact of access to irrigation on rural incomes and diversification: Evidence from China. China Agricultural Economic Review, 12(4), 705–725. https://doi.org/10.1108/CAER-09-2019-0172
- Lipton, M., Julie Litchfield, J.-M. F., & Faurès, J.-M. (2003). The effects of irrigation on poverty: A framework for analysis. Water Policy Journal, L, 5(6), 413–427. https://doi.org/10.2166/wp.2003.0026
- Lokshin, M., & Sajaia, Z. (2004). Maximum likelihood estimation of endogenous switching regression models. The Stata Journal: Promoting Communications on Statistics and Stata, 4(3), 282–289. https://doi.org/10.1177/1536867X0400400306
- Maddala, G. S. (Ed.). (1983). Frontmatter. In Limited-dependent and qualitative variables in econometrics (pp. i–iv). Cambridge University Press.
- Maddala, G. S. (1986a). Limited-dependent and qualitative variables in econometrics. Issue 3. Cambridge university press.
- Maddala, G. S. (1986b). DISEQUILIBRIUM, SELF-SELECTION, AND SWITCHING MODELS * Estimation of the switching regression model : Sample separation known Estimation of the switching regression model : Switching simultaneous systems disequilibrium models : Different formulations of. Science, III.
- Mengistie, D., & Kidane, D. (2016). Assessment of the impact of small-scale irrigation on household livelihood improvement at Gubalafto District, North Wollo, Ethiopia. Agriculture, 6(3), 27. https://doi.org/10.3390/agriculture6030027
- MoWE. (2012). Water resources management and irrigation policy: Annual report of MOWE, Addis, Ethiopia.
- MoWIE. (2002). Water Sector Development Program - Main report. Report, I(October), 193.
- Nonvide, G. M. A. (2019). A re-examination of the impact of irrigation on rice production in Benin: An application of the endogenous switching model. Kasetsart Journal of Social Sciences, 40(3), 657–662. https://doi.org/10.1016/j.kjss.2017.12.020
- Norton, G. W. J. A. W. A. M. (2010). Economics of agricultural development world food systems and resource use (2nd ed.). Routledge Textbooks in Environmental and Agricultural Economics.
- Pettitt, A. N. (1989). One degree of freedom for nonadditivity: Applications with generalized linear models and link functions. Biometrics, 45(4), 1153–1162. https://doi.org/10.2307/2531767
- Pregibon, D. (1979). Data analytic methods for generalized linear models [ Ph. D. University of Toronto]. https://www.worldcat.org/title/data-analytic-methods-for-generalized-linear-models/oclc/640147904
- Seleshi, B., Denekew, A., Loulseged, M., L, W., Ayana, M., & Alamirew, T. (2007). Water resources and irrigation development in Ethiopia.
- Sikhulumile, S. M. M., & W, E. (2014). The impact of smallholder irrigation on household welfare: The case of Tugela Ferry irrigation scheme in KwaZulu-Natal, South Africa. Water Research Commission, Water SA(V https://doi.org/10.4314/wsa.v40i1.18.
- Smith, L. E. D. (2004). Assessment of the contribution of irrigation to poverty reduction and sustainable livelihoods. International Journal of Water Resources Development, 20(2), 243–257. https://doi.org/10.1080/0790062042000206084
- Tesfaye, M., & Beshir, H. (2018). Impact of small scale irrigation on the livelihood of rural farm households : The case of Oromo Zone, Eastern Amhara, Ethiopia. Journal of Saemaulogy, 3(2).
- Trost, R. P. (1981). Interpretation of error covariances with nonrandom data: An empirical illustration of returns to college education. Atlantic Economic Journal, 9(3), 85–90. https://doi.org/10.1007/BF02300600
- Yamane, T. (1967). Statistics: An Introductory Analysis (2nd ed.). Harper and Row.
- Zeweld, W., Huylenbroeck, G. V., Hidgot, A., Chandrakanth, M. G., & Speelman, S. (2015). Adoption of small-scale irrigation and its livelihood impacts in Northern Ethiopia. Irrigation and Drainage, 64(5), 655–668. https://doi.org/10.1002/ird.1938
- Zhou, Y., Zhang, Y., Abbaspour, K. C., Mosler, H.-J., & Yang, H. (2009). Economic impacts on farm households due to water reallocation in China’s Chaobai watershed. Agricultural Water Management, 96(5), 883–891. https://doi.org/10.1016/j.agwat.2008.11.011