
 ?Mathematical formulae have been encoded as MathML and are displayed in this HTML version using MathJax in order to improve their display. Uncheck the box to turn MathJax off. This feature requires Javascript. Click on a formula to zoom.
Abstract
The major objective of this study was to examine the impact of Coffee exports on economic growth in Ethiopia. The study employed an extended generalized Cobb–Douglas production function model using data from the National Bank of Ethiopia and World Bank data base from 1980 to 2017. All the variables were non stationary at level and integrated of order I (1), and then co-integration test was conducted to ensure the existence of long-run relationship using Johansen’s approach. Consequently, all the variables confirmed co-integartion, and the conventional VECM was estimated to extract both short-run and long-run relationships, and finally, Granger causality test was conducted to diagnose the direction of causation. The finding of the study revealed that coffee exports have insignificant short-run impact on economic growth, but significant positive impact in long run. The result from causality exerted bidirectional relationship holds in Ethiopia’s coffee exports, likewise the result from IRF revealed coffee exports has a positive impact on long-run economic growth. Besides, labor force, capital formation, non-coffee exports and real effective exchange rates included in the model were found positive and significant impact in long run. Furthermore, the coefficient of ECT is −0.4883 that shows any deviations from long-run equilibrium is corrected at 48.83% annually and converges towards its long-run equilibrium. Based on the findings, it is recommended that a long-run policy towards exports in general and coffee export in particular is believed to provide significant impact on economic growth. Thus, increasing efficiency of the sector and exporting coffee would enable Ethiopia to sustain domestic economic growth. Besides, values had better be added to coffee beans before exporting and when this is done, it will lead to a higher economic growth in long run.
PUBLIC INTEREST STATEMENT
From early works of Adam Smith and Malthus to date researchers have tried to find important determinates that influence economic growth. Growth is among top global agendas now days and countries are struggling battles to hasten their economic growth, where Ethiopia is among others. It is theoretically and empirically believed that domestic resource mobilizations, and or international trade are among other keys to candle desired economic growth. Agriculture being mainstay of Ethiopian economy contributes about 41.4% to GDP, 83% of exports and 80% of overall employment. Predominantly, coffee farming provides livelihoods for around 15 million peoples in Ethiopia, and it contributes lion share in gross export earnings. This study empirically examined impact of coffee exports on economic growth in Ethiopia, and it has been verified that coffee export is principal source of long-run growth, in addition to other macroeconomic factors. Increasing efficiency of coffee sector, value addition to coffee beans before exporting would enable country to generate weighty revenue to finance its economic growth.
1. Introduction
Economic development is one of the principal goals of every economy in the world, and growth is indispensable for countries to achieve desired level of economic development. In a similar way, growth is determined by many factors, yet the question is how countries can realize their growth. One of the answers to this question relies on ELG hypothesis that claims export is a key factor in stimulating growth (Hameed et al., Citation2012). Due to a robust link between speedy economic growth and exports, countries are struggling battle to quicken their growth by designing Export-Led Growth strategy. For example, a strong economic performance of “Asian Tigers” in the 2nd half of 20thc has been largely attributed to external sector. Having realized role of exports, governments in LDC’s have been striving to create conducive for exports where Ethiopia is among other Ashenafi & Getaneh, Citation2014).
Agriculture is the dominant sector in Ethiopian economy. Hence, it serves as the back bone of country’s economy, which again determines the success of all other sectors Zelalem (Citation2011). It contributes for 36.3% of GDP, 85% of foreign exchange earnings, employs 79% of labor force and exports’ are highly reliant on it (National Bank of Ethiopia, Citation2017). A unique feature of Ethiopian agriculture is the role of smallholder farms in the total output. Despite the laudable efforts, the sector is still characterized by low yields, resulted from low level of inputs and limited areas under cultivation among others. This is mainly because farming system is known by rain-fed mixed farming and grows mainly for home consumption using traditional ways (Kifle et al., Citation2017)
According to National Bank of Ethiopia (Citation2017), the share of agricultural sector to GDP is reducing while those from industrial and service sectors are growing up. For instance, in 2012 agriculture, service and industry accounts 43.1%, 45.9% and 11.5% to GDP, respectively, while their share was 36.3%, 39.3% and 24.6% in 2017. Although the sector is showing a diminishing share to GDP, it still contributes for more than 80% of employment and provides 70% of raw materials for local industries. As economy is largely agrarian, export is largely dependent on the sector. Coffee is most important traded commodities in the world with development and poverty implications given high engagement in production by small-holders in Ethiopia. Thus, this study is apt as it enables to suggest policy options to enhance persistent coffee exports for optimal growth.
1.1. Statement of the problem
Agricultural sector if Ethiopia is based on traditional methods with insufficient market information, unstable price, poor quality, lack of trust among trading partners and uncoordinated markets. The bulk of the country’s export earnings come from the agricultural sector basically coffee (Habtamu, Citation2014). Furthermore, exported primary goods are less competitive related to imported capital goods making trade balance to deteriorate as compared to incumbent exporter. Empirically, reviewed studies lean toward exports nexus growth, with few paying attention to agricultural exports nexus growth, yet a single agricultural product export nexus growth is almost ignored, and this is indeed true for coffee. Coffee in Ethiopia being dynamic with credibly immense potential, why study’s has been ignored? Answer to this question creates motivation for this study. Cross country studies like, Sanjuán‐López and Dawson (Citation2010) estimated the nexus between RGDP and agricultural and non-agricultural exports in 42 LDC’s and found existence of long-run relation among variable and agricultural exports’ appeared to granger cause growth. Hence, in most literatures like Sanjuán‐López and Dawson (Citation2010), Bakari and Mabrouki (Citation2017), and Verter and Bečvářová (Citation2016) impact of agricultural export on growth were estimated and particular commodity case was in fact unseen except for few studies like Tigist (Citation2015) and Gilbert et al. (Citation2013) in Ethiopia and Cameron respectively. In addition, the periods considered by some studies were short span ranging 20–30 years on average. An empirical work on impact of coffee exports in growth has been ignored to some extent in most literatures in Ethiopia despite it has great role. Thus, this study filled the existing literature gaps by fixing on coffee. In relation to methodological gap, key limitation of most literature is omitting basic variables and only few have addressed model specification issues. For example, Bakari and Mabrouki (Citation2017; Verter and Bečvářová (Citation2016) specified economic growth model by dropping basic inputs like labor and capital. Studies by Gilbert et al. (Citation2013) did not include exchange rate. The impacts of non-coffee export in growth were not studied though there has been disaggregated analysis by Tigist (Citation2015) in Ethiopia; hence, this study considered the existing methodological gaps by presenting formerly omitted variables and gives a prime emphasis on coffee export in growth. Thus, efforts were made to answer the following research question;
1.2. Research questions
The study critically investigated the following research questions regarding the linkage between coffee exports and growth in Ethiopia for the period understudy.
What is the trends and structure of coffee exports in Ethiopia from the period 1980 to 2017?
What is the impact of coffee exports on growth in Ethiopia from 1980 to 2017?
Does causality exist among coffee exports and economic growth in Ethiopia from 1980 to 2017?
1.3. Objective
The major objective of the study is to empirically examine the impact of coffee exports on economic growth in Ethiopia from the period 1980–2017. Specifically, to show the trend and structure of coffee exports in Ethiopia, to measure the impact of coffee exports on economic growth in Ethiopia and to diagnose the presence of causality among coffee exports and economic growth in Ethiopia.
1.4. Research hypotheses
To accomplish the objectives of this study, the researchers developed research hypotheses as follow; there is a positive and significant relationship between coffee exports and economic growth in Ethiopia as a main hypothesis. There is a positive and significant relationship between labor force, capital formation, non-coffee exports, exchange rate and economic growth in Ethiopia as specific hypothesis.
1.5. Scope
The study examined the impact, the direction of causation between coffee exports and economic growth from 1980 to 2017 by using vector error correction model (VECM). 1.7.
1.6. Organization
The study is organized in five sections. Section two highlights theoretical and empirical literature. Third section presents research methodology used for the study. Fourth and fifth sections dictates analysis, and concluding remarks as well policy implication, respectively.
2. Literature review
The possible causation among exports and economic growth has been studied by different economists and four accepted scenarios were determined. These include unidirectional causation from exports to growth, growth-driven causation towards export, bidirectional causal link or none. Basically, most characteristics of export sector of LDCs holds true for Ethiopia as it is among one of LDCs. Yet, it does not mean that the sign and magnitude of exports can exactly tell growth performance as there is difference in characteristics and nature of export sector. Empirically, many studies tend to overall exports nexus growth, with few on agricultural exports nexus growth especially on coffee. Senait (Citation2014) examined the contribution of export earnings to growth in Ethiopia for the period 1961–2012 by empirically testing both long-run and short-run relations and causality using co-integration technique and VECM. The results from unit root revealed all variables are integrated of order one, and Johansen co-integration shows the existence of long-run relations among variables. Likewise, there was no causality among variables in short run, but bidirectional causality in the long run. Here finding revealed that exports positively affected growth and vice versa in long run. Based on the finding policies of increasing volume of export was suggested. Dawson (Citation2005) observed the contribution of agricultural exports on growth in LDCs using two models; first agricultural production function, including agricultural and non-agricultural exports as inputs and second dual economy model with agricultural and non-agricultural sectors, where both sector was sub divided into exports and non-exports sector. Fixed and random effects were estimated in each model using panel data of 62 LDCs from 1974 to 1995. The study found evidence that supported ELG hypothesis, where the results stressing agricultural exports lead growth and balanced export-promotion policies were suggested. Yared (Citation2010) examined the contribution of agricultural exports on economic growth in developing countries and estimated the link between GDP and value of agricultural and non-agricultural exports for 42 countries using panel co-integration. The results revealed long-run relationship between agricultural exports and growth and total exports granger-cause GDP, which supports ELG hypothesis. Hence, balanced export-promotion policies were advised for poorest countries, while riches achieve higher growth by nonagricultural exports. Faridi (Citation2012) observed the role of agricultural exports on growth of Pakistan and estimated the relationship between RGDP and agricultural and non-agricultural exports from 1972 to 2008 using Johansen’s co-integration. The results revealed that agricultural exports negatively affect growth. While, bidirectional causality was observed between agricultural exports and RGDP and based on the key findings, promoting non-agricultural exports in Pakistan economy was suggested by the study.
Gilbert et al. (Citation2013) examined the impact of agricultural exports on growth in Cameroon for case of banana, coffee and cocoa by employing augmented neoclassical Cobb–Douglas production function from 1975 to 2009. They applied Augmented Dickey Fuller (ADF) unit root test to check for stationarity and Engle–Granger co-integration to determine short- and long-run link. The findings revealed agricultural exports resulted mixed effect on growth. Coffee and banana export exerted a positive impact, while cocoa export was found to have a negative impact. Based on the findings, it is advised that policies aimed at boosting productivity and quality of export to be executed and value addition to cocoa and coffee beans before exporting. Similarly, Tigist (Citation2015) observed the impact of agricultural exports on growth in Ethiopia for the case of coffee, oilseeds and pulse from 1973 to 2013. The existence of long-run causality was tested using co- integration, ECM and granger causality. The findings of the study revealed agricultural exports resulted mixed effect on growth. Coffee and oil seeds export exerted a positive and significant effect, while pulse export was found to have negatively insignificant effect in short run and positive but insignificant effect in long run. Based on the findings, policies aimed at increasing productivity and quality of these crops by adding values to export item was suggested. Verter and Bečvářová (Citation2016) studied the impact of agricultural exports on growth in Nigeria using OLS regression, granger causality, IRF and variance decomposition approaches from 1980 to 2012. The result of supported the hypothesis that agricultural ELG, while IRF and variance decomposition revealed fluctuating result from agricultural export to growth in the long run. Based on the finding, motivating domestic processing industries and depressing of agricultural imports that a country could process cheaply were suggested. Uremadu and Onyele (Citation2016) were interested in analyzing the impact of selected agricultural exports on growth in Nigeria from 1980 to 2014 using descriptive statistics and OLS regression. The findings revealed export of cocoa was insignificant, but positive impact on RGDP, while that of rubber was negative and insignificant and agricultural exports had exerted positive impact on economic growth. Thus, policy of export financing, and value addition are suggested policy prescription.
2.1. Overview of Ethiopian economy
Like most developing countries in general and SSA countries in specific, Ethiopian economy is largely reliant on agricultural sector, yet its role to GDP is reducing on average and that of industrial and service sector is growing over time. Ethiopian economy which had exhibited 9.8% annual average growth during 2013–2017, recorded 10.9% growth in 2017, representing recovery from challenging macroeconomic and weather conditions of the previous periods (National Bank of Ethiopia, Citation2017). According to UNDP (Citation2015), external sector continued to suffer from sluggish export performance, which led the country to be classified in high risk external debt distress. To support the external effectiveness, 15% devaluation of local currency was undertaken in 2017. The country is also looking for partial privatization of major public enterprises as a part of long-term solution to foreign exchange shortages and private sector participation. The major export items of Ethiopia includes coffee, oilseeds, pulses, chat, leather products, cotton, flowers, fruits and vegetables among others. Coffee is most important export and has traditionally accounted for about 60–70% of exports. Although coffee is still Ethiopia’s number one export item accounting for 30–45% of the total export earnings, its share on total export earnings has relatively declined steadily in recent year as a result of rising exports of other produces like gold, flowers, chat, textiles, and leather products. The other possible reason for the decline in export of coffee is decline in world price. Furthermore, a decline in world prices since 2001 by 28.5% reduced coffee’s share to about 39.7% of total exports. Then, a fall in prices by about 4% in 2002, further reduced coffees share to about 35.5% of the total exports. The world prices improved slightly after 2002, and increased by 4.3% in 2003 and 17.8% in 2004 (Yared, Citation2010). Although fluctuation in prices has extremely discouraged the overall coffee farming, regulations by the Ethiopian governments are gradually relaxed over time to fully exploit coffee as a major producer. Thus, it serves as a major export earner and provider of jobs for millions of Ethiopians (about15% of peoples) rely on coffee as growers, processors, traders and exporters.
3. Research methodology
The purpose of this study is to empirically investigate impact of coffee exports on economic growth in Ethiopia. The study made use of annual time-series data from 1980 to 2017 (inclusive). The necessary data for the study was obtained from National Bank of Ethiopia and World Bank (WB) data base. The data used for the analysis is based on six variables; namely, real gross domestic product (RGDP), labor force participation(LAB), capital formation (CAP), coffee exports (COFX), non-coffee exports (NCOFX) and real effective exchange rate (REER). The sample consists of 38 observations, and the period from 1980 to 2017 was selected based on availability of data for all series.
3.1. Model specification
To examine the impact of coffee exports on economic growth in Ethiopia, attempts were made to reconcile with theoretical background of growth model. Primarily, this study started from the conventional augmented neoclassical growth framework developed by Solow (Citation1957) to specify the model, where the production function is specified in terms of inputs like labor and capital. The target here is to derive a source of growth equation which can be estimated as ). Where, Y is aggregate output or gross domestic product, L is labor input while K is capital input. To meet its objective, this study gained inspiration from the work of Faridi (Citation2012), Gilbert et al. (Citation2013), and Siaw et al. (Citation2018) in modeling the functional link between exports and economic growth. They examined the impact of agricultural export in economic growth of Pakistan, Cameroon and Ghana respectively by forming an econometric model based on a generalized Cobb–Douglas production function with aggregated and dis aggregated analysis. As a result, in this study coffee exports has been the selected agricultural item as an independent variable unlike Faridi (Citation2012) that takes whole agricultural export as single variable. Thus, in the usual notation the production function can be written as Equationequation (1)
(1)
(1) ;
Where, Y is gross domestic product (GDP), L is labor and K is capital formation.
Now, developing the same theoretical model to capture the impact of coffee export in economic growth in Ethiopia, Equationequation (1)(1)
(1) can be rewritten in the following manner together with value of coffee exports at time t in Equationequation (2)
(2)
(2) .
Where, is value of coffee exports at year t. As typical neoclassical growth model assumes Cobb-Douglas production function with exponential form, Equationequation (2)
(2)
(2) can be rewritten as;
EquationEquation (3)(3)
(3) is essentially based on the production function and extending this growth model to include coffee export indicator as an additional inputs, together with capital and labor force participation. Where, A in the model shows the level of technology utilized in the country which is assumed to be constant for this study.
Hereafter, the model in Equationequation (3)(3)
(3) can be further extended by including, non-coffee export and real effective exchange as control variables along with consistent error term Ut as in Equationequation(4)
(4)
(4) .
Where, RGDP_ real gross domestic product, LAB_ labor force participation, CAP_ is capital formation (as proxied by ratio of gross capital formation to GDP), COFX_ is coffee exports, NCOFX_is non-coffee exports or sum of all exports other than coffee and RERR_is real effective exchange rate while Ut is error term comprising all other factors that are not built-in the model, but likely to impact growth while t is the time period in years that the study covered. But, in order to make Equationequation (3)(3)
(3) linear, we can take logarithm on both sides of the equation and this will generate a growth equation of the form as in Equationequation 5
(5)
(5) ;
Where, and are parameters to be estimated. Finally, to measure the impact of coffee exports on growth of Ethiopia, the model was specified which is just a slight modification of equation_5 and together with specified control variables for growth (NCOFX and REER), but for the case of capital logarithmic value is not considered as the ratio of gross capital formation to gross domestic product was taken to capture the impact of capital formation in growth for this study (). Hence, the study employed the functions of the form log linear as developed in Equationequation (6)(6)
(6) ;
Table 1. Variables and expected signs
3.2. Methods of data analysis
After obtaining secondary data, both descriptive statistics and econometric method of analysis was carried out. The model is specified with objective to determine the extent to which coffee export is linked with RGDP (proxy for economic growth). For this study, an econometric analysis of time series data for 38 years (1980–2017 inclusive) was employed on the basis of different estimation procedures. Concerning, the application of software needed for the study, the regressions and necessary estimation was carried out using statistical package STATA 14.
3.3. Stationary and non-stationary
A stochastic process is said to be stationary whenever the mean and variance are constant over time and values of covariance between two time periods depends only on the distance between two time not actual time taken and if not it is non-stationary. In other words, it can have time varying mean or variance or both across the period (Gujarati, Citation2004).
Unit Root Test: A test of stationarity that has become widely popular is the unit root test. Unit roots refer to the presence of stochastic trends in the series, that is, the series are nonstationary as they have got a time invariant mean and variance. In the event that the series exhibit a time trend (when variables are non-stationary), estimating regressions can lead to inaccurate results and transforming non-stationary series into stationary is recommended. There are many tests for observing the existence of unit root problem in the data series. Among other, the conventional Augmented Dickey-Fuller (ADF) resulted from augmenting test tool developed by Dickey and Fuller (Citation1979) and Philips-Peron (PP) tests were employed. Thus, the following regression using ADF test was used for this study;
Co-integration Test: The purpose of co-integration test in this study is to examine whether independent variables surely impact growth in Ethiopia and shows a common strategic trend. The typical techniques used test for co-integrations are: Engle and Granger (Citation1987) two step test and Johansen (Citation1988) approach. The Engle and Granger test is a two-stage test which requires that the variables to be integrated of the same order. The first stage involves estimating the equation in level form while the second stage involves testing for stationarity of residuals of the equation to be determined. The existence of co-integration is confirmed if the residuals are stationary at level form, and thus, co-integration test is based on residuals of the model (Engle & Granger, Citation1987). Co-integration in case of multivariate equations can be tested by using Johansen (Citation1988) and Johansen and Juselius (Citation1990) approach. Johansen’s procedure of co-integration gives two statistics. First, the values of likelihood ratio (LR) tests on the basis of trace statistic value, where the second is based on maximum Eigen value of the stochastic matrix. The conclusion rule relates trace and max statistic with critical value for an assumed number of co-integrating relationships. When the trace and max statistic is greater than the corresponding critical value, the hypotheses of co-integration is accepted and rejected if not. Hence, for precision of the outcome, the study adopted (Johansen, Citation1988) co-integration and Engle–Granger approach to co-integration.
Vector Error Correction Model (VECM): Engle and Granger (Citation1987) pointed out that if two variables are co-integrated in first difference, their relationship can be expressed as VECM by taking past disequilibrium as explanatory variables for the dynamic behavior of current variables. The error correction model (ECM) first used by Engle (1987), and later popularized by Engle and Granger to correct for disequilibrium. An important theorem, known as Granger representation theorem, states that if two variables Y and X are co-integrated, then their relationship can be stated as VECM (Gujarati, Citation2004). VEC mechanism permits to examine short-run dynamics in the relationship between Y and X (Wooldridge, Citation2013). The size of the error correction (ECT) coefficient determines speed of adjustment towards long-run equilibrium and error correction coefficient should be negative indicating the existence of short-run relationship among variables. For simplicity, in this study ECM can be estimated as;
Where, which denotes short-run disequilibrium adjustments of the estimates of long-run equilibrium error and
_is the coefficient of the ECT.
Granger Causality Test: This test as developed by Granger (Citation1969) and it is an econometric tool that looks in identifying causality among a group of variables. In answering the question whether causes
and to see how much of the current value of
could be explained by the previous values of
, as well to see if adding lagged values of
could improve the expression in better way, granger causality can be expressed (in Equationequ.11
(11)
(11) and Equation12
(12)
(12) ) as:
Hence, the Wald statistics test for the joint hypothesis for the possible equation become;
Therefore, the null hypothesis is that does not Granger cause
in equation_11 and that Y does not Granger cause X in EquationEquation 12
(12)
(12) is an empirical issues and need to be tested.
4. Discussion and analysis
4.1. Descriptive analysis
Descriptive statistics depict that basic feature of the data. It represents the quantitative descriptions in a manageable form and provides simple summaries statistics about the nature of the data series. It differs from inferential statistics as descriptive statistics describe what is or what the data shows, while inferential statistics is used to reach conclusions that extend beyond the immediate data alone ().
Table 2. Descriptive statistics for dependent and independent variables
The mean value of RGDP at constant market prices was 518,350.3 in millions of Birr. The mean value of LAB (as proxied by population between the ages 15 and 64) was 33,985.41 million active peoples, while that of capital formation (proxied by ratio of gross capital formation to GDP) was found to be 0.9386 in millions of Birr. Likewise, the mean value of REER was 156.9 and, the mean values coffee exported from Ethiopia between the years 1980 and 2017 was reported as 4,167.57 in millions of Birr. In the same talk, the mean value of all other exports other than coffee (NCOFX) was found to be 8346.001 in millions of Birr, which is about two folds of the coffee export value for the same observation. Coffee export has been below its annual average from the year 1980–2007, while the sector witnessed an upsurge in export values in later periods including the reporting year (2017) were it dramatically increased above its mean value. This progress has been attributed to recent policy reforms that are put progressed by effort of current government in supporting and expanding share of export trade. Since, skewness is the measure of exodus from the regularity, the variables RGDP, COFX and NCOFX built in the analysis are found positively skewed, while LAB, CAP and REER are found virtually very smaller value and thus, normally distributed. Kurtosis is a measure of departures from normality and its normal distributions is 3. Yet, the Kurtosis of RGDP, COFX, NCOFX and REER is greater than 3, which is leptokurtic distribution. While the value of LAB and CAP is less than 3 showing Platykurtic distribution.
Ethiopia being the key producer and supplier of coffee to the world market produces about 51% of African coffee output (Yared, Citation2010). Ethiopia has earned 521.81 in millions of Birr on average from coffee exports annually between the years 1980–1990 and 5,652.88 Birr in millions between the years 1991–2017, showing an increased trends. The trends and structure of coffee exports measured at value of local currencies over the last 38 years are illustrated in .
Figure 1. Trends of COFX in Ethiopia, 1980–2017.
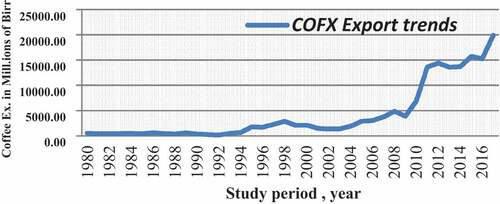
Two observations can be made from ; first, there was relatively lower growth of coffee exports between the years 1980 and 1991, and there has been a significant drop in the year 1992. This was perhaps related to the effect of structural break that was happened due to regime change; a way to market transition. However, the growth in the latter years (1993–2017) indicated that the values of coffee exports and its real value have been improved over time. These shows that earnings from coffee export now a day is 3–4 times higher than it was since 1980ʹs and even at the beginnings of 1990ʹs. In addition to the value of exports, the volume of export in metric ton was increasing from year to year. For instance, the average metric ton of exports in 1980ʹs was 87,231. This average has increased to 288,000 and 354,352 tons in 1990 and 2010, respectively. Now this figure reached to 441,000 metric ton in the year 2017 and still dependable source of foreign currency as well domestic labor force observation for Ethiopian economy.
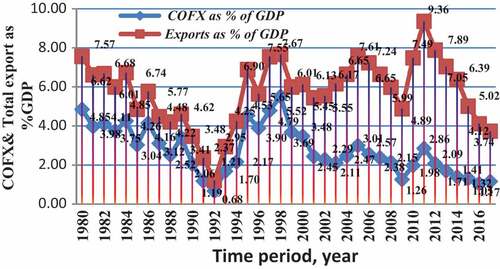
Besides, illustrates the trend for coffee exports as percentage of GDP as well as total exports as %GDP is fluctuating over time. Total exports as %GDP was lower (1.21%) in 1992, the year where exports was in its slump. While the highest (9.36%) exports as percentage of GDP was registered in 2011 though the climax of overall exports was recorded in 1993. Similarly, the share of coffee exports as %GDP was lower (0.68%) in 1992 with the highest 5.52% in 1998, where the average share of coffee exports over the study period was 2.78%, while that of overall export as %GDP was 5.78% over the study period (1980–2017).
Figure 2. Trends of coffee exports as percentage GDP, and total exports as percentage of GDP in Ethiopia, 1980–2017.
Econometric Analysis: In time series, econometrics different diagnostic tests have to be made prior to estimation. Thus, the actual determination of whether a variable is stationary or non-stationary is based upon the results of unit root tests. Numerous unit root tests have been presented in economic literature; the most common test, and the one which is utilized here, is the ADF and PP unit root test. The null hypothesis of unit root cannot be rejected even at 10% level for all variables as the critical values for ADF and PP are (−3.668) at 1%, (−2.966) at 5% and (−2.616) at 10% at level. This indicates that all variables are non-stationary or the series appeared to have unit root. So the null hypothesis that states the series has unit root cannot be rejected by ADF and PP. However, after applying the first difference on all the series, the variables appeared to be stationary I (1). This implies that the usual ADF and PP test statistic in the first differences for the data series were found significant even at 1% level of significance. Hence, this becomes a sufficient rationale to reject the null hypothesis that states the data has unit root. Therefore, it can be concluded that all the variables are integrated of order one I (1) and the test result is reported ( and ).
Table 3. Unit root test result at level form showing non stationarity of all variables
Table 4. Unit root test result at I(1) showing stationarity of all variables
Lag Length Determination: Optimal lag length in vector auto regressive model precedes the task of testing for co-integration among variables employed in the model. It is common that too many lags could increase the error in the estimate, while too few could leave out relevant information to be considered (Wooldridge, Citation2013).
However, an information criterion procedure helps to come up with a proper number of lag length that best suits the model under consideration. Thus, this study employed optimal lag length of three for the reason that most information criterion selected similar lag length. The result is reported in , showing the optimal lag length chosen by different information criteria in detail;
Table 5. Results of lag length selections using different criterion
4.2. Co-integration test result
There are many ways to study co-integration among variables. However, the most commonly used methods are Engle Granger two-step procedure developed by Engle and Granger (Citation1987), which is convenient mainly for single equation models and (Johansen, Citation1988) procedure frequently employed in multiple equation models and mostly applied in modern econometric analysis. For consistency, both test of co-integration procedures were applied and the null hypothesis that states there is no co-integration among the variables were rejected, in favor of its alternative.
Engle–Granger Two Step Test Result: First, run an OLS regression, and then predict the residual from the model and finally test for a unit root using the frequently used univariate unit root tests, say ADF and PP. Consequently, the tests were carried out, and the result is presented in .
Table 6. Unit root test for residual
The Johansen’s Co-Integration Test Result: According to ADF and PP test results piloted so far, for all the variables were found integrated of order one I (1), suggesting that they are candidates for inclusion in a long-run relationship for testing the number of co-integrating link. The result of testing the number of co-integrating vectors is illustrated for max statistic using .
Table 7. Johnson’s max test for co-integration rank test
As illustrated in , co-integartion rank test using Johansen’s Maximum Eigenvalue yields one co-integrating vector in the system at 5% level of significance. Convincingly, the evidence from both Engle Granger two-step and Johansen’s co-integration approaches suggested that there exist a long-run relationship among variables employed in the model. From co-integration test result, the variables labor force participation, capital formation(as proxied by ratio of gross capital formation to nominal GDP), coffee exports, non-coffee exports (all other exports other than coffee) as well as real effective exchange rate are the long-run determinants of economic growth in Ethiopia.
4.3. Long-run and short-run models
As one co-integrating equation is suggested by Johansen’s max statistic, the next step is estimating the model using VECM approach following Johansen’s method. Accordingly, long-run relationship among the variables is presented in . Furthermore, the long-run parameters were determined by applying the long-run model specified in Equationequ.6(6)
(6) .
Table 8. Long-run relationship between variables in the model and growth
The results from display that variables used in the model are found statistically significant in explaining long-run economic growth at 1% level of significance. The adjusted R squared is 74.43%. Implying 74.43 percent of the variation in RGDP (economic growth) is explained by the variation of the variables included in the model. From this, it can be said that there exist positively significant relationship between dependent variable, and explanatory variables.
4.4. Long-run impact of variables on economic growth
1. LAB and Economic Growth: The result from shows labor force (LLAB) were found positive and statistically highly significant in explaining long run in economic growth in Ethiopia as the coefficient of LLAB is 1.3122. The coefficient 1.3122 can be stated that, in the long run, an increase in labor force by 1% would result in 1.3122 percent increase in economic growth showing that growth is highly elastic to change in labor. The empirical result that is in fact confirmed by so many studies reviewed. Among others, the finding of Debel (Citation2002), Gilbert et al. (Citation2013), and Siaw et al. (Citation2018) in Ghana and Faridi (Citation2012) in Pakistan economy. Reviewed studies confirmed that an active labor force is one sources of growth in different countries, and in fact, this is true for Ethiopia as the finding of this study is consistent with economic theory.
2. CAP and Economic Growth: Capital formations were found positive and statistically highly significant in explaining long-run economic growth in Ethiopia. The coefficient of CAP was 0.0951 which implies that an increase in capital formation by a unit increases economic growth by 0.0951 percent keeping all other factors constant, and hence, capital formation is very essential for rapid growth. The result is in line with works of many authors among others, Gilbert et al. (Citation2013), Nyasulu (Citation2013), Ugochukwu and Chinyere (Citation2013), and Faridi (Citation2012) confirmed that capital formation had positive and significant impact on growth.
3. COFX and Economic Growth: The information in presents COFX has a positive and statistically significant impact on long-run economic growth. The coefficient of coffee export is positive 0.1450 telling that one percent increase in coffee export results in 0.1450 percent increase in economic growth. The findings of this study is consistent with the work of Gilbert et al. (Citation2013) and Tigist (Citation2015) examined the impact of agricultural export on economic growth recognized that export of coffee has positive and significant effect on long-run economic growth. To this end, the government has made a strong effort to motivate coffee sector recently. Among other measures, establishment Ethiopian Coffee and Tea Authority (ECTA) is the one. After its formation, structural adjustments were made in legal frame works, bottlenecks of the sector were identified to made coffee reforms. According to Yishak (Citation2009), the evidence tells that progress in the sector holds coffee to remain as a principal source of hard currencies needed to finance domestic growth.
4. NCOFX and Economic Growth: All other exports other than coffee were found positive and statistically significant in explaining the long-run growth in Ethiopia. The coefficient 0.1042 represents a one percent increase in NCOFX results in 0.1042 percent increase in economic growth. The sign of non-coffee export is similar with the prior expectation telling that it need to be inspired to finance holistic growth. The institutional setup that were in progress by government to inspire exports now a day is a good prospects to generate more hard currencies from exports apart from relying only on coffee. As a result, much progress has seen in overall exports and non-coffee exports. The findings is in line with the work of Tigist (Citation2015) that oilseeds export exerted a positive impact on economic growth in Ethiopia, that export of oilseeds products being one of non-coffee exports items for this study.
5. REER and Economic Growth: From the long run , REER were found positive and statistically highly significant in explaining long-run economic growth in Ethiopia. The coefficient of LREER which is 0.4782 is an indication that one percent increase in real effective exchange rates has the impetus of increasing the growth of Ethiopian economy by 0.4782 percent over the long-run. Suggesting that there is a need to shift structures of both production and trade towards goods with demand elastic and value added goods as the relations found is inelastic in this case. This empirical finding is in line with the work of Koirala (Citation2018), Uremadu and Onyele (Citation2016). The constant term in the estimates shows that holding all other variables constant, economic growth (as proxied by LRGDP) can be negatively influenced by −2.14 over long run. This can be explained in different ways and among other factors increase in populations keeping other things constant can again increase the cost of living in long run and creates reduction in economic growth.
4.5. Vector error correction model/VECM
It is found that there is a relationships among variables in the model, the likelihood of short-run relationship may be explored by employing the conventional error correction model (VECM). As this model permits the introduction of prior disequilibrium as explanatory variables in dynamic behavior of existing variables, and therefore, it is useful in capturing both short-run and long-run relationships. As the error correction coefficient has information about the speed of adjustment move toward its equilibrium trend after an exogenous shock, it should be negative indicating such adjustments. provides short-run dynamic link and set of short-run coefficients in VECM.
Table 9. Short-run coefficients from estimated VECM
From the short-run model presented in , it can be seen that error correction term (ECT), is negative, less than one, −0.48830 that is statistically significant at 1% level of significance and consistent with economic theory, and it shows the speed of adjustment as well as the indication for stable long-run relationship. The results revealed that in the short run, the deviation from long-run equilibrium is corrected at roughly 48.83% every year. Equally, LRGDP is estimated to roughly take an average of almost 2 years to return to its long-run equilibrium level following a shock in the system. The coefficient of 1 year lagged Value of
is 0.5920 and statistically significant in short run. The empirical finding of the study established a 1% increase in RGDP in lagged 1 year period will lead to a 0.592% increase in RGDP in the short run within the period of study. The coefficients of 1 year lagged value of DLLAB is negative (−1.6281) and statistically insignificant in explaining economic growth in short run. Although Ethiopia is highly populated country with higher labor force, labor force was found insignificant in short run. This might be due to higher unemployment as youths are not actively engaged in productive activities and the fact that unemployment is one of series challenges in Ethiopia now a day. Furthermore, the insignificant contradictory result is justifiable in developing countries because immobility of labor due to joint family, lack of self-improvement and shirk work among others.
The coefficients of 1 year lagged value of capital formation as proxied by the ratio of GCF to GDP were found negative and statistically significant at 10% level of significance in influencing economic growth in short run. The coefficient −0.0484 implies a unit increment in CAP in the lagged one year period can leads to 0.04842% reduction in RGDP in the short run. Equally, in short-run capital expenditure has not been able to spur the desired boost in growth in Ethiopia. This is because higher investment outlay in capital stock is current expenses and lessens real growth significantly, but capital outlay eventually repays back the cost and become a continuous source of financing long-run economic growth, and hence, it becomes positively significant.
The elasticity coefficients of 1 year lagged value of both exports (COFX and NCOFX) were found statistically insignificant in short-run growth for the periods considered. This can be justifiable in the way that; foreign earnings from exports (coffee and non-coffee) may not have been channeled to create the right kind of investments essential to inspire growth for the country. The other reason might emanate from time of delivering the products to its destination to some extent takes a time for instance, in case of coffee, while exports revenue is geared towards financing initial outlay for the first few years, and it cannot be the real source of growth for those few years in the case of non-coffee export say industrial products. Yet, when firms builds their capacity and starts to export in terms of both quality and quantity of products, then the earning will steadily exceeds its cost and can support growth in long run. Unlike the case of long-run results, the coefficient of REER is negative in short run, but insignificant. Inferring that changes made to real exchange rates can have insignificant impact, but growth becomes more reactive to change in real exchange rate in long run when importers build trust and confidence over time for export products. Finally, constant term in short-run model is 0.0125 implying that economy will improve by 0.0124% in short run under the assumption of ceteris paribus.
Granger Causality Test: the existence of stationarity and co-integration among variables suggests the existence of long-run causality among them at least in one direction. Usually, in multivariate analysis, causality test is done to check which variable causes another variable and this study used Granger causality test to find the direction of causation. This concept relates whether one variable can help to improve forecast of another. A variable Y is said to be caused by X if Y can be predicted better from past values of both Y and X than from past values of Y alone. Hence, causality tests are tests of forecast capacity in showing the extent at which one series contain information about the other, and this linkage can be independent, unidirectional or bi-directional. Consequently, Granger causality tests were employed to establish the direction of causation among explanatory variables (both control and interest variables) employed in the model and economic growth as proxied by RGDP. Accordingly, the result from Granger causality test is presented in .
Table 10. Long-run causality tests result sample period: 1980–2017
From , it can be recognized that, the null hypothesis that states LCOFX doesn’t granger causes LRGDP is rejected, similarly its counterpart that LRGDP doesn’t granger causes LCOFX is also rejected. Thus, the result provides information that there exists bidirectional causality running from growth to coffee exports and vice versa. In the case of LNCOFX, the null hypothesis that stats LNCOFX doesn’t granger LRGDP is rejected in favor of its alternative, while the null hypothesis that states LRGDP doesn’t granger causes LNCOFX is accepted. This tells that there is unidirectional causality running from non-coffee export to economic growth. For the causality running from labor force (LLAB) to economic growth (LRGDP), the null hypothesis is rejected showing that labor force expansion (LLAB) granger cause economic growth (LRGDP). While for causality running from economic growth (LRGDP) to labor force expansion (LLAB), the null hypothesis is accepted which means LRGDP doesn’t granger cause labor force expansion. For the case of capital formation to GDP ratio, causality running from economic growth (LRGDP) to capital formation was found bidirectional. Equally, bidirectional causality running from LRGDP to LREER and vice versa was discovered. Therefore, the null hypothesis is rejected for the cases of both CAP and REER measured in the model over long run.
VECM Post estimation Diagnostic tests: Diagnostics tests that are usually used in multivariate time series in general and VECM in particular includes serial correlation, normality tests, and stability of VEC estimate, specification test for co-integrating equations and heteroskedasticity test were all carried out and the model were good.
5. Conclusion and policy implication
5.1. Conclusion
The impact of coffee exports to the Ethiopian economy is insignificant in short run mainly for poor production, dalliance in ports, lower price. Yet, its impact is substantial in long run showing expansion of domestic production, value addition and price improvement will generate more export revenue. Capital formations were substantial to finance long term growth, though it reduces short term growth. Labor force has weighty effect in long-run growth, but in short run. The impact of non-coffee exports is insignificant in short run for control of agricultural exports that fetches lower price. Yet, it has generous over the long run due to more export diversification with value addition. In the same way, exchange rate appreciation is trivial in short run as it leads to loss of trade competitiveness.
Yet, appreciation is significant in long run as exports become expensive due to value addition, in favor of country’s imports. Theoretically, countries are expected to diversify their exports from reliance on few raw agricultural products to processed and semi processed industrial products as their economy grows. However, the finding of this study doesn’t support this theory. This is because increase in real GDP fails to cause increase in non-coffee exports in Ethiopia where there is bidirectional relationship between coffee export earnings and real GDP growth. This indicates that coffee still remains one of the dominant export crops of Ethiopia fetching its real GDP and vice versa. Thus, there is a need to uphold value of coffee exports to realize higher growth. Beyond coffee exports, refining labor productivity by continued training and education, addition to existing capital stocks and diversifying exports can bring a boost to economic growth in the long run.
5.2. Policy implication
To realize rapid economic growth in Ethiopia, emphasis has to be given on the following key issues based on the result of current study;
The Ethiopian government need to encourage local coffee industries to bring a real transformation in coffee sector as it is the major source of foreign currencies. To do this, these government institutions had better inspire small producers of coffee by providing the necessary incentives. Knowing this fact, part of tax revenue from coffee export has to be allocated for encouraging small producers in the sector.
Coffee industries in commercial farms need to be encouraged in producing, processing and exporting quality coffee to the world market with major highlights toward value addition than exporting raw coffee. Thus, coffee policy makers are advised to support continued investment in the industrial coffee fields by taking note on the impact of coffee exports on long-run economic growth.
The unidirectional causation between non-coffee exports and growth suggests that government need to promote diversification, which indicates export sector in addition to coffee has to be inspired.
As capital formation has positive impact in long-run growth in Ethiopia, increase in capital is one of the key to sustain growth. This can possibly be done especially by investment in land improvements, plant, machinery, road construction, railways, schools, hospitals, residential houses, commercial structures through its multiplier effect from outlay on stock of capital. Furthermore, attracting foreign and local investments to an economy, ensure investors’ confidence through continued macroeconomic stability, investor protection to ensure more growth.
Although highly significant in long run, labor force was found insignificant in short run. This might be due to higher unemployment as the youths’ are not actively engaged in productive activities, and little emphasis is given from the local government. As its impact to growth is quite bold in the long run, the government needs to consider this fact and need to convert labor force to more productive and effective labor that can generate rapid economic growth.
5.3. Directions for future research
In fact this work could not exhaust all specific components of exports as only coffee is selected from all others. Observing at the impact of other specific agricultural or non-agricultural exports other than coffee (observed in this study) on economic growth was not observed. Even within coffee exports, impact of exporting processed and unprocessed are not separately observed, and the limitation of this study.
Disclosure statement
No potential conflict of interest was reported by the author(s).
Additional information
Funding
Notes on contributors
Tesfaye Melaku Merra
Netsanet Gizaw Gibo is a full time lecturer and researcher in Economics Department at Mizan Tepi University, Ethiopia since 2017 to date. He is specialized in Development Economics. His areas of research interest are mainly macroeconomic issues such as impact of exports, impact of investment spending on growth and micro analysis of taxation its impact on local economy.
References
- Ashenafi, B. F., & Getaneh, B. T. (2014). Export trade incentives and export growth nexus: Evidence from Ethiopia. British Journal of Economics, Management and Trade, 4(1), 111–20. https://doi.org/10.9734/BJEMT/2014/5124
- Bakari, S., & Mabrouki, M. (2017). The effect of agricultural exports on economic growth in South-Eastern Europe: An empirical investigation using panel data.
- Dawson, P. J. (2005). Agricultural exports and growth in less developed countries. Agricultural Economics, 33(2), 145–152. https://doi.org/10.1111/j.1574-0862.2005.00358.x
- Debel, G. (2002). Exports and Economic Growth in Ethiopia; An Empirical investigation [ Msc. Thesis], Addis Ababa University.
- Dickey, D. A., & Fuller, W. A. (1979). Distribution of the estimators for autoregressive time series with a unit root. Journal of the American Statistical Association, 74(366a), 427–431.
- Engle, R. F., & Granger, C. W. (1987). Co-integration and error correction: Representation, estimation, and testing. Econometrica: Journal of the Econometric Society, 55(2), 251–276. https://doi.org/10.2307/1913236
- Faridi, M. Z. (2012). Contribution of agricultural exports to economic growth in Pakistan. Pakistan Journal of Commerce and Social Sciences (PJCSS), 6(1), 133–146.
- Gilbert, N. A., Linyong, S. G., & Divine, G. M. (2013). Impact of agricultural export on economic growth in Cameroon: Case of banana, coffee and cocoa. International Journal of Business and Management Review, 1(1), 44–71.
- Granger, C. W. (1969). Investigating causal relations by econometric models and cross-spectral methods. Econometrica: Journal of the Econometric Society, 37(3), 424–438. https://doi.org/10.2307/1912791
- Gujarati, D. N. (2004). Basic econometrics (4th ed.). The McGraw−Hill Companies.
- Habtamu, A. W. (2014). Assessing the opportunity and challenges of ethiopian commodity exchange for the members of agricultural product export. International Journal of Economics and Management Science, Debre Markos University
- Hameed, I., Iqbal, A., & Devi, K. (2012). Relationship between exports and economic growth of Pakistan. European Journal of Social Sciences, 32(3), 453–460.
- Johansen, S. (1988). Statistical analysis of co-integration vectors. Journal of Economic Dynamics and Control, 12(2–3), 231–254. https://doi.org/10.1016/0165-1889(88)90041-3
- Johansen, S., & Juselius, K. (1990). Maximum likelihood estimation and inference on co-integration_with applications to the demand for money. Oxford Bulletin of Economics and Statistics, 5(2), 169–210.
- Kifle, D., Moti, J., & Belaineh, L. (2017). Economic efficiency of smallholder farmers in maize production in Bako Tibe District, Ethiopia. Developing Country Studies, 7(2).
- Koirala, S. (2018). An analysis of the impact of real effective exchange rate on economic growth of Nepal. Pravaha, 24(1), 206–216. https://doi.org/10.3126/pravaha.v24i1.20239
- National Bank of Ethiopia. (2017). Annual report, Addis Ababa.
- Nyasulu, T. (2013). Impact of Exports and Imports on Economic Growth: A Case study of Malawi from 1970 to 2010 [ Unpublished Master’s thesis], University of Western Cape.
- Sanjuán‐López, A. I., & Dawson, P. J. (2010). Agricultural exports and economic growth in developing countries: A panel co-integration approach. Journal of Agricultural Economics, 61(3), 565–583. https://doi.org/10.1111/j.1477-9552.2010.00257.x
- Senait, G. (2014). The contribution of export earnings to economic growth of Ethiopia: a trend analysis [ Unpublished Master’s thesis], St. Mary’s University.
- Siaw, A., Jiang, Y., Pickson, R. B., & Dunya, R. (2018). Agricultural exports and economic growth: A disaggregated analysis for Ghana. Theoretical Economics Letters, 8(11), 2251. https://doi.org/10.4236/tel.2018.811147
- Solow, R. M. (1957). Technical change and the aggregate production function. The Review of Economics and Statistics, 39(3), 312–320. https://doi.org/10.2307/1926047
- Tigist, Y. (2015). Impact of agricultural exports on economic growth in Ethiopia: the case of coffee, oilseed and pulses (No. 634-2017-5864).
- Ugochukwu, U. S., & Chinyere, U. P. (2013). The impact of capital formation on the growth of Nigerian economy. Research Journal of Finance and Accounting, 4(9), 36–42.
- UNDP. (2015). www.et.undp.org, country profile, 2015
- Uremadu, S. O., & Onyele, K. O. (2016). The impact of selected agricultural exports on the growth of the domestic economy. Academia Journal of Agricultural Research, 4(5), 281–291.
- Verter, N., & Bečvářová, V. (2016). Impact of agricultural exports on economic growth in Nigeria. Acta Universitatis Agriculturaeet Silviculturae Mendelianae, 64(2), 691–700. https://doi.org/10.11118/actaun201664020691
- Wooldridge, J. M. (2013). Introductory econometrics: A modern approach (5th ed.). South-Western.
- Yared, B. (2010). The legal regime regulating coffee trade in Ethiopia. [ Unpublished Msc Thesis], Addis Ababa University.
- Yishak, T.(2009). Determinants of Ethiopian Export performance. Trade & Development Discussion paper 01/2009.
- Zelalem, T. (2011). Response of coffee supply to change in export price for washed and unwashed coffee of Ethiopia [ Unpublished Msc. Thesis], Adis Ababa University.