
 ?Mathematical formulae have been encoded as MathML and are displayed in this HTML version using MathJax in order to improve their display. Uncheck the box to turn MathJax off. This feature requires Javascript. Click on a formula to zoom.
Abstract
This study aims to analyze farmers’ willingness to contribute labor for the ongoing natural resource rehabilitation interventions in watershed development in East and West Belesa Districts, Amhara region. The aim of the study to assesses farmers’ intervention in natural resource rehabilitation activities and examines the mean willingness to pay family labor required for public watershed development activities from the two districts; a total of 501 households were selected by using a multistage sampling technique. The collected data were analyzed using a descriptive and econometrics model. In the econometric part, the mixed logit model is used to analyze the mean willingness to contribute to family labor. The descriptive result showed that farmers have to improve the watershed ecosystem service through soil and water conservation, area enclosure, forestation, and reforestation natural resource management intervention methods. The mean willingness to pay contribution results from the mixed logit, revealing that the sampled households are willing to contribute for livestock fodder availability 0.79 labors per month means Farmer’s Contribute 8 daily labors per months for watershed management activity for stabilizing spring water flow 0.80 labors per month, for reduced soil erosion 0.14 labors per month, and increase crop productivity 0.09 labors per month, respectively. The results important for policymakers and extension workers not to expect all farmers’ have homogeneous daily labor contribute to public watershed development activity.
PUBLIC INTEREST STATEMENT
Watersheds gives a diverse range of goods and services that are vital for the sustenance of human well-being, though their contribution to improve soil moisture and fertility, reduce soil erosion, and improve household income, honey production, and fruit and vegetable production improved food security status of farmers; hence, the farmers who participate in watershed management activity should base on their willingness to contribute, but the current watershed management interventions do not consider the willingness of farmers; due to this, the sustainability of watershed interventions is still an issue. Therefore, the authors are highly interested to recommend to policymakers and extension workers to not expect all farmers have homogeneous daily labor contribution toward public watershed development activity.
1. Introduction
The majority of African smallholder indigenous farming communities are heavily dependent on natural resources for their livelihoods like land, water, and forests. Harvested natural sources are estimated to provide more than a quarter of African rural household incomes (CBD, Citation2014). Low understanding of natural resources’ economic value has led to increasing unsustainable utilization of resources, resulting in environmental degradation and resource scarcity that threaten worldwide economic growth particularly in the agriculture sector (Najam et al., Citation2007).
Agriculture remains the backbone of the African economy more than other continents. The sector can primarily be affected by the degradation of natural resources, particularly true for sub-Saharan Africa, wherein agriculture is the primary contributor for more than one-third of the regional gross national product (GNP) and employing more than two-thirds of the labor force (Henao & Baanante, Citation2006). As a result, one of the essential policy issues of governments in those countries these days is to attain sustainable improvement that fulfills both economic and ecological targets (Girmay T., Citation2006). Sound policies and strategies are key contributors to the joint dreams of extended agricultural production, food security, economic improvement, and environmental protection. However, these policies cannot be successful if the local communities’ participation and preferences have given little emphasis.
Like most African countries, agriculture is the mainstay of the total GDP of Ethiopia. It generates approximately 41% of annual GDP and 80% of export earnings (MoEF, Citation2014). Given the significance contribution of agriculture in Ethiopia, the pressure has led to the expansion of agricultural activities, unsustainable consumption of fuel wood, and deforestation, alarming the problem of natural resource degradation, which creates famine and drought to stay as primary challenges of Ethiopian smallholder farmers (Lulseged et al., Citation2017).
Ethiopia is home to Africa’s largest livestock population and is the world’s 10th largest livestock production (MacDonald & Simon, Citation2011). The livestock sector makes up approximately 10% of the country’s foreign currency earnings (Lancaster, Citation2008). However, frequent and extensive droughts caused by deforestation within the country have a widespread effect on livestock because decreased rainfall shrinks available water resources and decreases the productivity of grassland and rangeland. In recent years, the principal causes of livestock deaths in Ethiopia have shortages of water and fodder during drought (IFAD, Citation2013). Therefore, sustainable natural resource management of watersheds in Ethiopia is crucial to sustaining livestock productivity so as to lessen the loss of ecological services and minimize habitat fragmentation within the biosphere (Dagninet et al., Citation2017).
Historically, Ethiopia has designed several important policies and strategies though it was not an end in itself. The top-down and rigid natural resource rehabilitation planning approach has ignored the local community preference and participation in which it mainly focuses on technical and physical work alone. Without given attention of socio-economic factors and lack of proper integration of introduced practices with indigenous knowledge has created less sense of ownership and responsibility for rehabilitated assets (Simeneh.D, Citation2015). This shows low understanding by policymakers and planners for farmers’ preference and participation in the watershed ecological service, leading to unsustainable development and reducing the potential for success. Currently, the United Nations conference on Combat Desertification (United Nations Convention to Combat Desertification (UNCCD, Citation2015) report released the necessity to integrate both scientific and local knowledge in the recent special mission. This may be made possible if the local communities are allowed to participate in the designing of natural resource conservation programs.
Recently, to overcome the problems of natural resource degradation, the government of Ethiopia has considerably achieved several rehabilitation programs supported by way of the world food program’s food-for-work scheme to also prevent soil erosion and other forms of environmental degradation. Soil and water conservation practices and the establishment of area enclosures have been the primary techniques promoted to manipulate land degradation and repair the natural flora and fauna (Fikru, Citation2009). Similarly, to put in force a 30-day countrywide SWC-based watershed management program on each communal land and farmland in long-age non-consultation of the affected population during the designing phase and the lack of more integral approach may lead to unsustainable development intervention, resulting in wastage of resource for maintenance and reduce the potential for success (BDNRMD, Citation2018). Several studies have shown farmers’ willingness to pay for the rehabilitation of degraded natural resources under watershed development in Ethiopia as well as other countries. There is some empirical evidence worldwide regarding ecosystem valuation, for example, (Bamlaku, Citation2016); (Yibeltal, Citation2015); (Birara, Citation2015); (Buhari et al., Citation2016) and (Abdrohman, Citation2014). However, the above researchers’ works focused on valuing willingness to pay rehabilitation degraded watershed using contingent valuation methods and this model did not show different ecosystem attributes. Therefore, the study of farmers’ willingness to pay for the rehabilitation of degraded natural resources under watershed development takes paramount importance in understanding the intention of the local community to ascertain the path of sustainable watershed development in Ethiopia. Besides, there is inadequate empirical evidence regarding farmers’ willingness to participate in natural resource rehabilitation by using the choice experimental model. Therefore, this study initiated toward narrowing this gap of knowledge.
2. Review-related literature
In investigating for willingness to participate in natural resource rehabilitation under watershed development through a choice, the model valuation approach in past studies used different econometrics models such as conditional logit model, mixed logit model, and random parameter logit model. For example, Abdulkarim et al., (Citation2017) used a choice experimental model to examine households’ preferences and willingness to pay for watershed service attributes in north slang swamp forest, Malaysia. A multinomial logit (MNL) model was developed to derive the marginal value and mean willingness to pay (WTP) of the respondents on the non-market values of the forest reserve and the results indicate that the inclusion of socioeconomic indicators such as income, education, gender, and age as attribute interactions into the model has a positive influence. The Watershed ecosystem of the sociodemographic attributes has been proved from the log-likelihood ratio of the model with the interaction has improved compared to the basic model. The mean willingness to pay (WTP) of the respondents on four different forest watershed attributes showed that improvement in water quantity is the most preferred watershed attribute.
Teshome .K. (Citation2016) used the choice model the valuing alternative resource management practices to improve eco-system services in the midland and lowland communities in Bale Eco-Region. Due to the presence of agro-ecological difference different attributes for classifying sample household midland and lowland were used; in addition, they used the mixed logit model. The model results show that for midland household reforestation attributes like payment level, biodiversity soil erosion, carbon storage, and non-timber production except biodiversity all other reforestation characteristics in the choice experiment are positively and significantly related to the probability of choosing an option.
For lowland household area enclosure attributes like payment level, biodiversity soil erosion, livestock feed, and water point except for the payment level, all other area enclosure characteristics in the choice experiment are positively and significantly related to the probability of choosing an option used for midland household soil and water intervention attributes like payment level, soil erosion, run-off sediments, and water flow and the soil and water conservation attributes like payment level, soil erosion, and water flow are positive and significant but run-off and sediments are negative and significant. The same soil and water conservation attributes ask for lowland, and the findings show that except for the payment level all attributes are positive and significant. The finding indicates different preferences of household for the ecosystem service in lowland midland households. The lowland community more prefers livestock fodder availability and the midland community prefers water flow stability. In addition to the willingness to pay reforestation program, the respondents are willing to pay 34.45, 32.62, and 31.59 ETB per year for improvement on soil erosion, CO2 storage, and non-timber forest product, respectively. For area enclosure intervention, the respondents are willing to pay 24.2, 16.60, 280, and 129 ETB per year to reduce soil erosion to improve biodiversity enrichment livestock feed availability and with watering pointsy.
Yang et al. (2015) used the choice model to examine Exploring Heterogeneous Preference for Farmland non-market Values in Wuhan, Central China. They used conditional logit model used to analyze the respondent’s willingness to pay for improvement in the public good, accounting for systematic heterogeneity in public preference. Accordingly, 219 individuals were surveyed using face-to-face interview. Three nonmonetary attributes and one cost attribute were identified with their respective levels for choice experimental designation. These attributes were landscape facility fertility and monetary attributes. The landscape attribute considered the service value of cultivated land with two levels. Its levels were current landscape and better amenity.
The watershed focused on whether government undertook some improvements, such as land field facilities like road and water irrigation systems. It was an attribute with two levels: current fertility and better fertility level. The monetary attribute considered monthly payment on each household and had four levels. Its levels were 0, 1.56, 3.12, and 7.81 each in US$.
For the choice experimental analysis two multinomial logit models were used, basic MNL model and extended MNL, i.e., multinomial logit model with attributes four socio-economic variables (education urban young income) and one knowledge variable were used as interaction variables with ASC in its indirect utility function. The results from both basic MNL model and extended MNL showed that the coefficients of all attributes and all socio-economic and knowledge variables as interaction with ASC were significant at 1% with priori expected signs. The coefficient with education young urban and income were positive and has implication of positive influence on improved cultivated land protection programs.
Vaiknoras et al. (2014) who conduct a study on Farmer Preferences for Attributes of Conservation Agriculture in Eastern Uganda used mixed logit model output indicate significant preference heterogeneity among respondents both randomly and systematically random taste variation exists in the region for total erosion decrease additional yield price, and ASC. The willingness to pay is calculated using both conditional and mixed logit models. The conditional logit to estimate WTP for total erosion decrease is the largest at Ush 127,968 or approximately $49. This was followed by additional yield at Ush 55,636 ($21), half erosion decrease at 24,617 ($9.50), and finally labor decrease at Ush 11,408 ($4.50) and the mixed logit results to estimate WTP for total erosion decrease is the largest, 139,325 Ush, additional yield at 55,584 Ush, half erosion decrease at 25,609 Ush, labor decrease at 8,119 Ush, respectively. These results show that the mean willingness to pay estimate is very similar between the two models.
Berhanu (Citation2012) examined the valuation of the Choke Mountain Range Wetland Ecosystem, East Gojjam, and Amhara Region, Ethiopia. They used the choice model with multinomial logit and random parameter logit models. The estimated result of the random parameter logit model revealed that the sign and significance of the level of the coefficients is similar to the result of multinomial logit models. However, there is a slight improvement in the magnitudes of coefficients for the attributes of biodiversity and recreational facilities. The inclusion of socioeconomic indicators such age, family size, sex of household, educational level income, and distance from wetland interact with wetland attributes and the results show that age of households, family size, educational level, and income were significant and positively affect the wetland improvement senior, while sex and distance from watershed negatively affect the wetland improvement senior. However, the mean willing to pay for improvement of water availability and recreational facilitate birr 155, birr and 36 annually. Moreover, the explanatory power of the random parameter logit model is better than that of the multinomial logit model.
Yibrie, A. (2011) examined the valuing of the economic benefits of ecotourism in semeian mountain, Ethiopia. They used the choice model with multinomial and random parameter logit models for the estimation of marginal willingness to pay. The results from the multinomial logit model indicate that there is no difference between the basic model and the extended model with regard to the coefficients of the attributes in their sign and magnitudes. The difference between the MNL model and the RPL model with respect to the magnitude and the sign of the coefficients of the attributes is small. All the attributes are significant in the RPL as in the MNL model. As compared to the previous models, the overall explanatory power of this model which is given by pseudo R2 is better. The pseudo R2 in this case is 0.3361 and 0.262, which are better than the respective values for the MNL model for foreign and local respondents, respectively.
In summary, the reviewed material on valuation techniques indicated that despite some of the limitations of CM, it is the widely applied method for valuation of non-marketed environmental goods and services. In addition, the reviews on the preference of ecosystem service in natural resource conservation indicated that the effect of agroecological, demographic, and socio economic factors were different in different areas. This indicates that in order to identify the factor cause preference of ecosystem service in different areas location and resource-specific research should be conducted. Besides, the review shows that the mixed logit choice model is more appropriate than the conditional logit model.
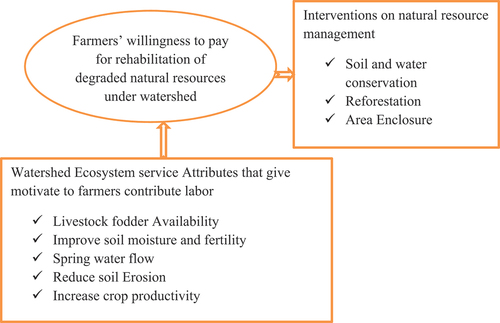
Figure 1. Conceptual framework for farmers’ willingness to pay for rehabilitation of degraded natural resources under watershed development. Source: Modified from Teshome (Citation2016).
3. Materials and methods
3.1. Description of the study area
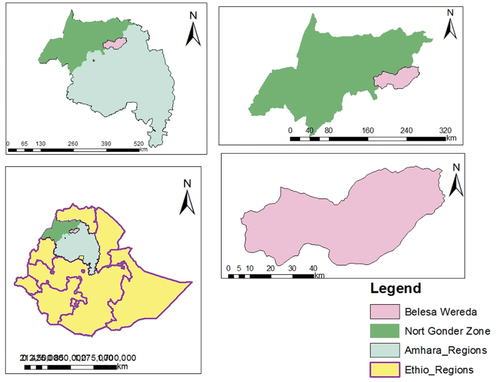
The study was conducted in West Belesa and East Belesa districts in North Gondar Zone of Amhara National Regional State, Ethiopia.
The West Belesa district is located at about 706 km North of Addis Ababa and about 82 km of Gondar town. It is bordered on the south with Libo Kemkem, on the west with Gondar Zuria, on the eastbyEast Belesa, and on the North with Wogera district. The district is found in the Tekeze lowland sorghum and goat livelihood zone. Its agro-ecology is predominantly Kolla, covering 59.8 %, followed by Woina Dega 38.7% and Dega 1.5%. The topography is mainly characterized by plateau with a share of 50%, mountains 40%, and hills 10% of the total land of the district. Its altitude ranges from 1100 to 2350 m above the sea level, while the annual temperature ranges between 130°C and 350°C. The mean annual rainfall ranges from 800 to 1200 mm based on CSA (2013).
It is largely covered with small vegetation of bushes and shrubs. The economy of the district is mixed farming largely participated in crop production followed by livestock rearing which has a special importance among wealthier farmers. This woreda has a total population of 142,791 of whom 72,829 are men and 69,962 women and 7666 or 5.4% are urban inhabitants. The majority of the population practiced Ethiopian Orthodox Christianity, with 97% reporting it as their religion, while 2.9% of the population were Muslim.
East Belesa is one of the woredas in the central Gondar zone. It is named after the former province of Belessa; it is bordered on the south by Debub Gondar Zone, on the west by West Belessa, on the northwest by the Wegere, on the north by Jan Amora, and on the East by Wag Hemra Zone. Towns in East Belessa include Gohala and Hamusit. The district is situated at an altitude ranging from 1496 to 2000 m above the sea level. About 90% of the district is desert (kola), with a minimal annual rainfall leading to frequent drought and famine. In spite of the climatic condition the people depend on agriculture and cultivate cereals like teff beans, sorghum, and wheat. Based on CSA, (2013), the woreda has a total population of 97,838, of whom 50,587 are men and 47,251 women and 13,057 or 13.4% are urban inhabitants. The majority of the inhabitants practiced Ethiopian Orthodox Christianity, with 98% reporting it as their religion, while 2% of the population said they were Muslim.
3.2. Data type, sample size, and sampling procedure
The study used primary data collected through focus group discussion (FGD) and individual interviews. Four FGDs were used in the four CARE intervention kebeles by involving 8–12 farmers of different ages, gender, and social groups. Through the FGD, using a checklist, participants discussed major watershed development structures and their drawbacks and benefits, their preferences and concerns regarding the ongoing watershed activity majors challenges encountered, and the type of agricultural technologies they would like to adopt on their farmyards. On the other hand, the primary data obtained through the choice experimental scenario and the demographical and socioeconomic characteristics of the sample households.
In this study, both qualitative and quantitative data were collected from primary and secondary sources. The main primary data were obtained from choice experiment scenario and it includes information on the demographical and socioeconomic characteristics of the households. The data that were collected from choice experimental scenario were quantitative, whereas qualitative data were collected from focus group discussion and key informant interviews.
The required sample size was calculated using the formula (Yemane, 1967) cited in Israel (1992), and the formula is given as follows:
, where, “n” is the sample size required, “N” is the total number of households with in project interventions’ kebeles from the two districts, and “e” is the level of sampling precision, which is assumed to be 5% in this study. The total population of the project interventions’ kebeles from the two districts is 43,715. Therefore, using the above formula, the sample size required from the district is calculated as follows:-
To gain a higher efficiency in our estimates, we decided to push the sample size from 396 to 501 households for the study.
A multistage sampling technique was used to select the sample respondents. The sampling technique involves three stages. In the first stage, two districts were selected by using purposive sampling from project interventions woredas. In the second stage, 20 kebeles (10 from West Belesa and 10 from East Belesa district) were obtained from project intervention kebele’s and then four sample kebeles (two from West Belesa and two from East Belesa district) were selected purposefully. The reason for the selection of these kebeles is based on their watershed accessibility and long year’s watershed intervention area. In the third stage, the numbers of all farm households from each selected sample kebele’s were listed. Finally, a total of 501-sample farm households of the study were selected using a simple random sampling technique from the four-sample kebele’s in a proportional-to-size of each kebele’s ().
Table 1. Number of sample households from East and West Belesa
3.3. Methods of data analysis
First, using descriptive statistics, the socioeconomic and demographic characteristics of the households were analyzed. The descriptive analysis is essential in providing better understanding of salient features of sample units. The statistics were mean, minimum and maximum values, frequencies, percentages, and graph for continuous and categorical variables.
3.4. Econometric analysis: choice experiment model specification
3.4.1. Random utility theory
This study was used choice experimental model to determine farmers’ valuations to improve grazing for livestock, increase soil moisture and fertility, stabilize water flow, control erosion, and increase productivity. Discrete choice modeling is theoretically based upon random utility theory (McFadden, Citation1974) and on Lancaster’s theory of characteristics (Lancaster, Citation1966). According to Lancaster, it is not goods themselves but the attributes or characteristics of goods that provide people with utility.
3.4.2. Random utility model estimation
Discrete choice models use random utility theory to estimate the probability that an alternative is chosen. This probability depends on the attributes of the alternative competing options and characteristics of each individual. The utility an individual obtains from object j can be shown as follows:
is the total latent, unobserved, utility obtained for the individual from object j and
is a vector of attributes that object j contains. These attributes can be observed and measured by the researcher, so they make up the systematic component of utility and
is a random error component that contains unobserved factors that influence utility. It takes into account that different individuals have difference preference strengths for different attributes (Train, Citation2009). Logit models assume that
is logistically distributed and is the independently and identically distributed (IId) extreme value. This means that the error term of each alternative is independent of the error terms of all other alternatives and that each error term is identically distributed.
Adamowicz et al., (Citation1998) outline how choice experiments relate to utility theory. Utility theory predicts that each individual will maximize her utility. When applied to consumer choice, this prediction means that a consumer will choose object j when the utility he/she gets from j is higher than the utility he/she obtains from other choices. When compared to a different object choice, i this means that he/she will choose option j over i when
where C is the set of all possible alternatives
It is important to note that in random utility models, the overall level of utility is irrelevant (Train, Citation2009).
3.5. Choice experiment (CE)
As cited in Teshome (Citation2016), CM is a recent innovation in stated preference techniques. The method finds its origins with Lancaster (1966), who proposed the idea that a ‘good‘ can be treated as the combination of a group of characteristics. The first applications of CM were in the fields of marketing and transportation research. Since then, CM has been applied in several other disciplines including in environmental and health economics (Louviere & Woodworth, Citation1983).
The CM technique is based on two fundamental building blocks of the characteristics theory of value and random utility theory (Lancaster, 1966); Lancaster’s theory of derived utility assumes that consumers’ utilities are defined over a bundle of attributes or characteristics of a purchased good or service. Thus, a visit to a national park could imply the consumption of attributes such as fresh air exercise, education, appreciation of nature, and observation of wildlife. A consumer will derive utility from these attributes as well as disutility from other attributes such as congestion and physical exertion. In addition, within a consumer choice framework price can be considered another attribute. By requesting consumer preference for distinct hypothetical packages featuring different levels of each attribute, including price welfare measures and values can be (Adamowicz et al., Citation1998).
In a CM application, respondents presented with a series of choice sets, each of them containing usually two or more alternative options. Then, respondents are asked to choose their preferred option from each choice set. The options in the choice set are described using the attributes, which take on various levels. The combinations of attribute levels for each option in each choice are established using experimental design techniques. Similar to a CVM, before the choice sets are presented to respondents, there is a description of the study site, the research issues, the proposed policy changes, and the implication for the environmental attributes that are being modeled.
4. Elicitation stages in the choice experiment method
Choice experiment modeling involves seven stages in order to estimate the value of the environmental resources or public goods and services. These are described below.
Stage one: Identification of attributes: In this stage attributes that are important for the valuation of the environmental resources are identified by using different mechanisms such as focus group interview from the literature or in consultation with environmental economists, ecologists, hydrologists, biologists, etc.
Stage two: Selection of the attribute level: the levels for the identified attributes including the level for the status quo are assigned in this stage with the help of experts, literature review, and survey. The levels of the attributes must satisfy the characteristics of reliability feasibility and they have to also elicit the range of respondent’s preference map.
Stage three: Experimental design selection D-optimal designs are one form of design provided by a computer algorithm. These types of computer-aided designs are particularly useful when classical designs do not apply. Unlike standard classical designs such as factorials and fractional factorials D-optimal, design matrices are usually not orthogonal and effect estimates are correlated. These types of designs are always an option, regardless of the type of model the experimenter wishes to fit (for example, first-order plus some interactions, full quadratic, cubic, etc.) or the objective specified for the experiment (for example, screening, response surface, etc.). D-optimal designs are straight optimizations based on a chosen optimality criterion and the model that will be fit. The optimality criterion used in generating D-optimal designs is one of maximizing |X’X|, the determinant of the information matrix X’X.
There are several design optimality criteria needed to do computer garnered design, such as D-optimality, A-optimality, and G-optimality. Among them, D-optimality is the most popular one and it is applied in this study. In general, modeling accuracy and goodness-of-fit can be statistically measured by a variance–covariance matrix V (b)
V (b) = δ2 (X′X)−1
where δ is the standard deviation, an accurate response surface model is obtained when minimizing. (X′X)−1 statistically, minimizing (X′X)−1 equivalent to maximize the determinant of (X′X). This criterion is to generate a design matrix with a maximized |X’X| from a set of candidate samples which can be defined by the D-optimality. The initial “D” stands for “determinant.” By using D-optimal design, the generalized variance of a predefined model is minimized, which means the “optimality” of a specific D-optimal design is model dependent. Unlike conventional designs, D-optimal designs are straight optimization and their matrices are generally not orthogonal with the effect estimates correlated by variables.
The D-optimality criterion is applied, which is the most popular optimality criteria used to design DCEs. The D-optimal choice designs for two-level attributes of any choice set size stem from the work of which was extended to apply to attributes with any number of levels. The D-optimality criterion seeks to maximize the determinant of the information matrix in an equation or to minimize its inverse, which is the determinant of the variance–covariance matrix of the parameter estimators. The D-optimality criterion considers the covariance. The D-criterion value is
, where the exponent 1/k can ensure the independence of the dimension k of the parameter vector b. Minimizing this value results in the D-optimal design.
Stage four: Choice set determination: the options that are determined in the above experimental design step are used to form choice sets. These choice sets can be constructed individually in groups or in pairs.
Stage five: Development of questionnaire and data collection: the primary data will be collected by using questionnaire. In addition to these, the size of the sample should be determined by taking in to account small sample size bias and financial as well as time constraints.
Stage six: Estimation: The collected data were estimated by using different estimation techniques like ordinary least square (OLS) and maximum likelihood (ML). Multinomial logit and random parameter logit models are the two commonly used models in choice experiment, valuation analysis.
Stage seven: Interpretation and analysis of the results and policy analysis: this is the last step where the estimated results are interpreted and alternative policies are recommended accordingly.
4.1. Mixed logit model
Multinomial logit models and conditional logit models have been the standard techniques for discrete choice data analysis . However, the results of these models have limited applicability due to the restrictiveness of their independence of irrelevant alternatives (IIA) assumption. One alternative model the mixed logit model relaxes the IIA assumption by modeling preference heterogeneity and used to estimate random utility models (Train, Citation2009).The mixed logit model, also known as the random parameter logit model, has a more flexible functional form than other logit models. It allows for heterogeneous preferences or random taste variation. Variables can be specified as having either fixed or random coefficients. The random coefficients allow for preference heterogeneity. It also allows for unrestricted substitution patterns relaxing the IIA assumption and correlation between unobserved factors over time (Train, Citation2009). The mixed logit model also accounts for the panel nature of choice data because it includes an individual specific error term that is correlated across the choices made by a particular individual . The model relaxes the IIA assumption by modeling preference heterogeneity and can be used to estimate random utility models (Train, Citation2009). The mixed logit model was used to study consumer preferences for cattle traits, animal welfare attributes, genetically modified foods, and many other ecosystem service valuation (Teshome, Citation2016 ; Vaiknoras, Citation2014).
We assume a sample of N respondents with the choice of J alternative on T choice occasions. The utility of that individual n drive from choosing alternative J on t occasions given by
where = vector individual specific coefficient,
= is a vector of observed attributes relating to individual n alternative J on t choice occasions and
is a random term which is assumed to be distributed IID extreme value. The density β denoted as
where θ are the parameters of the distributions. Conditional on knowing
, the probability of respondent’s n choosing alternative i on choice occasion t given by
which is the conditional logit formula (McFadden, Citation1974). The probability of observed sequence choice conditional on knowing is given by
where the alternative chosen by individual n on occasions t, the unconditional probability of the observed sequence of choice the conditional probability integrated over the distribution β;
The unconditional probability thus averages products of logit formula evaluated at different values of β with the average given by density f.
4.2. Farmer utility function
This study examines the utility that farmers derive from different attributes of watershed outcomes. Without including interaction terms, the farmer utility function is (see for definitions):
Table 2. Model variables
Table 3. An example of choice sets assuming that the following watershed attributes were your only choices, which one would you prefer plan
The mean willingness to contribute/pay in labor time can be evaluated from the coefficients of the mixed logit model. The common method for estimating WTP is to divide the attribute coefficient by the labor contribution coefficient. For mixed logit model, when labor is specified as fixed and other variables as fixed or random with normal distributions, WTP can be calculated in this manner. The main reason using labor as a payment methods. According to Dagninet et al. (Citation2017), the researchers used both cash and labor as a vehicle mechanism to determine for which contribution (cash or money) households are more willing and to examine their respective determinant factors. However, their results indicated that most of the respondents were willing to contribute to labor. The contribution family daily labors for watershed management ecosystem services per month. We proposed 7, 8, and 9.
4.3. Experimental design
After the important attributes and attribute levels were identified, the second step was the building of choice sets via experimental design. The grouping of different levels of attributes yields different alternative scenarios and then choice sets. In this study, six attributes are selected for watershed ecosystem services (grazing livestock feed availability, improving soil moisture availability, stabilizing water flow, reducing soil erosion, and increasing productivity and labor payment).
The numbers of watershed management scenarios that can get from for six attributes 4 with three levels and two with 2 levels were 256 (i.e. 43*22) it would be advantageous if all individuals could face possible attribute levels combinations according to their preferences. However, the main design issue is to maximize the efficiency of the survey to extract information from the respondents. Each answer to a choice set should provide additional information for the statistical model so that eventually the preferences for different levels of the attributes. A starting point is a full factorial design that contains all possible combinations of attribute levels that characterize the different alternative full factorial design is, in general, very large and not tractable in a choice experiment.
Thus, D-optimal design with 24 scenarios with 8 choice sets was created. For a meaningful study, it is usually not possible to administer such a large number of choice sets (Hanley et al., Citation2006). Hence, the choice sets are randomly assigned to three groups. Each respondent was given eight choice sets with three alternatives in each choice set, including the opt-out option. The survey started with a short introduction of the purpose and a description of the attributes, their levels, the choice tasks, and follow-up questions. Three statistical software packages were used in this study. The JMP statistical software (SAS extension) was used to design the combined attribute level scenarios of the experiment in the full factorial design.
5. Results and discussion
5.1. Samples’ sociodemographics
Selected socioeconomic and demographic characteristics of respondent households are reported in . Based on the results, the average age of the respondent was 43 years between a minimum 20 and a maximum of 86 years. Most of the respondents were male and they are literate, at least they can read and write. The mean annual income of the household was about ETB 7812 with a standard deviation of ETB 5947. A greater proportion of the respondent participated in environmental conservation practices.
Table 4. Summary statistics of explanatory variables
5.2. Interventions on natural resource management
Rehabilitation of degraded natural resources in Ethiopia has been implemented for a long period. In the study area, farmers have rehabilitated degraded watershed by using different intervention mechanisms like soil and water conservation planting tree and area enclosure. According to the finding of the survey results showed that the majority around 61.28% of respondents practices soil and water conservation measures on their land and communal land, respectively. This results in line with Bamlaku Ayenew et al. (2015); in their study Smallholder’s farmer’s willingness to pay for improved soil and water conservation in Abaro-Toga Watershed Ethiopia. Accordingly, 12.77% of the respondents practiced using reforestation measures on their own and communal land. In addition to this, around 6.59% of respondents use area enclosure measures on communal land only. Besides, this 2% of the respondents use forestation measures mostly to use communal land and the rest 17.2% of the respondents use more than one practice in both their land and communal land. From the focus group discussion, the area enclosure intervention mostly practices in West Belesa.
Figure 2. Interventions on natural resource management.Source: Computed from own survey data, (2019).
5.3. Estimation of mean willingness to labor contribution
The mixed logit model with interactions was found to be the best from the above explanations. Therefore, further analysis of econometrics involved only the MXL model with interactions. The average implicit labor contribution per month for the five attributes of the watershed ecosystem services are livestock fodder availability, increase soil moisture and fertility, stabilize spring water flow, reduce soil erosion, and increase crop productivity as shown in . Since labor contribution assumes a fixed parameter, this can be calculated using the install WTP command (SSC) in stata.
Own computed survey 2019.
The result indicates that respondents highly value stabilizing spring water flow and livestock fodder availability shown in the high mean willingness labor contribution per month for improving these attributes relative to the others (). The results give much sense pertinent to fact that the area is increasingly becoming vulnerable to drought and water scarcity from time to time. This result agrees with Abdulkarim et al. (Citation2017) and Berhanu (Citation2012). Besides, livestock fodder availability was found to be a highly valued watershed ecosystem services in Belesa as livestock rearing has become the major viable livelihood strategy to cope with the ever-changing climatic condition (Teshome, Citation2016).
Table 5. Estimation of mean willingness to labor contribution per month
To sum up, the model result shows that stabilized spring water flow and fodder availability are very important entry points in watershed development activities even as compared to the de facto watershed development objectives of enhancing crop productivity which is the usual primary goal of watershed development pursued by the government and nongovernment interventions. From the result, it was evident that local farmers less prefer interventions solely implemented to enhance soil moisture. This might be due to the absence of understanding by farmers on how moisture conservation is linked to their livelihood. Thus watershed development training would be effective in incorporating practical knowledge on how moisture conservation would enhance agricultural productivity both crop and livestock.
6. Conclusion and police implication
Currently, natural resource degradation is a global environmental problem. In the study district, natural resource degradation is a severe environmental problem for sustaining their livelihood activity. This deterioration of resources is directly or indirectly related to climatic change, food security, and poverty in the study area. The finding results show that the around 61.28% of the respondents managing the natural resource by using soil and water conservation practices for own and common land. Around 12.7% of the respondents use reforestation interventions in common land and 6.59% of the respondents use area enclosures mostly in communal land. Around 2% of the respondents use forestation interventions. In addition to this, 17.37% of respondents use more than one natural resource management activity. The mixed logit model was also used to analyze the mean farmer’s willingness to labor contribution for improving different watershed attributes like livestock fodder availability, stabilize spring water flow, reduce soil erosion, and increase crop productivity. The mean willingness to labor contribution of farmers per month for livestock grazing availability 0.79 labors per month, stabilizing spring water flow 0.80 labors per month, reduced soil erosion 0.14 labor per month, and increase crop productivity 0.09 labor per month, respectively. The mixed logit result indicates that the farmers have more interest to contribute family labor to improve stabilized spring water flow and livestock fodder availability are very important entry points in watershed development activities even as compared to the de facto watershed development objectives of enhancing crop productivity that is the usual primary goal of watershed development pursued by the government and nongovernment interventions. This finding indicates that for policymakers and other stockholders to get more labor contributions for watershed development endeavors the policymakers and extension workers should not expect all farmers to value these attributes of watershed improvement and to expect some farmers to be more willing to contribute to improving one watershed attribute benefit than others so, during interventions in watershed management activity take these things to consider in the account.
7. Areas for further research
The relation between improved agroecological status and ecosystem service willingness to accept (WTA) for improved ecosystem service production in the WTP study sites is essential. This study did not assess WTA and impact of pervious watershed intervention on change in ecological service improvement. It is recommended that these gaps are filled in future through assessment of sellers WTA for ecosystem services and impact of watershed interventions on change in ecological service improvement observed in this study. Further research is needed to understand the preference and willingness of farmers to participate in other watershed intervention areas for comparison and informed policy decision-making in future.
Acknowledgements
The authors like to express special and sincere gratitude to CARE, Ethiopia project for supporting them financially. Also, they like to thank CARE project staffs and development agents in East and West Belesa and woredas for their help in organizing local people during the survey work. They also thank respondents for their patience in providing all the necessary information for their study.
Disclosure statement
No potential conflict of interest was reported by the author(s).
Additional information
Funding
Notes on contributors

Yasin Ahmed
Yasin Ahmed was born in Assosa Woreda, Assosa Zone of Benishangul Regional State, in February 1992. He also attended his elementary, secondary and preparatory school education at Assosa Secondary and Preparatory High School in the Assosa zone. After completion of his high school education, he joined the Wollo University College of Agriculture and Veterinary Medicine (WU) in October 2012 and graduated with a BSc Degree in Agricultural Economics in 3 July 2014. Soon after his graduation, he was employed as an Assistant Lecturer at the Assosa University. After two years of experience, the author joined Bahir Dar University College of Agriculture and Environmental in October 2018 to pursue his MSc degree in Agricultural Economics in a regular program. After the accumulation of his master's degree, he joined the Assosa University College of Agriculture and Natural Resource as a Lecturer in the Department of Agricultural Economics.
References
- Lancaster. (1966). A to (s): J . Lancaster : The Journal of Political Economy, Vol . 74 , No . 2 (Apr ., 1966), pp . 132–17 Published by: The University of Chicago Press Stable URL: http://www.jstor.org/stable/182883.
- Abdrohman, E. (2014). Farmers’ willingness to pay for rehabilitation of degraded natural resources under watershed development in Ethiopia case study in Dejen Woreda. African Journal of Economic and Sustainable Development, 3(4), 273–287. https://doi.org/10.1504/AJESD.2014.065577
- Abdulkarim, B., Rusli, M., Makmom, A., & Radam, A. (2017). Using choice experimental model to examine households’ preferences and willingness to pay for watershed services attributes in north slang swamp forest Malaysia 5 (1) 98–109 doi:10.18488/journal.8/2017.5.1/8.1.98.109 .
- Adamowicz, W., Boxall, P., Williams, M., & Louviere, J. (1998). Stated preference approaches for measuring passive use values. Choice Experiments and Contingent Valuation.
- Dagninet Amare, Wolde Mekuria and Beyene Belay. (2017). Willingness and participation of local communities to manage communal grazing lands in the Lake Tana Biosphere, Ethiopia. Society and Natural Resources, 30(6): 674–689.
- Dagninet Amare, Wolde Mekuria, Tilaye T/wold, Beyene Belay, Akalu Teshome, Birru Yitaferu, Teshome, Tessema and Berhan. Tegegn. (2016). Perception of local community and the willingness to pay to restore church forests in Ethiopia. Journal of Forests, Tress and Livelihoods, 25 (3):173–86.
- Bamlaku, A. (2016). Smallholder farmer’s willingness to pay for improved soil and water conservation practice: A contingent valuation study in Abaro- Toga Watershed Ethiopia. American Journal of Business, Economics and Management, 3 (6), 432–441. 2015
- BDNRMD. (2018). Belesa Agriclutrale office un publish doucment.
- Berhanu, G., (2012). Valuation of Choke Mountain Range Wetland Ecosystem, East Gojjam Application of Choice Experiment Valuation Method. A Thesis Submitted to the Department of Economics
- Birara, E. (2015). Determinants of households’ willingness to pay for the conservation of church forests in northwestern Ethiopia: A contingent valuation study. https://doi.org/10.1080/23311843.2019.1570659
- Buhari Abdulkarim, Mohd Rusli, Ahmad Makmom and Alias Radam, (2016). Using choice experimental model to examine households' preferences and willingness to pay for watershed services attributes in north slang swamp forest Malaysia Asian Journal of Economic Modelling, Asian Economic and Social Society, vol. 5(1), pages 98-109.,
- CBD. (2014). Brighter green’s food policy and equity program policy papers and documentary videos on climate change and industrial animal agriculture in Brazil, China, Ethiopia, and India, along with additional resources on the globalization of factory farming, are available on Brighter Green’s website: www.brightergreen.org.
- Simeneh Demissie, (2015). Perception of Farmers toward Physical Soil and Water Conservation Structures in Wyebla Watershed, Northwest Ethiopia Academic Journal of Plant Sciences 7 (3): 34–40, 2015 ISSN IDOSI Publications, 2015 DOI: 10.5829/idosi.ajps.2015.7.3.12822
- Fikru, A. (2009). assessment of adoption behavior of soil and water conservation practices in the koga watershed, highlands of Ethiopia. A Thesis Presented to the Faculty of the Graduate School of Cornell University
- Henao, J., & Baanante, C. (2006). Agricultural production and soil nutrient mining in Africa: Implications for resource conservation and policy development.
- Hensheret al (2003). The mixed logit model;The stat pratctice
- IFAD. (2013). The importance of scaling up for agricultural and rural development and a success story from Peru. by Kevin Cleaver Associate Vice-President. Programmers International Fund for Agricultural Development Rome.
- Lancaster. 2008. A new approach to consumer theory author (s): Kelvin J. Lancaster source: The journal of political economy. Vol. 74 2 (April, 1966 132–157. The University of Chicago Press Stable URL. http://www.jstor.org/stable/182883
- Loulseged, M. and McCartney, M. 2000. Agriculture and livelihoods in Sub-Saharan Africa.
- Loulseged, M., & McCartney, M. (2000). Agriculture and livelihoods in Sub-Saharan Africa international water management institute.
- Louviere, J. J., & Woodworth, G. (1983). Design and analysis of stimulated consumer choice experiments or allocation experiments: An approach based on aggregate data. Journal of Marketing Research, 20(4), 350–367. https://doi.org/10.1177/002224378302000403
- MacDonald, & Simon, J. (2011). Climate food security & growth Ethiopia’s complex relationship with livestock policy brief. 3 Bright.
- McFadden. (1974). Conditional logit analysis of qualitative choice behaviour. In D. McFadden & P. Zarembka (Eds.), Frontiers in Econometrics. Academic Press.
- MoEF. (2014). Growth and transformation plan. 2010/11-2014/2015.
- Najam, A., Runnalls, D., & Halle, M. (2007). Environment and Globalisation. Five Propositions.
- Vaiknoras A Norton, Jeffrey Alwan and Kate, (2015).Study on Farmer Preferences for Attributes of Conservation Agriculture in Eastern Uganda. African Journal of Agricultural and Resource Economics, 101, 158–173.
- Pantuliano, & Wekesa. (2008). Change natural disaster and rural poverty in Ethiopia.
- Simeneh, D. (2016). Perception of farmers toward physical soil and water conservation structures in Wyebla Watershed. Northwest Ethiopia Journal of Environmental and Earth Policy 2224-3216(page),6 doi:10.5829/idosi.ajps.2015.7.3.12822 ( 2224-0948), 3
- Girmay Tesfay. 2006. Agriculture, resource management and institutions: A socioeconomic analysis of households in Tigray, Ethiopia. PhD Thesis, Wageningen University PhD Thesis
- Teshome, K. (2016). Valuing alternative resource management practices to improve eco-system services in the midland and lowland communities in Bale Eco-Region: Application of choice modeling addis ababa university school of graduate studies http://localhost:80/xmlui/handle/123456789/14974.
- Train. (2009). Discrete choice methods with simulation. Cambridge University Press.
- UNCCD (United Nations Convention to Combat Desertification). 2015. Combating desertification/land degradation and drought for poverty reduction and sustainable development: The contribution of science, technology, traditional knowledge and practices. In Committee on Science and Technology Fourth special session 9-12.United Nations.
- Yibeltal, W. (2015). Willingness to pay for watershed protection by domestic water users in Gondar town, Ethiopia. International Journal of Applied Research, 1(10), 475–484.
