
 ?Mathematical formulae have been encoded as MathML and are displayed in this HTML version using MathJax in order to improve their display. Uncheck the box to turn MathJax off. This feature requires Javascript. Click on a formula to zoom.
Abstract
This paper is the first study to examine the financial contagion from the U.S., Japanese and Chinese markets to Asian markets during the Global Financial Crisis (GFC) and Covid-19 Pandemic Crisis. We employ the DCC-EGARCH methodology and daily data of stock returns from 2005 to 2021 to estimate the time-varying correlations and the volatilities of stock markets. Our results show that the correlation between the U.S. and Japanese markets with emerging Asian ones is quite high, implying the interdependence between these markets. Furthermore, we find significant contagion effects from the U.S. equity market to markets in both advanced and emerging economies during the GFC. Nonetheless, during the Covid-19 pandemic, only 3 out of 10 Asian emerging markets had experienced the contagion from the U.S. Our findings also suggest that contagion effects are not strongly related to the level of global integration and Asian markets seem to be more affected by the contagion from Japan and China.
PUBLIC INTEREST STATEMENT
The Global Financial Crisis from 2007 to 2009, stemmed from the collapse of the subprime mortgage market in the U.S. market, had spread throughout the global financial system, including Asian markets. The Covid-19 pandemic crisis is different from the Global Financial Crisis as this event occurs beyond the economic reasons, but it exerts impacts all countries in the world. The international stock markets have become more interconnected and have experienced large fluctuations over time. It is worthwhile to re-evaluate on the effects of large financial markets, such as the U.S., Japan and China, on Asian markets in the significant periods, including the Global Financial Crisis and the Covid-19 Crisis
1. Introduction
Globalisation has played a crucial role in increasing cross-border trade and capital flows by easing the barriers, allowing markets to be integrated at a higher level (De Brouwer, Citation1999; Obadan, Citation2006). International stock markets, therefore, have become more interconnected and have experienced large fluctuations over time. The degree of market connection, especially related to risk-updated correlation, in terms of both positive and negative co-movements, is a critical input for many policy-making decisions, not only in managing but also in allocating investment portfolios. The financial integration theory indicates that the economic integration provides important potential benefits such as expanding investors’ chances for portfolio diversification and supply a potential for achieving higher abnormal returns (Agénor, Citation2003; Goetzmann et al., Citation2005). Therefore, the stock market integration has attracted a great deal of attention and generated the desire to answer the question of how different financial markets with different volatilities are related to each other. Our paper will examine the contagion effects among the U.S., Japan, China and other Asian emerging markets using DCC-EGARCH models during the GFC and the recent Covid-19 pandemic.
Contagion is defined as a significant increase in cross-market co-movement of asset returns (Dungey et al., Citation2004; Forbes & Rigobon, Citation2002). According to Forbes and Rigobon (Citation2002) and Celik (Citation2012), the co-movements between financial markets may arise from the contagion or interdependence among financial markets. The GFC (2007–2009) rapidly spreads across virtually all economies, resulting in sharp declines in the global stock markets, affecting both advanced and emerging markets. Meanwhile, at the beginning of the year 2020, the global Covid-19 Pandemic has induced a different and more severe contagion phenomenon. The regional financial crises, as well as the crises at the global level, have significantly changed the structure of international equity markets by increasing their interdependence. On the previous SARS outbreak in 2003, Bhuyan et al. (Citation2010) conclude that there was an increase in co-integrated relationship and dynamic co-movements in the stock markets of the countries affected during the SARS influenza outbreak. These cases show that dramatic movements in one stock market can have a powerful impact on markets of very different sizes and governance structure.
Recently, a higher level of integration among developed markets has reduced the benefits of portfolio diversification, resulting in investors switching to emerging markets to take advantage of diversification strategies. However, all emerging markets are not the same and present different risks and opportunities. For the past 30 years, emerging markets have provided return-enhancing and risk-diversifying opportunities for equity investors (MSCI, Citation2019). From the investors’ viewpoint, it is, hence, critical to evaluate the effect of the turmoil periods on the stock market, giving investors more choices in allocating their funds and allowing them better risk management of portfolios containing stocks from emerging markets.
As the world’s largest economy, accounting for almost 22% of global output and over a third of stock market capitalization (World Bank Group, Citation2017), any shocks in the U.S. market is expected to exert effects far beyond its shores. At the same time, as one of the massive investors and strategic trading partners of Asian nations, the Japanese market is more likely to influence the Asian markets (Nguyen et al., Citation2019). Among the developing countries, China has played a critical role in the world economy recently. Through its major economic role, China can be expected to impose spillovers for the rest of the world economy (World Bank Group, Citation2021). Therefore, it is significant to examine how the fluctuations on the stock market from the U.S., Japan and China may impact on Asian emerging stock markets.
Using data from 2005 to 2020, our results show that the correlation between the U.S. and Japanese markets with emerging Asian countries is quite high, implying the interdependence between these markets during the research period. However, we found that during the GFC, there is significant contagion effects from the U.S. equity market to those in both advanced and emerging economies. On the other hand, during the Covid-19 pandemic period, only 3 out of 10 Asian emerging markets had experienced contagion from the U.S. It is also noticed that Asian emerging markets seem to be more affected by the contagion effect from Japan and China over time. It is interesting to document an impressive increase in correlation between China and Asian countries.
Our paper contributes to the literature and practical implication in different ways. This is the first study that uses the DCC framework to model the dynamic correlation between any of the emerging markets and the markets of the U.S., Japan, and China; and re-perform the contagion test for financial markets during the GFC and Covid-19 pandemic. The multivariate GARCH may be an advanced technique that can depict a clear picture of the interdependence of financial markets, and the conditional correlations estimated by MGARCH are more relevant for the tests of contagion. Our findings suggest that it is important to consider the impacts of the U.S. market during the period of financial crisis. Also, the influences of the Japanese market on the Asian markets are significant not only in the GFC but also the Covid-19 pandemic period. Moreover, it should consider the significant roles of China in Asian markets. A higher level of financial integration enhances the financing of investment across markets, contributing to more dependence and co-movement across global stock markets and leading to dramatic increases in the degree of “contagion” across countries (Devereux & Yu, Citation2020; Schularick & Steger, Citation2010). Therefore, our paper hopes to provide some practical information for policymakers, portfolio managers and investors in making decisions regarding allocating and managing their investment portfolios. Given that the financial integration may offer investors more opportunities to invest in different markets, our findings may provide suggestions for investors to consider emerging stock markets as an idea to minimising their portfolio risks. Also, as developed markets have lower correlations in recent times with those in Asian emerging markets, it may recommend that investors can diversify their investment across developed and emerging Asian markets.
The rest of the paper is structured as follows. The second section provides a review of the literature about the stock market volatilities and correlations as well as the empirical tests for the financial contagion. Methodology is given in Section 3. The fourth section entails the data sources and discusses the empirical results of the study. The last section concludes the study.
2. Literature review
Because of its huge worldwide impact, the quest for reliable estimates on the contagion effects of COVID–19 pandemic has started to gain traction rapidly. Numerous studies have analysed the financial market movements giving special reference to the Covid-19 pandemic, in addition to research on the GFC, East Asian Financial Crisis 1997 and Mexican Peso-Devaluation 1994.
Corbet et al. (Citation2020) investigate the contagion effects associated with the Covid-19 pandemic between the main Chinese stock market and Bitcoin. Using hourly data from 11 March 2019 to 10 March 2020, strong relationships between markets are identified, which implies that in times of turmoil period these assets would not be able to serve as hedging instruments. Akhtaruzzaman et al. (Citation2021) also consider how financial contagion occurs for a sample of financial and nonfinancial firms between China and G7 countries during the novel virus crisis by VARMA (1,1) DCC-GARCH model. Using data of China and G7 countries, they find that listed firms across these countries experienced significant increase in conditional correlations between their stock returns, especially for financial firms. Employing DCC models, MdAkhtaruzzaman et al (Citation2021) examine the role of China and the U.S. in transmitting contagion to South Asia. They conclude that Chinese and U.S. financial firms created more spillovers than they received during the global financial crisis. Stoupos and Kiohos (Citation2021) also investigate the degree of stock market integration in the Eurozone after the end of 2010 debt-crisis using fractionally cointegrated vector autoregression (FCVAR) and the exponential realized GARCH model. The results confirm that the financial market integration within this area exists and is relatively strong among the core member-states.
Regarding the GFC, Dungey and Gajurel (Citation2014) examine the existence of contagion originating from the U.S. to four largest advanced (France, Germany, Japan and the UK) and four emerging markets (Brazil, China, India and Russia) during the GFC, using a latent factor model. They find significant contagion effects that were spread from the U.S. market to these markets, both advanced and emerging markets, whereas there is weaker evidence of contagion from the U.S. financial sector to the financial sector of other economies in the sample. Baur (Citation2012) estimates the spread of the GFC from the financial sector to the real economy by studying ten sectors in 25 major developed and emerging stock markets. Using weekly prices (Tuesday to Tuesday closing prices) between 23 October 1979 and 20 October 2009, this study indicates that the null hypothesis of no contagion is generally rejected in around 70% of all cases, implying strong contagion effects among aggregate stock markets and among financial sector stocks. However, the evidence for contagion among the sectors representing the real economy is mixed. Bekaert et al. (Citation2011) investigate the transmission of crises to country-industry equity portfolios in 55 countries during the GFC. By employing a three-factor asset pricing framework, they show evidence on systematic contagion from the U.S. market and the global financial market, but such effects were minimal; meanwhile, they discover strong evidence on domestic contagion. In addition, based on empirical results, they conclude that contagion was mostly domestic in nature and did not stem systematically from the U.S. or the global banking sector during the crisis period of 2007–2009. Using the long-term historical data 150 years of equity markets around the world, Goetzmann et al. (2005a) found that equity correlations across markets change dramatically over time. In this paper, the advantages of diversification strategy are attributed by the increasing number of global markets and a lower correlation across markets. The authors also confirm that there were considerable shifts in the structure of global correlations.
The most important work of financial contagion is arguably the study of Dungey et al. (Citation2004) which provides various approaches to test for contagion. These approaches consist of the correlation analysis by Forbes and Rigobon (Citation2002), the VAR approach of Favero and Giavazzi (Citation2002), the probability method of Eichengreen et al. (Citation1996), and the co-exceedance proposal of Bae et al. (Citation2003). Among those approaches, Forbes and Rigobon (Citation2002) use the information on all of the shocks in the crisis period to test for contagion, which tends to dominate the other approaches. Forbes and Rigobon (Citation2002) measure stock market co-movements of 28 stock markets and test for contagion effect during the East Asian 1997 crises, the Mexican 1994-peso collapse, and the U.S. 1987 stock market crash with the VAR-based strategy. They concluded during these three crises there was no contagion, only interdependence among these markets. Baig and Goldfajn (Citation1999) test whether there exists contagion in four markets (the equity, sovereign debt, interest rates and exchange rates) between Asian countries (Indonesia, Korea, Thailand, Malaysia, and the Philippines) during the Asian crisis. Comparing correlations between stable and turmoil periods, they present the evidence of contagion in the foreign debt markets. Furthermore, using dummy variables to capture the effects of own-country and cross-border news on these markets, they document the existence of cross-border contagion in two markets (the equity and currency markets). King and Wadhwani (Citation1990) also examine the existence of contagion between the U.S., U.K. and Japanese stock markets during the turmoil period in October 1987 by constructing a model in which contagion between markets occurs as the outcome of rational attempts to infer information from price changes in other markets. They find evidence in support of the existence of contagion. Furthermore, their empirical results document that an increase in volatility leads to an increase in the magnitude of coefficients.
In short, the relevant literature has mainly focused on the developed market and found a high level of interconnection among the developed markets. Moreover, Covid-19 pandemic recently have massively impacted on the world economy, considering the deepest since the end of World War II (Yeyati & Filippini, Citation2021). Hence, it is worth applying the DCC framework to model the dynamic correlation between any of the emerging markets and the markets of the U.S., Japan, and China and re-perform the contagion test for financial markets during the Covid-19 pandemic, which is then compared with the GFC.
3. Methodology
In this paper, we use the DCC-EGARCH with Student t-distribution to estimate the dynamic conditional correlations and use the method of Forbes and Rigobon (Citation2002) to test for financial contagions. Following the method of Forbes and Rigobon (Citation2002), the correlations are examined in 2 periods, which are pre-crisis and post-crisis periods, and t-tests are used to investigate if there are significant increases in the conditional correlations pursuing a financial crisis.
The analysis of Engle (Citation2002)’s DCC—GARCH model involves two steps: First, estimate the univariate GARCH model, and second, measure the conditional correlations varying over time.
The DCC-GARCH model Engle (Citation2002) is given below:
Where is conditional variance matrix,
,
is time-varying correlation matrix.
is the nxn diagonal matrix of the conditional standard deviations derived from the univariate GARCH(1,1) process. In this paper, E-GARCH(1,1) model proposed by Nelson (Citation1991) is used to capture the asymmetry in the sign of shocks.
where: α, β and are constant parameters. This model accounts for the leverage effect. It is expected that
<0, a negative return increases volatility by more than a positive return of the same magnitude, where
indicates the presence of a leverage effect. When
is positive, i.e. there is “good news”, the total contribution to the volatility of innovation is α(1 +
)|
|. Conversely, when
is negative, i.e. there is “bad news”. The total contribution to the volatility of innovation is α(1-
)|
|.
The parameters of have the same requirements as
, except that the conditional variances must be unity.
The dynamic correlation matrix is decomposed into:
Where: =
is the unconditional covariance matrix of the standardized errors
The conditions for the existence of the DCC are that all parameters are positive ( and the sum of the two is less than one:
.
is the diagonal matrix with the square root of the diagonal elements of
:
Hence, which is ijth the element of dynamic conditional correlation matrix, Rt is formally constructed as follows
rescales the elements in
to ensure
In addition, it is well documented that the financial data, particularly those recorded at daily or higher frequency, demonstrates a fat-tailed distribution, which cannot be fully modelled by the Normal distribution, which is the primary and key assumption of many econometric frameworks in finance. In our paper, a multivariate Student’s t-distribution is used to capture this special character of financial time series efficiently.
Using the variance–covariance estimates from this model, we calculate the cross-market correlation coefficients between these markets in the sample during the stable period, turmoil period, and full period.
Finally, we consider whether there is contagion between these markets in the sample during the global crisis and Covid-19 pandemic. Contagion is one of the definitions debated most in literature. In this paper, the definition of contagion is based on (Forbes & Rigobon, Citation2002), expresses a significant rise in the cross-market correlation during the crisis period. It means that if the correlation between two markets is moderated during stable periods and a shock to one market leads to a surge in market co-movement, contagion would be generated. In line with Forbes and Rigobon (Citation2002), we use t-tests to verify if there is a significant increase in any of these correlation coefficients during the turmoil period, which implies the contagion effect. The test hypotheses are:
H0: (No contagion)
H1: (Contagion)
where and ρt are the correlation during the full period and during the turmoil (high volatility) period, respectively. We also have ρs is the conditional correlation during the stable period. These conditional correlation coefficients are estimated by DCC model. The alternative hypothesis H1 implies a significant increase in the mean of the conditional correlation during a crisis period, meaning that contagion effect exists.
To confirm the started date of the crisis period for each event, the Chow test is used to test for the presence of a structural break at a period, which can be assumed to be known a priori. The Chow test statistic, which follows the F-distribution with and
degrees of freedom, is as follow
Where ,
,
are the sum of squared residuals from the combined data, pre-crisis and in-crisis periods, respectively.
are the number of observations in each group and
is the total number of parameters.
4. Data and summary statistics
4.1. Data
This study uses the data sample of some developed and Asian emerging countries including the U.S., Japan, China, India, Indonesia, Korea, Malaysia, Pakistan, the Philippines, Taiwan, Thailand, and Vietnam. We collected the daily data of stock markets for these countries from DataStream for the period from January 2005 to July 2021, with a total of 2,754 days of observations. The indices are converted to a daily rate of return as shown in (6),
Where ,
,
denote the daily log returns, measured by the daily adjusted closing price of each equity indices at time t and t-1, respectively.
Due to the different time zones among these markets in the sample, the other emerging markets close earlier than the U.S. market; hence, any shock occurring in the U.S. equity market at the time of day t will affect these Asian emerging markets at the time of day t + 1. The appropriate pairing is, therefore, time t for these emerging markets and time t-1 for the U.S. equity market.
According to official timelines given by BIS (Citation2009), the global financial crisis period is divided into two periods: the pre-crisis period is from 2 January 2005 to 31 August 2007 (before Quarter 3, 2007), whereas the in-crisis period is from 1 September 2007 to 31 December 2009. With Covid-19 pandemic period, the division timeline is based on the time when Covid-19 appeared in China: the pre-crisis period is from 1 January 2013 to 31 December 2019, whereas the in-crisis period is from 1 January 2020 to present 6 July 2021. To confirm the started date for the crisis period, the MSCI Emerging Markets Asia Index is used to proxy the Asian emerging markets return. According to MSCI 2022, the index captures large and mid-cap representations across Asian emerging markets countries and covers approximately 85% of the free float-adjusted market capitalization in each country. We then orthogonalize the Asian emerging market returns by regressing it on the U.S. and Japanese stock returns. At a known time, under the null hypothesis of no structural break, the Chow test rejects the null hypothesis and confirms the above started date for both events at the 5% significance level (see Appendix 1).
The plots for all these daily returns in our sample swing around a zero mean (see, figure ). The ARCH effect seems to exist in all-time series, implying that equity returns tend to vary over time.
Figure 1. The daily returns of stock indices.
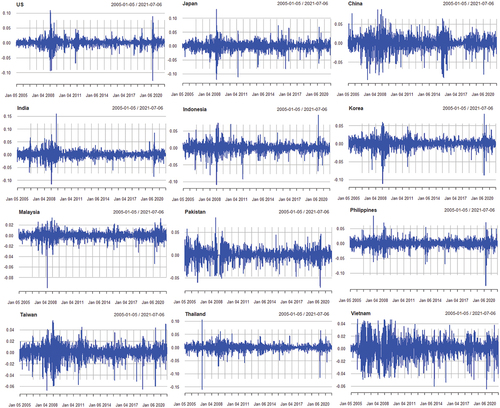
The phenomenon of volatility clustering, which means large swings tend to be followed by large changes and similarly for small changes tend to be followed by small changes, can be seen (see, figure ). In other words, it implies that the volatility is autocorrelated.
4.2. Summary statistics
Descriptive statistics for the daily stock index returns are presented in Table . Table shows that the average daily returns are positive in the full period from 2005 to 2021 but negligibly small in comparison with the standard deviation. The average return of the U.S. stock market (0.0006) is the highest among the selected countries. The average return of the Thailand and Malaysia stock markets are 0.0001 which are the lowest returns compared to those in other countries. In terms of the daily standard deviation, which represents the risk or volatility of the returns in the stock markets, we see that the standard deviation of the Chinese stock market returns is 0.017, being the highest volatility. In contrast, the Malaysian stock market returns has the lowest standard deviation (0.007) among the stock indices.
Table 1. Descriptive statistics of returns in the full period (from 1 January 2005 through 6 July 2021)
Regarding the third and fourth moments, all sample equity indices show similar statistical properties. More specifically, as the skewness of all the return series is negative, which is evident for the overall negative performance. Both the assets show evidence of fat tails, since the kurtosis is greater than 3, implying that the distribution of these returns has a thicker tail than the normal distribution. Therefore, the standard deviation of all markets implies that the “risk” is underestimated when kurtosis is higher and skewness is negative.
We check whether sample data have the skewness and kurtosis values that match those of a normal distribution through the Jarque–Bera test. As a rule, this test is applied before using methods of parametric statistics, which require normal distribution, such as GARCH models. The non-normal distribution of data is also supported via the Jarque–Bera statistics, which rejects the null hypothesis of normality at 1% significance level. This means the data in our study depart from normal distribution. In order to deal with this problem, Student’s-t distributions will be used.
Furthermore, the Ljung-Box (LB) Q statistics for these sample indices are highly significant at 5% level, implies the existence of serial correlations. In the last row of table, the p-values of ArchTest (for the Portmanteau Q and the Lagrange Multiplier test statistic) are all zero, confirming rejecting the “no ARCH” hypothesis.
Table provides information about the descriptive statistics in the period of the Global Financial Crisis. In the pre-crisis period, it can be clearly seen that mean returns of all markets are positive (except for Thailand). Regarding the daily standard deviation, the lowest level belongs to the U.S. and Japan, which are developed markets. The higher value in the standard deviation of the emerging markets suggests that such financial markets are more volatile than the developed markets.
Table 2. Descriptive statistics of returns before and during the GFC (from 01/01/2005 to 31/12/2009)
The GFC (from 2007 to 2009), stemmed from the collapse of the subprime mortgage market in the U.S. market, had spread throughout the global financial system, including emerging markets. Due to this major shock, 9 of the 10 emerging financial markets in our sample experienced a sharp decrease in mean levels with large negative returns (see, Table ). Specifically, Taiwanese and Korean markets had the lowest returns (−0.001 and −0.0012, respectively). Associated with decreasing returns, the risk in these financial markets, represented by standard deviations, also increased significantly in comparison with the relatively stable period (pre-crisis period). These features raise the question of whether there is a financial contagion during a crisis period from the U.S. to emerging financial markets. This will be discussed in section 4 with the estimates from the DCC-GARCH, which is used to test for a financial contagion.
It is noticeable that the selected indices have diversity in returns and volatility during Covid-19 pandemic period (see, Table ). India, Korea, Pakistan experienced a considerable increase in returns, whereas almost all remaining markets witness a dramatic decrease in returns. Four out of 10 emerging markets (Indonesia, Malaysia, the Philippines, Thailand) suffered negative returns. According to (Prasidya, Citation2020), in 2019, the foreign ownership within the Indonesian capital market was at 44.29% and domestic ownership accounted for 55.71%. Foreign investors also made up 36% of the total value traded on the Indonesian Stock Exchange, while domestic investors made up 64%. Amid the prolonged COVID-19 pandemic, the Indonesian stock market has endured a selling spree by foreign investors as unfavorable the global economic and political situations. There are about 20 trillion rupiah of foreign funds coming out of the Indonesian stock exchange throughout 2020, especially as a result of massive stock sales in the last 3 months. Another noteworthy statistic in this table is that all markets showed higher risk with a substantial increase in standard deviation level compared to the pre-period of Covid-19. Both skewness and kurtosis have the same features as the aforementioned analysis in the whole period.
Table 3. Descriptive statistics of returns before and during Covid-19 pandemic (from 01/01/2013 to 06/07/2020)
5. Empirical results
5.1. Primary correlation analysis
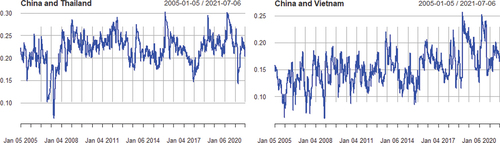
Based on the DCC model, we look further into the correlation among the markets in the U.S., Japan, China and each individual emerging market. plots the conditional correlations, extracted from DCC model, of each emerging market of the U.S., Japan and China. All emerging markets (except Vietnam and Pakistan for a few short periods in correlation with China) showed a positive correlation at different levels during the period from 2005 to 2021
Figure 2. Conditional Correlation among U.S, Japan, China and Asian Countries .
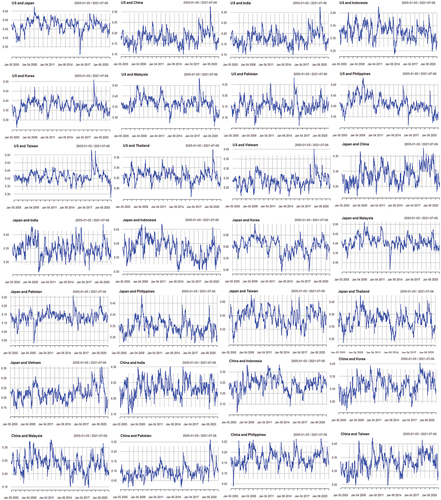
The estimated conditional correlation coefficients for the full period from 2005 to 2021 are shown in Table . Several patterns are immediately apparent. First, cross-market correlations during the full period are not surprising. The U.S. market is highly correlated with Japan and many of the East Asian economies (Indonesia, Korea, Malaysia, the Philippines, Taiwan), and much less correlated with China, Pakistan. Japan also obviously has a significant correlation with other emerging countries, and demonstrates particularly high correlations with Taiwan and Korea due to its role as the Asian central financial market. Even in the Covid-19 outbreak, the U.S and Japan continue to become the world-renowned international financial centers. The degree of correlation between China and other emerging markets in the GFC was relatively low, especially the correlation with Pakistan. However, the impacts of China on other emerging markets increase in the Covid-19 period.
Table 4. Conditional correlation coefficients (from 1 January 2005 to 6 July 2021)
Second, in one extreme example, among Asian emerging markets, Pakistan is the market with the lowest correlation with the U.S., Japanese, and Chinese markets. There is a significant increase in the correlation between China and Pakistan over time. The reason is that China has progressively considered Pakistan as the largest trading partner. Their commercial connection was established since January 1963, the year of the first bilateral trade agreement. The China’s Belt and Road Initiative project, which will be discussed later, has a substantial role in achieving this target. Thus, the relationship between China and Pakistan is not only limited to trade but in diplomacy and strategic partnerships as well (Irshad et al., Citation2015).
Third, the fact that cross-market correlations between China and most of the other countries in the sample significantly increased over time shows that China’s economic position has increasingly affected the remaining markets. This change is especially notable in the Taiwan and Vietnam markets, where the average correlation with Taiwan and Vietnam increased from 0.22 and 0.05 during the GFC period to 0.37 and 0.22 during the Covid-19 pandemic period, respectively. This is quite reasonable as China has recently implemented policies to manage Taiwan and Hong Kong more closely. Moreover, according to the Asian Banker Research, Japan and China have the largest the net International Investment Position (NIIP; Kazmi, Citation2020). Since the China’s Belt and Road Initiative has been first announced in 2013, the China financial market system has been continually developed, becoming a growing global influence (Voon & Xu, Citation2020). The Belt and Road Initiative aims to connect Asia, Africa, and Europe along five routes. The Initiative is motivated by China’s pressing economic concerns (Cai, Citation2016) and viewed as the Beijing’s effort to increase political dominance over the neighboring countries and to boost China has become the world’s fastest growing economic power with an average growth rate of 10% within 30 years (International Monetary Fund, Citation2013).
Notes: This table reports conditional cross-market correlation coefficients for the U.S., Japan, China and each country in the sample. The stable period includes 461 observations and is defined as January 2005 through 31 August 2007. The turmoil period includes 391 observations and is defined as 1 September 2007 through 31 December 2009. The test statistics are for one-sided t-tests examining if the cross-market correlation coefficient during the turmoil period is significantly greater than during the stable period. “C” indicates contagion existed as the test statistic exceeds the critical value. “N” indicates no contagion existed as the test statistic was smaller than the critical value
5.2. Testing the contagion effect between markets
The estimated conditional correlation coefficients for the stable, turmoil, and full period are shown in Table . The critical value for the t-test at the 5% level is 1.65, so any test statistic greater than this critical value indicates contagion, while any statistic less than or equal to this value indicates no contagion. Test statistics and results are reported on the right of the table. These tables provide and
which are the means of the estimated conditional correlations by the DCC model during the stable and turmoil periods, respectively, and the test statistic for the null hypothesis (no contagion) against the right-sided alternative one that has contagion. The standard deviations of the conditional correlations during the stable and turmoil periods are not equal to each other for each country, so the test statistic is given by the right-sided t-test with unequal variances. The statistics indicate that the null hypothesis of no contagion is rejected.
Table 5. The GFC period: conditional correlation coefficients
During the relatively stable period before the Global financial crisis occurred, cross-market correlations between the U.S., Japan and others are highly correlated, whereas China is much less correlated with all of the East Asian economies, especially with Pakistan and Vietnam at the negative level (−0.0057 and −0.0159, respectively). This is understandable because the U.S. and Japan are the two major global financial centers. Our results are consistent with the studies of Dungey and Gajurel (Citation2014), Xu and Gao (Citation2019), and Akhtaruzzaman et al. (Citation2021) but inconsistent with the finding of Bekaert et al. (Citation2011). Our findings, therefore, support the financial integration theory as the explanation under the mechanism of variation in the average correlation across markets (Goetzmann et al., Citation2005).
Until the major shock caused by the GFC, India and Indonesia were slightly affected with a small decrease in mean correlation, while the remaining countries were severely affected with significant increase in mean correlation. This pattern is similar with conditional correlation of Japan and China with other emerging markets. For the case of Pakistan, the mean of the conditional correlation dropped after the crisis, and this can be explained by the fact that Pakistan is an emerging market, which is less related to the U.S. and Japan during the period of financial crisis. It is a positive sign for the Pakistani and international investors to diversify their portfolio. We also cannot find evidence that there is contagion from the U.S. to India and Indonesia, though they are closely linked to the U.S. with a quite high correlation. Similarly, 8 out of 10 emerging markets were found to be subject to contagion from the Japanese market. To sum up, we find the evidence of contagion from China to all other emerging markets, and this showcases China’s increasingly influential role through the remarkable increase in the mean of correlation with others.
The Covid-19 disease was firstly discovered at the end of 2019 in China, can be classified a “black swan” event with three characteristics: Big impact, uncountable probability and surprising effect. The Covid-19 pandemic crisis is different from the GFC as this event occurs beyond the economic reasons, but it exerts impacts all countries in the world. Therefore, we re-evaluate the effects of the Covid-19 crisis on several financial markets to several countries (Table ). Our results demonstrate 4 out of 10 countries (namely Japan, China, Pakistan, Thailand) having the contagion in the Covid-19 pandemic from the U.S. markets at the 1% significance level. For example, in Table the difference in conditional correlation coefficients from the U.S. to Japan between stable and turmoil periods is 0.016 at the 1% significance level. It suggests that there may exist a contagion effect between the U.S. and Japanese stock markets. It is consistent with the findings of Ijiri and Jinushi (Citation2021) that the U.S. have significant spillover effects on Japan over time. The reason is that the U.S. accounts for almost 22% of global output and over a third of stock market capitalization (World Bank Group, Citation2017). Also, the U.S. government highlights that between the U.S. and Japan exist a strongly and deeply bilateral economic relationship and create investment flows and substantial trade (The U.S. Government’s Website).Footnote1 Therefore, any shock in the U.S. market may affect the Japanese market.
Table 6. The Covid-19 pandemic period: conditional correlation coefficients
Among other countries, notable point is during Covid-19 pandemic, the pairs formed with Japan and China has a small increase in conditional correlations, although they were also significant. In economic perspective, even though the pandemic first occurred in China, in the integrated world, as the largest economy, it is not surprising that any shocks in the U.S. stock market impact on the two economic powers, which are two major trading partners of the U.S. However, the reason for these tiny increases in conditional correlation is that, during the COVID-19 era, the economic policy in these countries response to the pandemic has been substantial and immediate to support their economies. The Japanese central bank has been conducting powerful monetary easing since March 2020 (Masayoshi, Citation2021). Japan’s financial system is likely to remain highly robust as financial institutions have improved their financial soundness after the GFC (Bank Of Japan, Citation2021). On 13th March, the Chinese central bank announced a reduction in the banks’ required reserve ratio. The Chinese government also announced a wide range of policy measures to support the economy (KPMG, Citation2020).
Other remaining markets also experienced high correlations with the U.S., but there was no significant increase during this crisis period. Meanwhile, Asian emerging countries are more affected by Japan and China over time with 8 out of 10 markets that have evidence of contagion from these markets. This result is also consistent with previous studies (Akhtaruzzaman et al., Citation2021; Nguyen et al., Citation2019; Xu & Gao, Citation2019). This can be explained by the following reasons. First, a program of economic policies, so-called Abenomics, was introduced by Japanese Prime Minister Shinzo Abe in 2013. The program was based on three pillars: Monetary easing, fiscal stimulus and structural reforms, in order to break the vicious cycle of low economic growth and deflation of the Japanese economy. Japan recently has promoted investment abroad, through development aid programs, in order to tighten ties with countries in the region and the world. In 2016, Prime Minister Shinzo Abe advocated the establishment of a “free and open Indo-Pacific” (FOIP). By establishing trans-border connectivity corridors, FOIP is designed to connect the Asian and African continents, as well as the Indian and Pacific Oceans. The overall focus of FOIP is on fostering maritime capacity-building and funding regional interconnectivity projects like the East-West Economic Corridor and the Maritime ASEAN Economic Corridor. Second, the evolution of market integration also contributes to explain the reason behind these phenomena. A higher level of financial integration nowadays enhances the financing of investment across markets, contributing to more dependence and co-movement across global stock markets and leading to dramatical increases in the degree of “contagion” across countries (Devereux & Yu, Citation2020; Schularick & Steger, Citation2010). Third, at the beginning of the 2020—the global Covid-19 pandemic period, the Japanese stock market experienced a significant drop by more than 20% drop, compared to the December 2019. This downward trend may contribute more to the noteworthy influences of Japan on Asian emerging markets.
Among emerging countries, Taiwan has the largest correlation with China with 37% in mean conditional level. This is also consistent with the above analysis as China increasingly establishes political policies aimed at managing Taiwan more closely. The reform programs and economic policies of Japan and China have contributed to increasing their influence over countries in the region and around the world. In an extreme example, Pakistan is the special case that the financial market was only severely hit by the Covid-19 crisis due to the spread of bad news from China (increased to 32.8% during the turmoil period from merely under 1% in pre-crisis period in the mean of conditional correlation).
In summary, the GFC appears to enable the U.S. market to have more impact on developed markets (Japan) and Asian emerging markets compared to the case of the Covid-19 pandemic, though the interdependence between the U.S. and others is still high in both two crisis events. Meanwhile, over time, Japan and China have remarkably increased their effect on other emerging markets.
6. Conclusion
Due to the integration of markets, the shocks originating in one market are more likely to be transmitted to other markets, increasing the risk of contagion. This study is to explain the short-run linkages of the emerging financial markets with the U.S., Japanese, and Chinese markets based on the pattern of the analysis of the contagion effects of the two most recent crises. The DCC model was applied to examine the volatilities and conditional correlations among emerging financial markets during the GFC and the Covid-19 pandemic period. The standardised multivariate t-distribution was used to capture the well-known heavy-tails associated with financial assets. The research sample comprises 10 emerging markets in Asia, the U.S. market and Japan. The DCC model allows us to perform the contagion test using t-tests. Our findings indicate that the U.S. and Japanese markets are highly correlated with Asian emerging markets over the entire study period from 2005 to 2021, and this suggests strong real linkages between the U.S. and Japanese markets with these markets. In terms of contagion, the results showed that the GFC from the U.S. badly hit almost all emerging markets, whereas during the Covid-19 pandemic crisis period, we found that the contagion was transmitted from the U.S. to only four markets (China, Japan, Pakistan, Thailand). Moreover, the research results also indicate a significant increase in this conditional correlation coefficient between China with other Asian markets. With the t-test results, it is clear that the contagion between China and remaining countries in Asia existed, implying the growing influence of the Chinese market on the rest of the region over time.
Our results may contribute to the literature and practical implications because of several practical reasons. First, the fundamental modern portfolio theory of Markowitz (Citation1952) and Grubel (Citation1968) suggests that investors find less integrated markets, being preferable for the purpose of diversification. Given that the internationalisation of financial markets offers chances for investors to access financial markets of different countries, our finding may be an important guidance for investors to consider emerging stock markets as the idea to minimising the volatility of their portfolio’s returns. Second, as mature markets have lower correlations in recent times with Asian markets, it can be rational for investors to choose to diversify their portfolios across developed and emerging Asian markets. Thirdly, the growth of China as a regional influencer, not only in terms of important trade partners but also as the financial hub in the region, has been validated in this study. Hence, it is also important for policymakers to understand the dynamic relationship of their domestic markets with its trading partner—China in order to take advantage of globalisation and boost the development of their financial markets.
Author’s statement
Thi Ngan Nguyen is a lecturer at the University of Economics and Law, Vietnam National University, Ho Chi Minh City, Vietnam, and PhD candidate at SGH Warsaw School of Economics, Poland. She is interested in researching modeling, valuation, financial markets, and banking sectors with publications in Vietnamese and international journals (including the Afro-Asian Journal of Finance and Accounting).
Thi Kieu Hoa Phan is a PhD candidate at RMIT, Australia. She is interested in fund management, equity fund evaluation, financial services, corporate finance, derivatives, dividend policy and financial markets. Her research work has been published in the Cogent of Economic & Finance and the Afro-Asian Journal of Finance and Accounting.
Dr Thanh Liem Nguyen is a lecturer at the University of Economics and Law, Vietnam National University, Ho Chi Minh City, Vietnam. His main research interests cover a wide range of topics, including corporate governance, bank and firm performance, and credit ratings. He has published in the International Journal of the Economics and Business, Pacific Accounting Review, Sustainability, Asia-Pacific Journal of Business Administration.
Acknowledgements
This research is funded by Vietnam National UniversityHo Chi Minh City (VNU-HCM) under grant number C2019-34-09. We are also thankful for the valued comments from Ms Ho Thi Hong Minh on the earlier draft and the participants of the International Conference for Young Researchers in Economics and Business (ICYREB 2021).
Disclosure statement
No potential conflict of interest was reported by the author(s).
Additional information
Funding
Notes
1. “In October 2019, the United States and Japan signed the U.S.-Japan Trade Agreement and the U.S.-Japan Digital Trade Agreement, which is scheduled to enter into force on 1 January 2020. The U.S.-Japan Trade agreement eliminates or reduces tariffs on approximately $7.2 billion in U.S. agricultural exports and the U.S.-Japan Digital Trade Agreement includes high-standard provisions that ensure data can be transferred across borders without restrictions, guarantee consumer privacy protections, promote adherence to common principles for addressing cyber security challenges, support effective use of encryption technologies, and boost digital trade … The United States’ goods trade deficit with Japan remains the third largest in the world” (The U.S. Government’s Website).
References
- Agénor, P. R. (2003). Benefits and costs of international financial integration: Theory and facts. World Economy, 26(8), 1089–20. https://doi.org/10.1111/1467-9701.00564
- Akhtaruzzaman, M., Boubaker, S., & Sensoy, A. (2021). Financial contagion during COVID–19 crisis. Finance Research Letters, 38, 101604. https://doi.org/10.1016/j.frl.2020.101604
- Anon. 2019. ValueWalk. https://www.valuewalk.com/2019/02/top-10-largest-stock-exchanges/
- Bae, K., Karolyi, G., & Stulz, R. (2003). A new approach to measuring financial contagion. The Review of Financial Studies, 16(3), 717–763. https://doi.org/10.1093/rfs/hhg012
- Baig, T., & Goldfajn, I. (1999). Financial market contagion in the Asian crisis. International Monetary Fund.
- Baur, D. G. (2012). Financial contagion and the real economy. Journal of Banking and Finance, 36(10), 2680–2692. https://doi.org/10.1016/j.jbankfin.2011.05.019
- Bekaert, G., Ehrmann, M., Fratzscher, M., & Mehl, A. J., 2011. Global crises and equity market contagion. Working Paper 17121, National Bureau of Economic Research.
- Bhuyan, R., Lin, E. C., & Ricci, P. F. (2010). Asian stock markets and the severe acute respiratory syndrome (SARS) epidemic: Implications for health risk management. International Journal of Environment and Health, 4(1), 40–56. https://doi.org/10.1504/IJENVH.2010.033033
- BIS. (2009). The International Financial Crisis: Timeline, Impact and Policy Responses in Asia and the Pacific, Bank for International Settlements.
- Cai, P., 2016. Why India Is Wary of China’s Silk Road Initiative. https://www.huffpost.com/entry/india-china-silk-road-initiative_b_11894038
- Celik, S. (2012). The more contagion effect on emerging markets: the evidence of DCC-GARCH model. Economic Modelling, 29(5), 1946–1959. https://doi.org/10.1016/j.econmod.2012.06.011
- Corbet, S., Larkin, C., & Lucey, B. (2020). The contagion effects of the COVID-19 pandemic: evidence from gold and cryptocurrencies. Financial Research Letters, 35, 101554. https://doi.org/10.1016/j.frl.2020.101554
- De Brouwer, G. (1999). Financial integration in East Asia. UK: Cambridge University Press.
- Devereux, M. B., & Yu, C. (2020). International financial integration and crisis contagion. The Review of Economic Studies, 87(3), 1174–1212. https://doi.org/10.1093/restud/rdz054
- Dungey, M., Fry, R., Gonza´Lez-Hermosillo, B., & Martin, V. L. (2004). Empirical modelling of contagion: a review of methodologies. Quantitative Finance, 04(78 9–24 doi:10.1080/14697680500142045).
- Dungey, M., & Gajurel, D. (2014). Equity market contagion during the global financial crisis: evidence from the world’s eight largest economies. Economic Systems, 38(2), 161–177. https://doi.org/10.1016/j.ecosys.2013.10.003
- Eichengreen, B., Rose, A., & Wyplosz, C., 1996. Contagious currency crises. NBER Working Paper, NationalBureau of Economic Research.
- Engle, R. (2002). Dynamic conditional correlation: A simple class of multivariate generalized autoregressive conditional heteroskedasticity models. Journal of Business and Economic Statistics, 20(3), 339–350. https://doi.org/10.1198/073500102288618487
- Favero, C., & Giavazzi, F. (2002). Is the international propagation of financial shocks non-linear? evidence from the ERM. Journal of International Economics, 57(1), 231–246. https://doi.org/10.1016/S0022-1996(01)00139-8
- Forbes, K. J., & Rigobon, R. (2002). No contagion, only interdependence: measuring stock market comovements. Journal of Finance, 57(5), 2223–2261. https://doi.org/10.1111/0022-1082.00494
- Goetzmann, W. N., Li, L., & Rouwenhorst, K. G. (2005). Long‐term global market correlations. The Journal of Business, 78(1), 1–38. https://doi.org/10.1086/426518
- Grubel, H. G. (1968). Internationally diversified portfolios: welfare gains and capital flows. The American Economic Review, 58(5), 1299–1314 https://www-jstor-org/stable/1814029.
- Ijiri, H., & Jinushi, T. (2021). International spillover effects of quantitative easing policy: a case study on the US and Japan. Applied Economics Letters, 1–5. https://doi.org/10.1080/13504851.2021.1907279
- International Monetary Fund, 2013. Report for selected countries and subjects.:
- Irshad, M. S., Xin, Q., & Arshad, H. (2015). One belt and one road: does China-Pakistan economic corridor benefit for Pakistan’s economy? Journal of Economics and Sustainable Development, 6(24), 200–207 https://papers.ssrn.com/sol3/papers.cfm?abstract_id=2710352.
- Kazmi, M., 2020. https://www.theasianbanker.com/updates-and-articles/weakening-us-net-international-investment-position-and-its-implications-for-holders-of-us-assets
- King, M., & Wadhwani, S. (1990). Transmission of volatility between stock markets. Review of Financial Studies, 3(1), 5–33. https://doi.org/10.1093/rfs/3.1.5
- KPMG. (2020). China: Government and institution measures in response to COVID-19. s.n.
- Markowitz, H. (1952). Portfolio Selection. The Journal of Finance, 7(1), 77–91 https://www.jstor.org/stable/2975974.
- Masayoshi, A. (2021). Monetary Policy during and after the COVID-19 Era. Deputy Governor of the Bank of Japan.
- MdAkhtaruzzaman, WaleedAbdel-Qader, HelmiHammami, & SyedShams. (2021). Is China a source of financial contagion? Finance Research Letters, 38 doi:10.1016/j.frl.2019.101393.
- MSCI. (2019). The future of emerging markets: 30 years on from the launch of the MSCI emerging markets index.
- Nelson, D. B. (1991). Conditional Heteroskedasticity in asset returns: a new approach. Econometrica, 59(2), 347–370. https://doi.org/10.2307/2938260
- Nguyen, T. N., Phan, T. K. H., & Parikh, N. (2019). The equity market returns and volatility spillover from the U.S and Japanese market to Asian frontier markets. Afro-Asian J. Finance and Accounting https://www.inderscience.com/info/ingeneral/forthcoming.php?jcode=aajfa. (Forthcoming).
- Obadan, M. I. (2006). Globalization of finance and the challenge of national financial sector development. Journal of Asian Economics, 17(2), 316–332. https://doi.org/10.1016/j.asieco.2005.11.002
- Of Japan, B., 2021. Financial System Report (April 2021).: s.n.
- Prasidya, Y., 2020. Foreign investor selling spree to continue until year-end: analysts, https://www.thejakartapost.com/news/2020/09/07/foreign-investor-selling-spree-to-continue-until-year-end-analysts.html:s.n
- Schularick, M., & Steger, T. M. (2010). Financial integration, investment, and economic growth. evidence from two eras of financial globalization. The Review of Economics and Statistics, 92(4), 756–768. https://doi.org/10.1162/REST_a_00027
- Stoupos, N., & Kiohos, A. (2021). Euro area stock markets integration: empirical evidence after the end of 2010 debt crisis. Finance Research Letters, 102423. https://doi.org/10.1016/j.frl.2021.102423
- Voon, J. P., & Xu, X. (2020). Impact of the belt and road initiative on China’s soft power: Preliminary evidence. Asia-Pacific Journal of Accounting & Economics, 27(1), 120–131. https://doi.org/10.1080/16081625.2020.1686841
- World Bank Group. (2017). The global role of the U.S. Economy Linkages, Policies and Spillovers, S.l.: World Bank 7962 https://openknowledge.worldbank.org/bitstream/handle/10986/26021/WPS7962.pdf?sequence=1&isAllowed=y .
- World Bank Group. (2021). Beyond the recovery charting a green and inclusive growth path, s.l.: World Bank https://openknowledge.worldbank.org/handle/10986/35897.
- Xu, G., & Gao, W. (2019). Financial risk contagion in stock markets: causality and measurement aspects. Sustainability, 11(5), 1402. https://doi.org/10.3390/su11051402
- Yeyati, E. L., & Filippini, F. (2021). Social and economic impact of COVID-19, s.l. Brookings Global 158 https://www.brookings.edu/wp-content/uploads/2021/06/Social-and-economic-impact-COVID.pdf