
 ?Mathematical formulae have been encoded as MathML and are displayed in this HTML version using MathJax in order to improve their display. Uncheck the box to turn MathJax off. This feature requires Javascript. Click on a formula to zoom.
Abstract
This paper empirically examines the quantitative relationship between financial inclusion and inclusive growth in sub-Saharan Africa using a panel of 46 countries for the period 2004–2018. The evidence suggests that usage of financial services, among other covariates, has a quantifiable and discernible impact on inclusive growth compared with availability and knowledge of financial services. Precisely, a unit increase in the usage of financial products and services improves inclusive growth by 0.03 units in sub-Saharan Africa. The paper contributes to literature by initially constructing a broader index of inclusive growth and subsequently estimating the separate quantitative effects of three categories of financial inclusion indicators on inclusive growth by employing the Arellano–Bover/Blundell–Bond system Generalized Method of Moment estimator. The findings underscore the need for policymakers to develop innovative, sustainable and inclusive financial systems capable of distributing growth benefits equitably. This can be achieved through moderate lending rates and transaction charges, improved access to retail and corporate loans, mortgages, overdrafts, credit cards, letters of credits and user-friendly financial technologies.
PUBLIC INTEREST STATEMENT
The World Bank Group theorized that financial inclusion is a catalyst to achieving some of the Sustainable Development Goals (SDGs). Moreover, empirical evidences also suggest that broader adoption and usage of financial services reduces poverty and income inequality, supports the growth of businesses and has implications for monetary policy effectiveness and financial stability.
It is against this background that monetary policymakers in developing economies have gradually taken steps to eliminate some of the barriers to accessing financial services in order to address the socio-economic consequences of widespread involuntary financial exclusion.
Consequently, we investigated whether knowledge, available and usage of financial services by various economic agents promote inclusive growth in Sub-Saharan Africa. The evidence suggest that the extent of usage of financial services matters more than knowledge and availability in promoting inclusive growth. It is recommended that, policymakers and financial institutions collaborate to progressively develop innovative, sustainable and inclusive financial systems.
1. Introduction
In spite of extensive progress made by banks, microfinances, savings and loans institutions, credit unions and cooperative societies in extending financial services to marginalized groups, majority of the world’s adult population, nearly 2.5 billion, are excluded from formal financial services (Hannig & Jansen, Citation2010). The United Nations Secretary-General’s Special Advocate’s (Citation2013) for inclusive finance for development stated that more than 200 million small- and medium-sized businesses in emerging economies have no access to finance, thus limiting their competitiveness and ability to thrive. World Bank (Citation2014) distinguishes between two forms of financial exclusion. First, voluntary exclusion arising from economic agents’ decision not to use financial services either because they have no immediate need for them or due to cultural and religious beliefs. Others also cite inadequate household incomes, commuter distances from financial service providers, cumbersome documentations and market failures and imperfections associated with the free market as reasons for their involuntary exclusion (Park & Mercado, Citation2015).
Although Financial Technology (Fintech) is eliminating some of these barriers, there still remains much to be done to ensure access to these services by the poor and marginalized. Thus, financial policymakers and development partners are increasingly being preoccupied with formulation of appropriate financial inclusive policies to integrate the unbanked population into the formal financial system in order to address the consequences of widespread involuntary exclusion—exposure of the poor to usurious moneylenders, inability of the poor to improve earnings, protect themselves in times of crisis and to build for the future. Financial inclusion is when “individuals and businesses have access to useful and affordable financial products and services that meet their needs—transactions, payments, savings, credit and insurance, delivered in a responsible and sustainable way” (World Bank, Citation2018, para. 1).
Financial policy reforms in most emerging economies within the last four decades evolved from financially repressed systems into liberalized ones. In Sub-Saharan Africa (SSA), the reforms of the 1980s were simultaneously targeted at increasing financial depth and stabilizing macroeconomic indicators—economic growth, inflation, exchange rate and financial stability, with limited emphasis on access and utilization of wide range of financial services. The direct credit control which characterized this financial regime involved channeling of funds to target groups especially farmers and small-scale businesses with explicit directive on the scope of usage of these funds (Hannig & Jansen, Citation2010). The rationale was to grant the rural poor access to cheap loans which were to be financed by pooling cheap deposits from surplus spending households. However, the regulatory ceiling on deposit rates below market-determined rates undermined financial resource mobilization. The consequences of this policy approach were poor financial performance and marginal improvements in outreach of financial services to rural areas.
For the post 1980 reforms, banks and other institutions freely allocated scarce financial resources to parastatals and private corporate sector with little influence from the state and monetary authorities. Development banks which were the vehicles of the controlled credit regime were converted to regular banks whilst publicly owned ones were also privatized. This market-led regime also operationalized interest rate movements, allowing for financial innovation and expansion of financial services (Ghosh, Citation2005).
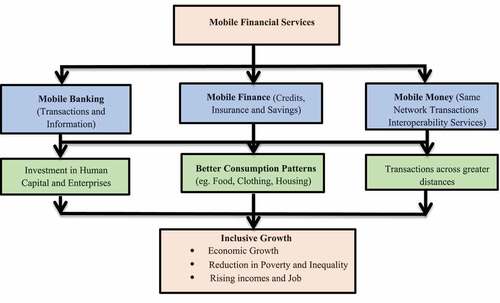
In recent times, Fintech is changing how people bank and transact businesses. In a world where time is of much essence, mobile financial services have expedited financial transactions and made them convenient for all manner of persons. People are able to perform transactions on their mobile phones without necessarily visiting their physical banks’ branches. A variant of mobile financial services popularly known as “Mobile Money” recently emerged in SSA. Patronage of this medium as an effective means of providing financial services to a varied group of people is on the ascendancy because the proportion of adult population that continue to subscribe to the services of mobile telecommunication networks is skyrocketing. Unlike other mobile financial services that use mobile phone applications and often require Internet connectivity, this alternative service only requires a client to have a registered Subscriber Identity Module (SIM) connected to a particular telecommunication network. The flexibility and convenience of this platform is that SIM numbers serve as account numbers. This platform supports all mobile phone specifications and does not require any Internet connectivity. Expectations are that, aside eliminating the barriers to financial inclusion, mobile money services also increase efficiency and lower transaction costs, create new job opportunities and offer opportunities for inclusive growth. figure summarily describes the current state of mobile financial services in SSA and how it contributes to inclusive growth.
Figure 1. Mobile financial services and inclusive growth nexus.Source: Authors’ own illustration
Additionally, financial institutions are reaching out to clients through a series of innovative media such as Automated Teller Machines (ATMs), Point of Sale Terminals (POS) and other tellers that take banking to remote areas. Other innovations also include electronic opening of bank accounts and prompt receipt of signed bank statements via mobile phone applications.
Growth of most economies is unevenly distributed with large cities and construction industry enjoying large proportions of the country’s wealth at the expense of agriculture and rural development. The recognition given to inclusive growth in recent times stem from the assertion that economic growth must be increasingly pro-poor and accompanied by improved productivity and new employment opportunities (Alexander, Citation2015). Thus, it is imperative to pursue beyond growth-first agenda in order to achieve inclusive growth. A comprehensive and robust policy action will be to complement economic growth policies with those that create equal opportunities for all and an enabling environment for the excluded. It involves designing policies to include economic agents whose contributions are inevitable to the growth process but often viewed as being mere targets of social protection schemes (Dixit & Ghosh, Citation2013).
The rationale of this paper is to empirically estimate the quantitative effect of financial inclusion on inclusive growth in SSA. The results suggest that, for financial outreach to promote and sustain inclusive growth, businesses and households must increasingly utilize the various financial services accessible to them. This paper contributes to literature by initially constructing a broader index of inclusive growth and subsequently estimating the separate quantitative effects of three categories of financial inclusion indicators by employing the Arellano–Bover/Blundell–Bond system Generalized Method of Moment estimator. These findings will guide policymakers in developing innovative, sustainable and inclusive financial systems capable of distributing growth benefits to indigent households and vulnerable sectors of the economy, who also form an integral part of the development process.
The rest of the paper is organized as follows: the next section presents a review of relevant literature on the financial inclusion-inclusive growth nexus. Subsequent sections discuss the empirical methods and findings of the study. The final section summarizes the major contribution to literature and policy relevance of the study.
1.0.1. Literature review
Prioritizing economic growth alone may not be enough in meeting the sustainable development goals as it fails to address poverty, inequality and unemployment concerns (Alexander, Citation2015). Rather than focus on only rapid growth, policymakers should initiate strategies that promote inclusive growth (Anand et al., Citation2013). There is no consensus in literature on the precise definition and measurement of inclusive growth. Consequently, measuring inclusive growth at both the country and programme level is challenging. Notwithstanding, some consensus have been reached on the method of its analysis and how it differs from pro-poor growth. Critics of pro-poor growth argued that inclusive growth focuses on improving the permanent income of marginalized groups by increasing their economic participation rather than just direct income transfers (Ianchovichina & Lundstrom, Citation2009). Ramos et al. (Citation2013) argued that economic growth that is inclusive has three outcomes—poverty and income inequality reduction, increased economic participation. They explained that poverty and inequality have already been established as pro-poor growth outcomes, but the inclusion of economic participation makes growth more inclusive. Moreover, economic growth may not necessarily explain increase in inclusiveness as some countries showed high inclusiveness with lower growth rates and vice versa. Nonetheless, World Bank (Citation2013) is unambiguous that economic growth provides the foundation for shared prosperity, which requires continuous growth of economies whilst ensuring that the welfare of the bottom 40% of the population is improved. Klasen (Citation2010) had long asserted that inclusive growth is related to broad-based growth across all sectors of an economy accompanied by non-discriminatory participation in the growth process.
Other scholars have argued that the human capabilities that are needed for gainful employment in order to take advantage of available economic opportunities must be considered in inclusive growth agenda (McKinley, Citation2010). It involves increasing access to basic healthcare, education and other social infrastructure that may impact the quality of human capital. Further, growth must foster equity among various groups in society. People from all genders, sexual orientation, religion and ethnic background should be able to contribute to and benefit from economic growth (Huang & Quibria, Citation2013). Strengthening government effectiveness also guarantees that the trickle-down effect of growth is realized. It also ensures that social safety net programmes and other interventions cushion the vulnerable in society without any marginal social cost.
Literature is replete with empirical findings on the drivers of inclusive growth. However, the evidences differ significantly due to the time period involved, methods of estimation and sampled countries. In a panel of 31 countries, Aoyagi and Ganelli (Citation2015) showed that fiscal redistribution, macroeconomic stability, trade openness, reduction in unemployment and increased productivity are important determinants of inclusive growth. Based on the Fixed Effect Estimator, Tella and Alimi (Citation2016) found that financing of healthcare had a greater impact on inclusive growth in 14 African countries between 1995 and 2012. However, population growth tends to destabilize any agenda toward inclusive growth. Jalles and de Mello (Citation2019) also showed that human capital accumulation, the redistributive potential of tax-benefit systems, increases in multifactor productivity and labor force participation, as well as trade openness and institutional factors stimulated inclusive growth in a sample of 78 countries for the period 1980–2013. Relying on dataset for 18 SSA countries for the period 1995–2013, Raheem et al. (Citation2018) found that augmenting health expenditure with natural resources makes the growth process more inclusive. In a more recent panel analysis, Alekhina and Ganelli (Citation2021) found evidence to suggest that fiscal redistribution, female labour force participation, productivity growth, FDI inflows, digitalization and savings significantly promote inclusive growth.
From the foregoing literature, the role of financial development in enhancing inclusive growth is relegated to the background. Meanwhile, it has long been theorized that financial access has rippling effects on economic welfare. Thus, limitations to financial access may account for the ever-widening income inequality gap as well as slower pace of growth in developing countries (Serrao et al., Citation2012). This formed the theoretical basis for empirical research into the financial inclusion-inclusive growth nexus. To date, not much is documented on the quantitative effect of financial inclusion on broad-based inclusive growth. The few studies that exist are Asian-based. For instance, Park and Mercado (Citation2015) examined the relationship between financial inclusion, poverty and income inequality in 35 developing Asian countries for the period 2004–2012. They found that usage of financial services by a wide range of people reduces poverty. However, there was no evidence to support the theory that financial inclusion reduces income inequality. In India, Swamy (Citation2010) found that bank-led financial inclusion could foster inclusive growth in emerging economies. Similarly, Dixit and Ghosh (Citation2013) found that equitable distribution of financial services could potentially ensure inclusive growth in India. Burgess and Pande (Citation2005) also showed that state-led opening of commercial banks’ branches in rural India was poverty-reducing. Based on the Autoregressive Distributed Lag model, Khan et al. (Citation2016) showed that the ease of accessing loans among other covariates was an enabler of inclusive growth in Pakistan between 1990 and 2012. Likewise, Anand et al. (Citation2013) contend that financial openness promotes inclusive growth in emerging markets. More recently, Munir and Ullah (Citation2018) found financial deepening as inclusive growth enabler in Pakistan.
In SSA, Fowowe (Citation2017) opined that constraints to finance inhibited the growth of 10,888 firms across 30 African countries. Mohammed et al. (Citation2017) also shed more light on the potential impact of financial inclusion on poverty in 35 low-income countries in SSA. The findings of the Treatment Effect Model and Propensity Score Matching techniques suggest that poorer households with access to finance derived higher welfare benefits than their excluded counterparts. Similarly, Kirui et al. (Citation2013) assessed the effect of mobile money transfers on agriculture in three provinces of Kenya. They found that mobile money transfers increased the annual usage of agriculture inputs, incomes and agricultural commercialization by $42, $224 and $37, respectively. They further argued that this medium of money transfer is necessary to eliminate the barriers to financial access by farmers. Okaro (Citation2016) also empirically investigated the relationship between financial inclusion and poverty reduction in Nigeria over the period 1990–2015. The results of the Ordinary Least Squares (OLS) estimator revealed that financial depth and accessibility significantly affects economic growth. However, there was not enough evidence to establish any link between improvement in financial inclusion and poverty alleviation. In Ghana, Abor et al. (Citation2018) explored the impact of mobile telephony on consumer welfare using the probit model and instrumental variable technique. The results showed that the probability of mobile telephony reducing poverty and increasing per capita consumption is more pronounced in male-headed households.
To a very large extent, literature concludes that access to a wide range of financial services is a catalyst of inclusive growth. That notwithstanding, the underpinning methodologies differ significantly among the various researchers. Evidently, most of the studies are descriptive in nature and country-specific, with the few quantitative ones being exclusive to Asia and other regions of the world. Moreover, recent quantitative modelling of inclusive growth determinants in SSA did not account for the role of financial inclusion or financial development (Adeosun et al., Citation2020; Oyinlola et al., Citation2020). Thus, there is still a dearth of empirical literature on the quantitative relationship between financial inclusion and inclusive growth in SSA.
This paper fills the existing research gap in the following unique ways; first, we schematically assessed the depth of financial inclusion in SSA. Second, a broader index of inclusive growth is constructed for the selected SSA economies. Further, the unexplored quantitative relationship is estimated using the Arellano–Bover/Blundell–Bond system Generalized Method of Moments (GMM) estimator with robust standard errors. To the best of our knowledge, no known study has quantitatively modelled this panel dynamic relationship in the SSA sub-region.
1.0.2. Methodology
1.1. Data
The study employs data on 46 SSA countries for the period 2004–2018. The time period reflects a period of measured attempts by the international community in addressing involuntary financial exclusion across the globe. Data for this study were sourced from the following databases of the World Bank; Global Financial Inclusion Databank (Citation2018), Worldwide Governance Indicators Databank (Citation2019), Poverty and Equity Databank (Citation2020) and World Development Indicators Databank (Citation2020).
1.2. Measurement of inclusive growth
In constructing our composite index of inclusive growth, we initially considered the three inclusive growth outcomes proposed by Ramos et al. (Citation2013)—poverty, inequality and economic participation. Further, we followed Khan et al. (Citation2016) to add economic growth itself and adopted an ad hoc weighting scheme for the construction of the composite index of inclusive growth (Mitra & Das, Citation2018). Khan et al. (Citation2016) argued that a composite index that is based on a scoring methodology and a weighting scheme implicitly involves value judgment. Our composite index is constructed on a weighting scale of 0–1, based on the importance of each indicator in the collection. Table presents the weights assigned to the four broad pillars of inclusive growth.
Table 1. Construction of composite index of inclusive growth
1.3. Measurement of financial inclusion
The study utilized three categories of financial inclusion indicators;
Financial availability indicator: This reflects the extent of financial services’ outreach in the form of POS terminals, ATMs per 100,000 adults and Commercial bank branches per 100,000 adults among others. The average of ATMs and Commercial bank branches per 100,000 adults is used a proxy for financial availability.
Financial Services usage indicator: It measures how clients use financial services and products available to them over time. It includes percentage of people who save and borrowed from financial institutions, proportion of people who made or received digital payments, proportion of firms with loans and other lines of credits. For the purpose of our empirical estimations, usage of financial services is proxied by a measure of financial depth—private sector credit by financial sector as a percentage of Gross Domestic Product (GDP). This reflects the extent to which the private sector contracts loans from financial institutions for various projects. A number of empirical findings support this indicator’s close link to poverty reduction (Demirguc-Kunt & Levine, Citation2008; King & Levine, Citation1993).
Financial knowledge indicators: Depth of credit information is used as a proxy for financial knowledge. This measures the scope, accessibility and quality of credit information at public and or private credit registries. Various financial actors depend on credit information to make informed credit decisions. Higher values indicate the extent to which information asymmetry is eliminated in financial markets.
1.4. Specification of empirical model
The three categories of financial inclusion variables discussed earlier are incorporated in the inclusive growth index to validate the findings of Abor et al. (Citation2018), Mohammed et al. (Citation2017), Khan et al. (Citation2016), Park and Mercado (Citation2015) and Anand et al. (Citation2013). Based on the empirical justifications as set out in Table , our empirical relationship between financial inclusion and inclusive growth is modelled as
Table 2. Definition, source, justification and expected relationship of other covariates
where
s represent the coefficients of the empirical model.
1.5. Estimation technique
Conventional panel estimation procedures require unit root tests to examine the stationarity properties of the dataset to ascertain its appropriateness for the estimations. However, Kitamura and Phillips (Citation1997) and Okafor et al. (Citation2015) argued that in smaller samples where the number of observations is larger than the time period under consideration, non-stationarity of any variable does not undermine the validity of the estimates since the problem of serial correlation is reduced under this pre-condition.
Fixed effects (FE) and Random effects (RE) estimators are initially used to generate the estimates. We further estimated our dynamic panel model using the Arellano-Bover/Blundell-Bond system GMM estimator, which is an extension of the Arellano and Bond (Citation1991) model, to correct for endogeneity biases and any other econometric problems associated with the FE and RE models. Arellano and Bover (Citation1995) and Blundell and Bond (Citation1998) found that if the autoregressive process is too persistent, then the lagged-levels are weak instruments for the model in differences. In small samples, weak instruments are likely to produce biased coefficient estimates. To correct for any potential biases, the authors proposed using additional moment conditions in which lagged differences of the dependent variable are orthogonal to levels of the disturbances. They augmented the Arellano–Bond estimator by making additional assumption that the first differences of instruments are uncorrelated with the fixed effects. Generally, the Arellano–Bover/Blundell–Bond estimator is more appropriate for situations with 1) linear dynamic panel data estimation; 2) one left-hand-side variable depending on it past values; 3) independent variables that are not strictly exogenous; 4) fixed individual effects; and 5) heteroskedasticity and autocorrelation within individuals but not across them. This estimator controls for weak instrument by using a level equation to obtain a system of two equations. The first equation includes instruments in first differences, while the second includes instruments in levels. By including the second equation, the variables in the first differences become instruments for variables in levels. The resulting GMM model arising from EquationEquation (1)(1)
(1) includes the first lag of inclusive growth as the instrument:
1.5.1. Results and discussion
1.6. Descriptive analysis
We begin our empirical analysis with an overview of the depth of financial inclusion in SSA. Financial account ownership seemed to have risen steadily between 2011 and 2017 as shown in Figure . However, only 32.8% of the adult population of SSA had a formal bank account, and this is attributable to cumbersome account opening procedures and low financial literacy. This validates the findings of Demirgüç-Kunt and Klapper (Citation2012) and Migap et al. (Citation2015) that the extent of financial inclusion is shallow in SSA. With regard to traditional usage of formal bank accounts, approximately 14.9% and 7.0% saved and borrowed, respectively, in the year 2017. In the developing countries, most people patronize the services of cooperative societies, credit unions, “susu collectors” and usurious moneylenders due to lack of required documents. These situations are impediments to financial inclusion and inclusive growth.
Figure 2. Financial inclusion in SSA.Source: Data from Global Financial Inclusion Databank (Citation2018)
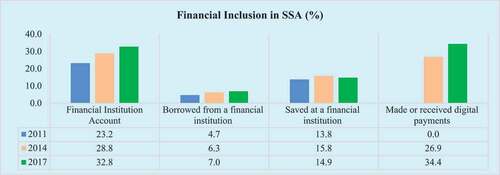
Digital payment is a faster and easier means of undertaking any financial transactions. It involves use of credit and debit cards, mobile financial services and internet banking applications among others. As shown in figure , poor Internet connectivity and low financial literacy have made the usage of digital payment solutions unattractive, averaging 34.4% by year-end 2017.
figure shows the current levels of inclusive growth outcomes across the World Bank regions. The North American region is excluded from this particular graph due to data unavailability. Poverty, inequality and economic participation are measured as headcount ratio at international extreme poverty line of $1.90 a day, GINI index and labour force participation rate, respectively.
Figure 3. Inclusive growth outcomes across the World Bank (Citation2018)Source: Data from Poverty and Equity Databank (Citation2020) and World Development Indicators Databank (Citation2020)
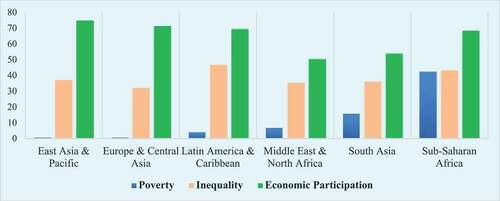
Using the international poverty line of $1.90 a day, extreme poverty is highest in the SSA sub-region, followed by South Asia and Middle East-North Africa, respectively. With respect to inequality, SSA is only better than Latin America-Caribbean region. Most SSA economies are plagued with high levels of unemployment and low incomes. Social safety net programmes to protect the poor and unemployed are at best mismanaged by government appointees, deepening the already existing poverty and inequality gap. In the quest for survival, most people engage in low-paying informal jobs that can only guarantee daily survival. Thus, it is no surprising that poverty, income inequality and economic participation situation is alarming relative to the advanced regions of the world.
The higher income inequality in Latin America relative to SSA can be partly attributed to the practice of “Latifundio-Minifundio” dualistic land tenure system, which gives a few privileged families significant control of large proportions of farmlands. Minifundios are subsistence-oriented smallholdings, farmed by peasant household. The Latifundios apart from owning large farms control the employment conditions of hired labourer. This mostly leads to labour exploitation and marginal income growth for poorer households. The Europe-Central Asian region has the best inequality and poverty indicator partly due to the existence of adequate unemployment benefits and social insurance schemes among other social protection programmes to guarantee average living standard for the poor and unemployed.
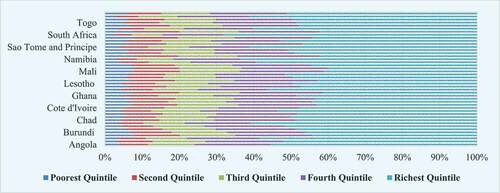
As shown in figure , the distribution of income amongst the various quintiles is largely unequal in SSA, with South Africa spearheading this form of socio-economic injustice. The richest 20% in South Africa have approximately 68% of income leaving the poorest 40 percent with barely 7% share of income. It is common knowledge that the behaviours of central government appointees account for the unfair distribution of income and poverty in the sub-region. It is perpetrated through corruption and nepotism, thus, making only few families better off. Cronyism and rent seeking behaviours also lead to the implementation of public policies that strategically increase the wealth of a few at the expense of development and income redistribution programmes for the large indigent population.
Figure 4. Distribution of income by quintile in SSA (2018).Source: Data from Poverty and Equity Databank (Citation2020)
1.7. Empirical analysis
As shown in the lower regions of Table , the Breusch-Pagan Lagrange multiplier test supports the existence of panel effects, hence the pooled OLS is rejected for panel modelling. Further, the Hausman test favours the RE estimator over the FE. Our model passes the Sargan/Hansen post-estimation test of valid overidentifying restrictions. Similarly, based on the Arellano-Bond test for zero autocorrelation in first-differenced errors, we can conclude that the model does not suffer any autocorrelation problem. Accordingly, there is enough evidence to suggest that the model is correctly specified.
Table 3. Effects of financial inclusion on inclusive growth in SSA (2004–2018)
The results indicate clearly that financial inclusion is important to inclusive growth. Specifically, usage of financial services is significant to inclusive growth in all three models at the conventional 5% or better significance levels. Our finding is consistent with the findings of Demirguc-Kunt and Levine (Citation2008), Anand et al. (Citation2013), Park and Mercado (Citation2015), Mohammed et al. (Citation2017), Okaro (Citation2016), and Khan et al. (Citation2016). Although the coefficient of 0.03 is relatively smaller, we expect greater impact on poverty and other inclusive growth outcomes in the future as financial sector developments in SSA improve- upsurge in the adoption of user-friendly mobile financial services such as the “quick-loan” offer by MTN telecommunication network and mobile money interoperability. Further, the Arellano–Bover/Blundell–Bond system GMM estimates in Table also suggest that availability and knowledge of financial services is not an end to financial inclusion. Rather, it is the extent of usage of financial products and services that matters for inclusive growth. Whilst our RE and FE models showed significant effect of availability of financial services on inclusive growth, the Arellano–Bover/Blundell–Bond system GMM estimates proved otherwise. Financial knowledge is unambiguously insignificant to inclusive growth in all three models. Our findings presuppose that for an economy to realize substantial welfare benefits from financial inclusion, firms and individuals must increasingly utilize the various financial services accessible to them.
The results of the other covariates that served as control variables are worth discussing. In line with previous studies, access to quality infrastructure is an enabler of inclusive growth through creation of jobs, reduction in the costs of production and improved productive capacity (Asian Development Bank, Citation2012). Firms and households primarily depend on constant supply of electricity in the pursuit of their daily activities. Our finding corroborates the views of Jahan and McCleery (Citation2005) that even small-scale infrastructure projects have direct impact on the lives of the poor through increased savings and creation of jobs.
Human capital development also has a discernible impact on inclusive growth. Labour is an invaluable asset to the poor, hence good levels of education and health empower the poor to participate in varied economic activities and benefit from the growth process. Some empirical findings support the relationship between investment in human capital and inclusive growth outcomes (Anand et al., Citation2014; McKinley, Citation2010).
The role of government is indispensable to inclusive growth. Government consumption expenditure is a more direct and effective fiscal policy tool for inclusive growth agenda as it can target low-income groups through redistributive policies such as conditional cash transfers, food subsidies and other social protection programmes to safeguard the poorest and most vulnerable in society from economic shocks and crises (Asian Development Bank, Citation2014; Mathers & Slater, Citation2014). Government expenditures provide the means of extending essential socioeconomic infrastructure to the indigent population and neglected sectors of the economy that play significant roles in the growth process. Further, government consumption expenditures also lead to the provision of health and educational infrastructure and improve access to these facilities by low-income families through granting of scholarships to brilliant but needy children, school feeding programmes and social health insurance schemes.
Again, our results affirm that official development assistance, government aids designed to improve living standards in low- and middle-income countries, has a positive and significant relationship with inclusive growth. The design and implementation of supportive policies and initiatives do not take place in a vacuum. It requires good governance that grant equal rights and opportunities, provides a business-friendly environment for private sector participation in the growth process whilst eliminating rent-seeking behaviours of vested interest groups (Nketiah-Amponsah & Sarpong, Citation2019). Sustainability of FDI’s are guaranteed with the existence of institutions that encourage private investment by ensuring the rule of law and recognition of private property rights. The Arellano–Bover/Blundell–Bond system GMM estimates have shown that the quality of governance, private investment and trade openness are all crucial to the inclusive growth process.
2. Conclusion and policy recommendation
This paper examined the empirical relationship between financial inclusion and inclusive growth in SSA using the RE, FE and Arellano-Bover/Blundell-Bond system GMM estimators. It also provided an insight into the depth of financial inclusion and inclusive growth in SSA relative to other World Bank regions. We found ample evidence to suggest that availability and usage of various financial services and products significantly promote inclusive growth. These findings indicate that for an economy to realize substantial welfare gains from financial development, firms and individuals must increasingly utilize the various financial services accessible to them. Additionally, access to quality infrastructure, government consumption, private investment, human capital development, official development assistance, good governance and trade openness are all crucial to inclusive growth. This paper contributes to literature by initially constructing a broader index of inclusive growth and subsequently estimating the separate quantitative effects of three categories of financial inclusion indicators using the Arellano–Bover/Blundell–Bond system Generalized Method of Moment estimator.
Policymakers and financial institutions in SSA economies must develop innovative, sustainable and inclusive financial services capable of distributing growth benefits equitably. A first point of call is for financial institutions to improve access to private sector credit through continuous expansion of retail and corporate loans, mortgages, overdrafts, credit cards and letters of credits to the willing adult population. Fintech products such as ATMs, POS terminals, mobile money platforms, Internet banking, mobile phone applications and other digital payment platforms should be made user-friendly to enhance usage of financial services by the least educated. Moreover, financial literacy could be integrated into the core business of banking to enlighten economic agents on the financial services and products available to them. We conclude that a reassessment of the documentary requirements of financial transactions and downward review of financial charges and lending rates are necessary to motivate the poorest 40% to patronize financial services. It is envisaged that the foregoing recommendations will gradually integrate majority of the unbanked adult population into the formal financial system to enhance the redistribution of growth benefits. Future studies on this topic should subject to data availability, estimate the quantitative effects of mobile money services and digital payment platforms on inclusive growth in SSA.
Disclosure statement
No potential conflict of interest was reported by the author(s).
Additional information
Funding
Notes on contributors

Bernard Sarpong
Bernard Sarpong is a young Economist with research interest in Development, Financial and Monetary Policies for inclusive growth in emerging and frontier market economies. He has six (6) years’ experience in financial market analysis and strategic banking research. He has over the years tutored students pursuing various Economics courses at both the Department of Economics and School of Continuing and Distance Education, University of Ghana. He is also a peer reviewer for three refereed economics journals; Economic Letters, International Journal of Social Economics and Ghanaian Journal of Economics. He holds both Master of Philosophy and Bachelor of Arts degrees in Economics from the University of Ghana.
The findings reported in this paper provide a compelling evidence for central governments to devote more resources to the provision of robust Information and Communication Technology infrastructure to complement the financial inclusion agenda of monetary authorities.
References
- Abor, J. Y., Amidu, M., & Issahaku, H. (2018). Mobile telephony, financial inclusion and inclusive growth. Journal of African Business, 19(3), 430–17. https://doi.org/10.1080/15228916.2017.1419332
- Adeosun, O. A., Olomola, P. A., Adedokun, A., & Ayodele, O. S. (2020). Public investment and inclusive growth in Africa. International Journal of Social Economics, 47(12), 1669–1691. https://doi.org/10.1108/IJSE-05-2020-0333
- Akobeng, E. (2017). Gross capital formation, institutions and poverty in Sub-Saharan Africa. Journal of Economic Policy Reform, 20(2), 136–164. https://doi.org/10.1080/17487870.2015.1128833
- Alekhina, V., & Ganelli, G. (2021). Determinants of inclusive growth in ASEAN. Journal of the Asia Pacific Economy, . https://doi.org/10.1080/13547860.2021.1981044
- Alexander, K. (2015), “Inclusive growth: Topic guide”. GSDRC, University of Birmingham http://www.gsdrc.org/docs/open/inclusivegrowth.pdf (accessed July 07, 2020)
- Anand, R., Mishra, S., & Peiris, S. J. (2013), “Inclusive growth revisited: Measurement and determinants”. Working paper (No. 79445). World Bank. http://documents1.worldbank.org/curated/en/842461468335940798/pdf/794450BRI0Incl0Boc0377373B00PUBLIC0.pdf (accessed July 07, 2020).
- Anand, R., Tulin, V., & Kumar, N. (2014), “India; defining and explaining inclusive growth and poverty reduction”. Working paper (No. 14/63). International Monetary Fund. http://www.imf.org/external/pubs/cat/longres.aspx?sk=41486 (accessed July 27, 2020).
- Aoyagi, C., & Ganelli, G. (2015). “Asia’s Quest for Inclusive Growth Revisited”. Journal of Asian Economics, 40(C), 29–46. https://doi.org/10.1016/j.asieco.2015.06.005
- Arellano, M., & Bond, S. (1991). Some tests of specification for panel data: Monte Carlo evidence and an application to employment equations. Review of Economic Studies, 58(2), 277–297. https://doi.org/10.2307/2297968
- Arellano, M., & Bover, O. (1995). Another look at the instrumental variable estimation of error-components models. Journal of Econometrics, 68(1), 29–51. https://doi.org/10.1016/0304-4076(94)01642-D
- Asian Development Bank (2012), “Infrastructure for supporting inclusive growth and poverty reduction in Asia”, Asian Development Bank, Working paper, Mandaluyong City, http://www.adb.org/sites/default/files/pub/2012/infrastructure-supporting-inclusive-growth.pdf (accessed October 20, 2019).
- Asian Development Bank. (2014), “Asian development outlook 2014: Fiscal policy for inclusive Growth”, Asian Development Bank, Working paper, Mandaluyong City, http://www.adb.org/sites/default/files/pub/2014/ado-2014.pdf (accessed October 20, 2019).
- Bal, D. P., Dash, D. P., & Subhasish, B. (2016). The effects of capital formation on economic growth in India: Evidence from ARDL-bound testing approach. Global Business Review, 17(6), 1388–1400. https://doi.org/10.1177/0972150916660403
- Blundell, R., & Bond, S. (1998). Initial conditions and moment restrictions in dynamic panel data models. Journal of Econometrics, 87(1), 115–143. https://doi.org/10.1016/S0304-4076(98)00009-8
- Burgess, R., & Pande, R. (2005). Do rural banks matter? Evidence from the Indian social banking experiment. American Economic Review, 95(3), 780–795. https://doi.org/10.1257/0002828054201242
- Demirgüç-Kunt, A., & Klapper, L. (2012), “Financial inclusion in Africa: An overview”, World Bank, https://doi.org/10.1596/1813-9450-6088 (accessed October 31, 2019).
- Demirguc-Kunt, A., & Levine, R. (2008), “Finance, financial sector policies, and long-run growth”, World Bank, Working paper, https://doi.org/10.1596/1813-9450-4469 (accessed June 16, 2020)
- Dixit, R., & Ghosh, M. (2013). Financial inclusion for inclusive growth of India-A study of Indian states. International Journal of Business Management and Research, 3(1), 147–156.
- Dwumfour, R. A. (2020). Poverty in Sub-Saharan Africa: The role of business regulations, policies and institutions. Social Indicators Research, 149(3), 861–890. https://doi.org/10.1007/s11205-020-02277-z
- Fowowe, B. (2017). Access to finance and firm performance: Evidence from African countries. Review of Development Finance, 7(1), 6–17. https://doi.org/10.1016/j.rdf.2017.01.006
- Gebrehiwot, K. G. (2014). The impact of human capital development on economic growth in Ethiopia: Evidence from ARDL approach to co-integration. American Journal of Trade and Policy, 1(3), 127–136. https://doi.org/10.18034/ajtp.v1i3.374
- Ghosh, J. (2005), “The economic and social effects of financial liberalization: A primer for developing countries”, United Nations, Department of Economics and Social Affairs (No. 4), https://doi.org/10.18356/a39cdf00-en (accessed July 08, 2020)
- Global Financial Development Databank (2019), World bank, https://databank.worldbank.org/source/global-financial-development (accessed June 16, 2020)
- Global Financial Inclusion Databank (2018), World bank, https://databank.worldbank.org/source/global-financial-inclusion (accessed June 16, 2020)
- Hannig, A., & Jansen, S. (2010), “Financial inclusion and financial stability: Current policy issues, Asian Development Bank Institute, Working Paper (No. 259), https://dx.doi.org/10.2139/ssrn.1729122 (accessed July 08, 2020)
- Huang, Y., & Quibria, M. G., 2013. The global partnership for inclusive growth (no. 2013/059). WIDER Working Paper, http://hdl.handle.net/10419/81052 (accessed February 11, 2022)
- Huchet‐Bourdon, M., Le Mouël, C., & Vijil, M. (2018). The relationship between trade openness and economic growth: Some new insights on the openness measurement issue. The World Economy, 41(1), 59–76. https://doi.org/10.1111/twec.12586
- Ianchovichina, E., & Lundstrom, S. (2009), “Inclusive growth analytics: Framework and application”, World Bank, Working Paper, https://doi.org/10.1596/1813-9450-4851 (accessed July 08, 2020)
- Jahan, S., & McCleery, R. (2005), “making infrastructure work for the poor: Synthesis report of four country studies - Bangladesh, Senegal, Thailand and Zambia.” United Nations Development Programme http://www.undp.org/content/dam/aplaws/publication/en/publications/poverty-reduction/povertywebsite/making-infrastructure-work-for-the-poor/MakingInfrastructureWorkforthePoor.pdf (accessed July27, 2020)
- Jalles, J. T., & de Mello, L. (2019). Cross‐country evidence on the determinants of inclusive growth episodes. Review of Development Economics, 23(4), 1818–1839. https://doi.org/10.1111/rode.12605
- Kasidi, F., & Mwakanemela, K. (2013). Impact of inflation on economic growth: A case study of Tanzania. Asian Journal of Empirical Research, 3(4), 363–380. https://archive.aessweb.com/index.php/5004/article/view/3366/5381
- Khan, A., Khan, G., Safdar, S., Munir, S., & Andleeb, Z. (2016). Measurement and determinants of inclusive growth: A case study of Pakistan (1990-2012). The Pakistan Development Review, 55(4), 455–466. https://doi.org/10.30541/v55i4I-IIpp.455-466
- King, R. G., & Levine, R. (1993). Finance and growth: Schumpeter might be right. The Quarterly Journal of Economics, 108(3), 717–737. https://doi.org/10.2307/2118406
- Kirui, O. K., Okello, J. J., Nyikal, R. A., & Njiraini, G. W. (2013). Impact of mobile phone-based money transfer services in agriculture: Evidence from Kenya. Quarterly Journal of International Agriculture, 52(2), 141–162. https://dx.doi.org/10.22004/ag.econ.125738
- Kitamura, Y., & Phillips, P. C. (1997). Fully modified IV, GIVE and GMM estimation with possibly non-stationary regressors and instruments. Journal of Econometrics, 80(1), 85–123. https://doi.org/10.1016/S0304-4076(97)00004-3
- Klasen, S. (2010), “Measuring and monitoring inclusive growth: Multiple definitions, open questions, and some constructive proposals”, Asian Development Bank, Working Paper Series, https://think-asia.org/bitstream/handle/11540/1404/adb-wp12-measuring-inclusive-growth (accessed July 07, 2020)
- Madurapperuma, W. (2016). Impact of inflation on economic growth in Sri Lanka. Journal of World Economic Research, 5(1), 1–7. https://doi.org/10.11648/j.jwer.20160501.11
- Mathers, N., & Slater, R. (2014), “Social protection and growth: Research synthesis”. Overseas Development Institute http://www.odi.org/sites/odi.org.uk/files/odi-assets/publications-opinion-files/9099.pdf (accessed July 27, 2020)
- McKinley, T. (2010), “Inclusive growth criteria and indicators: An inclusive growth index for diagnosis of country progress”, Asian Development Bank, Working paper, Mandaluyong City, http://www.adb.org/sites/default/files/pub/2010/ADB-WP14-inclusive-growth-criteria.pdf (accessed July 27, 2020).
- Migap, J. P., Okwanya, I., & Ojeka, G. (2015). Financial inclusion for inclusive growth: The Nigerian perspective. International Journal of Information Technology and Business Management, 37(1), 1–8.
- Mitra, A., & Das, D. (2018). Inclusive growth: Economics as if people mattered. Global Business Review, 19(3), 756–770. https://doi.org/10.1177/0972150917713840
- Mohammed, J. I., Mensah, L., & Gyeke-Dako, A. (2017). Financial inclusion and poverty reduction in Sub-Saharan Africa. African Finance Journal, 19(1), 1–22. https://EconPapers.repec.org/RePEc:afj:journl
- Munir, F., & Ullah, S. (2018). Inclusive growth in Pakistan: Measurement and determinants. The Pakistan Journal of Social Issues, 6(6), 150–162. https://uog.edu.pk/downloads/journal/14_Inclusive_Growth_in_Pakistan_Measurement_and_Determinants_150-162.pdf
- Nketiah-Amponsah, E., & Sarpong, B. (2019). The effects of infrastructure and foreign direct investment on economic growth in Sub-Saharan Africa. Global Journal of Emerging Market Economies, 11(3), 183–201. https://doi.org/10.1177/0974910119887242
- Okafor, G., Piesse, J., & Webster, A. (2015). The motives for inward FDI into Sub-Saharan African countries. Journal of Policy Modeling, 37(5), 875–890. https://doi.org/10.1016/j.jpolmod.2015.07.003
- Okaro, C. (2016). Financial inclusion and Nigerian economy (1990-2015). Journal of Policy and Development Studies, 10(4), 50–65. https://doi.org/10.12816/0041083
- Oluwadamilola, O., Akinyemi, O., & Adediran, O. (2018). Human capital development and inclusive growth: Implications for achieving SDG-4 in Nigeria. African Population Studies, 32(1), 4088–4096. https://aps.journals.ac.za/pub/article/view/1180
- Oyinlola, M. A., & Adedeji, A. (2019). Human capital, financial sector development and inclusive growth in sub-Saharan Africa. Economic Change and Restructuring, 52(1), 43–66. https://doi.org/10.1007/s10644-017-9217-2
- Oyinlola, M. A., Adedeji, A. A., Bolarinwa, M. O., & Olabisi, N. (2020). Governance, domestic resource mobilization, and inclusive growth in sub-Saharan Africa. Economic Analysis and Policy, 651, 68–88. https://doi.org/10.1016/j.eap.2019.11.006
- Park, C. Y., & Mercado, R. (2015), “Financial inclusion, poverty, and income inequality in developing Asia”. Asian Development Bank, Economics Working Paper Series (426), https://dx.doi.org/10.2139/ssrn.2558936 (accessed July 07, 2020).
- Poverty and Equity Databank (2020), World bank, https://databank.worldbank.org/source/poverty-and-equity (accessed June 16, 2020)
- Raheem, I. D., Isah, K. O., & Adedeji, A. A. (2018). Inclusive growth, human capital development and natural resource rent in SSA. Economic Change and Restructuring, 51(1), 29–48. https://doi.org/10.1007/s10644-016-9193-y
- Ramos, R. A., Ranieri, R., & Lammens, J. W. (2013), Retrived July 07, 2020).“Mapping inclusive growth in developing countries”, IPC-IG, Working Paper (No. 105), Brasília, International Policy, https://ipcig.org/pub/IPCWorkingPaper105.pdf
- Refaei, R., & Sameti, M. (2015). Official development assistance and economic growth in Iran. International Journal of Management, Accounting and Economics, 2(2), 125–135. https://www.academia.edu/27071389/Official_Development_Assistance_and_Economic_Growth_in_iran
- Serrao, M. V., Sequeira, A. H., & Hans, B. (2012). Designing a methodology to investigate accessibility and impact of financial inclusion. Household finance e-journal-CMBO. Retrieved October 31, 2019. from https://dx.doi.org/10.2139/ssrn.2025521
- Shaikh, F. M. (2010). Causality relationship between foreign direct investment, trade and economic growth in Pakistan. In International Business Research, 6(9), 11–18. https://www.researchgate.net/publication/228259683_Financial_Development_and_Economic_Growth_An_Empirical_Research_about_Greece-Cointegration_Test
- Swamy, V. (2010). Bank-based financial intermediation for financial inclusion and inclusive growth. MPRA Paper 47510, University Library of Munich, Germany. Retrieved October 31, 2019. from https://dx.doi.org/10.2139/ssrn.2126834
- Tebaldi, E., & Mohan, R. (2010). Institutions and poverty. The Journal of Development Studies, 46(6), 1047–1066. https://doi.org/10.1080/00220380903012730
- Tella, S. A., & Alimi, O. Y. (2016). Determinants of inclusive growth in Africa: Role of health and demographic changes. African Journal of Economic Review, 4(2), 138–146. https://dx.doi.org/10.22004/ag.econ.264459
- Tezanos, S., Quiñones, A., & Guijarro, M. (2013). Inequality, aid and growth: Macroeconomic impact of aid grants and loans in Latin America and the Caribbean. Journal of Applied Economics, 16(1), 153–177. https://doi.org/10.1016/S1514-0326(13)60007-0
- Umaru, A., & Zubairu, A. A. (2012). Effect of inflation on the growth and development of the Nigerian economy (an empirical analysis). International Journal of Business and Social Science, 3(10), 183–191. http://citeseerx.ist.psu.edu/viewdoc/download?doi=10.1.1.1084.5719&rep=rep1&type=pdf
- Umoh, O. J., Jacob, A. O., & Chuku, C. A. (2012). Foreign direct investment and economic growth in Nigeria: An analysis of the endogenous effects. Current Research Journal of Economic Theory, 4(3), 53–66. https://www.airitilibrary.com/Publication/alDetailedMesh?DocID=2042485X-201206-201507090016-201507090016-53-66
- Uneze, E. (2013). The relation between capital formation and economic growth: Evidence from sub-Saharan African countries. Journal of Economic Policy Reform, 16(3), 272–286. https://doi.org/10.1080/17487870.2013.799916
- United Nations Secretary-General’s Special Advocate. (2013). The Imperative of Financial Inclusion. Retrieved July 07, 2020. from https://www.unsgsa.org/about/financial-inclusion
- World Bank. (2013). The world bank group Goals: End extreme poverty and promote shared prosperity. Retrieved July 08, 2020. from https://www.worldbank.org/content/dam/Worldbank/document/WB-goals2013.pdf
- World Bank. (2014). Global Financial development report 2014: Financial inclusion. Retrieved July 08, 2020. from https://openknowledge.worldbank.org/handle/10986/16238
- World Bank. (2018), Universal financial access by 2020. Retrieved January 12, 2020. from https://www.worldbank.org/en/topic/financialinclusion/brief/achieving-universal-financial-access-by-2020
- World Development Indicators Databank. (2020). World bank. Retrieved June 16, 2020. from https://databank.worldbank.org/source/world-development-indicators
- Worldwide Governance Indicators Databank. (2019). World bank, Retrieved June 16, 2020. from https://databank.worldbank.org/source/worldwide-governance-indicators
