
 ?Mathematical formulae have been encoded as MathML and are displayed in this HTML version using MathJax in order to improve their display. Uncheck the box to turn MathJax off. This feature requires Javascript. Click on a formula to zoom.
Abstract
We present a multi-scale and time-frequency analysis of the degree of integration and the lead-lag relationship between six cryptocurrencies (i.e., Bitcoin, Bitcoincash, Ethereum, Litecoin, Ripple, and Tether) and the cryptocurrency-implied volatility index (VCRIX). As a result, the wavelet techniques—bi-wavelet, partial wavelet, bivariate contemporary correlations (BCC), wavelet multiple correlations (WMC) and wavelet multiple cross-correlations (WMCC) are applied. Findings from the study provide that the interdependencies between the cryptocurrencies and VCRIX are high and mostly positive across investment horizons. Furthermore, the comovements between the cryptocurrencies designate long memory dynamics. The high comovements between cryptocurrencies are highly influenced by idiosyncratic shocks they possess rather than the VCRIX. In addition, the BCC and the WMC indicate that there is a high integration among all the cryptocurrencies. Categorically, the VCRIX could not lead or lag the interdependencies among the cryptocurrencies in the WMCC analysis. Findings from the study, therefore, divulge that investing in a single or few cryptocurrencies is highly risky due to the adverse impact of the VCRIX on individual cryptocurrencies. In general, investors should effectively hedge against volatilities in the cryptocurrency markets due to the significant predictive ability of VCRIX as an effective proxy.
PUBLIC INTEREST STATEMENT
This research is important for all stakeholders in the financial and cryptocurrencies markets. Since the emergence of cryptocurrencies, there has been heightened concern about how cryptocurrency-implied volatility index (VCRIX) adds to understanding the information transmission phenomenon in the cryptocurrency markets, which escalates speculative bubbles in other financial markets. We sourced cryptocurrency data from recognized exchange to advance our empirical analysis, which most prior related literature ignores. This is because data from a questionable source might not provide reliable empirical outcomes. We incorporate the VCRIX which is directly related to the cryptocurrency markets. To achieve this purpose, we consider the wide application of wavelet techniques that assess comovements or degree of integration between or among time series in a time-frequency or frequency-dependent domain. Findings from the study, therefore, divulge that investing in a single or few cryptocurrencies is highly risky due to the adverse impact of the VCRIX on individual cryptocurrencies.
1. Introduction
The operations of cryptocurrency markets have been investigated by many empirical studies to assess their interlinkages, integrity, time-varying dynamics, and the underlying fundamentals (Asafo-Adjei, Owusu Junior et al., Citation2021; Bouri et al., Citation2021; Fry & Cheah, Citation2016; Katsiampa et al., Citation2019; Mensi et al., Citation2019; Omane-Adjepong et al., Citation2019; Owusu Junior et al., Citation2020; Le Tran & Leirvik, Citation2020). However, the increasing likelihood of illegality and dereliction through cryptocurrencies have induced some level of skepticism by regulatory bodies and policy-makers (Asafo-Adjei, Owusu Junior et al., Citation2021).
Findings from the extant literature indicate the potential for market manipulation in the interdependency and degree of integration among the cryptocurrencies (Fry & Cheah, Citation2016; 2018; Katsiampa et al., Citation2019). This has adjusted the attention of regulators, policy-makers and academics since the future progress of cryptocurrencies is less likely to be sustained with significant questions of unanswered abnormality (see, Asafo-Adjei, Owusu Junior et al., Citation2021; Katsiampa et al., Citation2019). Cryptocurrencies are susceptible to speculative bubbles since it is characterized by anonymity (Gil-Alana et al., Citation2020). The impact may be aggravated even during times of severe economic shocks, especially, the COVID-19 pandemic. As indicated by Yarovaya et al. (Citation2016) and Asafo-Adjei, Owusu Junior et al. (Citation2021), the speculative bubbles in the cryptocurrency markets may, in turn, spread contagion and weaken financial stability. This calls for an increased assessment of the cryptocurrencies’ mechanism. We, therefore, lay much emphasis on the comovements and degree of integration within the cryptocurrency markets, which continue to remain underdeveloped, coupled with changing economic circumstances due to uncertainties. Thus, investigating the interconnectedness between cryptocurrencies and the cryptocurrency implied volatility index (VCRIX) adds to understanding the information transmission phenomenon in the cryptocurrency markets (Liu & Serletis, Citation2019) in line with the competitive market hypothesis (Owusu Junior, Frimpong et al., Citation2021).
Accordingly, arguments on asymmetric volatility in the discussion of the VCRIX and cryptocurrencies cannot be ignored. Fluctuations in market volatilities influence investors’ portfolio choices either by altering the trade-off between risk and return or their predictions of future market performance (Asafo-Adjei, Owusu Junior et al., Citation2021; Bossman et al., Citation2022; Bossman & Ferreira, Citation2021). Chen (Citation2002) avers that investors desire to hedge against market volatility since rising volatility does not incentivize investment opportunities. This is because, times of high volatility tend to concur with drawdowns in cryptocurrency markets (Campbell & Hentschel, Citation1992).
An embryonic body of literature has examined the diversification, safe haven and diversification properties among cryptocurrencies (Bouri et al., Citation2021; Gurdgiev & O’Loughlin, Citation2020; Kristoufek, Citation2020; Omane-Adjepong et al., Citation2019; Le Tran & Leirvik, Citation2020), and with other assets (Enilov et al., Citation2021; Gil-Alana et al., Citation2020; Owusu Junior et al., Citation2020; Tiwari et al., Citation2019). On the other hand, due to the rising volatilities in the cryptocurrencies markets, volatility transmission within the cryptocurrencies has also been studied (Rubbaniy, Khalid et al., Citation2021). Also, the influence of the COVID-19 on cryptocurrencies (Corbet et al., Citation2020; Goodell & Goutte, Citation2020; Rubbaniy, Khalid et al., Citation2021) and the impact of policy uncertainty on cryptocurrencies (T. Chen et al., Citation2021; Nguyen Quang et al., Citation2020) have been further examined. Findings from these studies either indicate a high potential for cryptocurrencies to offer some diversification, hedge or safe haven benefits depending on the market conditions (T. Chen et al., Citation2021; Mariana et al., Citation2021; Rubbaniy, Khalid et al., Citation2021) or otherwise (C. Chen et al., Citation2020; Conlon & McGee, Citation2020; Corbet et al., Citation2020; Goodell & Goutte, Citation2020). However, findings from Rubbaniy, Khalid et al. (Citation2021) indicate that cryptocurrencies do not offer safe haven benefits during the COVID-19 when the VCRIX was employed. Consequently, the outcome from empirical studies reveals the extent of unanswered abnormality in cryptocurrencies (see Katsiampa et al., Citation2019). This may be due to the choice of analytical techniques or the proxy of stock market volatility employed.
In terms of research methods, a lot has been done by prior literature, for instance, GARCH models (Bohte & Rossini, Citation2019; Cheikh et al., Citation2020); wavelet analysis (Omane-Adjepong et al., Citation2019; Qiao et al., Citation2020; Rubbaniy, Khalid et al., Citation2021), multiple least squares (Nguyen et al., Citation2020; Sami & Abdallah, Citation2020); conditional autoregressive Value at Risk (Borri, Citation2019; Enilov et al., Citation2021), multifractality (Mensi et al., Citation2019; Mnif & Jarboui, Citation2021; Mnif et al., Citation2020), etc. Most of these techniques lack both the time and frequency perspective of these assets, wherein financial time series exhibit rapid oscillations across investment horizons (both intrinsic and calendar times). The few studies that employ wavelet analytical techniques, on the other hand, do not utilize the varieties of these techniques together in a single study towards revealing confounding relationships, which are most likely to influence the outcome.
Our study is similar to the work of Rubbaniy, Khalid et al. (Citation2021) who probed the comovements between VCRIX and three cryptocurrencies’ returns during the COVID-19. Rubbaniy, Khalid et al. (Citation2021) examined the nexus by employing the bi-wavelet technique. In addition, our study differs significantly from Qiao et al. (Citation2020) who comprehensively investigated the time-frequency comovements among several cryptocurrencies in the bivariate case. However, the bi-wavelet is limited to only two time series, despite the fact that their study did not reveal the dynamics of other important cryptocurrencies, which are gaining value over time (for instance, Litecoin, Bitcoincash and Tether). Although Qiao et al. examined the pairwise comovements among cryptocurrencies’ returns and volatility, the application of the VCRIX was absolutely ignored. Yet, the inclusion of the VCRIX in the discussion of cryptocurrency returns is worthwhile because it accurately measures volatility in the cryptocurrency markets relative to the historical realized volatility obtained from the cryptocurrency price series (Kim et al., Citation2021; Rubbaniy, Khalid et al., Citation2021). In other words, the VCRIX is a forward-looking risk in the crypto-currency market. Due to this, the study of Qiao et al. could not divulge the extent to which the VCRIX distort the comovements among the cryptocurrencies’ returns. Furthermore, Qiao et al.’s study did not consider integration and interdependencies among multiple cryptocurrencies simultaneously, which are necessary to reveal an overall picture of the nexus for the sampled period.
Our study departs from prior studies by incorporating the VCRIX, which is directly related to the cryptocurrency markets using several wavelet analytical techniques. The VCRIX provides the valuation of the risk measurement for the cryptocurrency markets and delivery of market status information, which is analogous to implied volatility indices that detect investors’ expectations (Kim et al., Citation2021). We do this by assessing the volatility transmission within individual cryptocurrencies and the impact of the volatility between two cryptocurrencies. In addition, we assess the degree of integration among all the cryptocurrencies amidst the VCRIX simultaneously. To achieve this purpose, we consider the wide application of wavelet techniques that assess comovements or degree of integration between or among time series in a time-frequency or frequency-dependent domain.
The intrinsic complexity in time series has increased the time-frequency domain analysis; thus, wavelet analysis is an attractive instrument for examining localized disparities of power within a time series to define both prevailing modes of changeability and how the modes adjust in time through decomposition (Asafo-Adjei, Adam et al., Citation2021; Diallo et al., Citation2021; Frimpong et al., Citation2021; Owusu Junior et al., Citation2018; Tweneboah et al., Citation2019). The application of bi-wavelet, partial wavelet, wavelet multiple correlations (WMC) and wavelet multiple cross-correlations (WMCC) is, therefore, important in this study. While bi-wavelet coherence is a technique that shows the correlation between two variables (Asafo-Adjei et al., Citation2020; Asafo-Adjei, Owusu Junior et al., Citation2021), partial wavelet assesses the comovements between two time series relative to a common interdependence (Boateng et al., Citation2022; Frimpong et al., Citation2021), and the resulting wavelet transformation lead-lag relationships of more than two variables are ideal for the wavelet multiple techniques (WMC and WMCC; Asafo-Adjei, Adam et al., Citation2021; Owusu Junior et al., Citation2017). We employ all these wavelet techniques to resolve the limitations within each technique to give a full picture of the volatility of cryptocurrencies nexus. As a result, the application of the wavelet techniques supports the heterogeneous market hypothesis (HMH; Müller et al., Citation1997). In addition, the adaptive market hypothesis (AMH) by Lo (Citation2004) avers that market efficiency varies in degree at different times. This is to say, both the HMH and AMH are supported by time-frequency and frequency-dependent mechanisms of most financial time series.
The study contributes to the literature in many ways. First, we investigate the lead–lag relationship between the cryptocurrencies’ returns and the VCRIX returns via the bi-wavelet technique. It is expected that the directional comovements between the VCRIX as a measure of investor fear and each of the cryptocurrencies are negative. In addition, the intensity of negative comovements between the VCRIX and the cryptocurrencies may be substantial during the COVID-19. Second, we examine the influence of the VCRIX returns on the comovements between the cryptocurrencies’ returns through partial wavelet techniques. Thus, the focus of this contribution to literature is not entirely on the comovements between the cryptocurrencies themselves, but on the confounding impact of the VCRIX on the cryptocurrencies’ nexus. This is due to the plethora and blatant bodies of literature on the nexus between cryptocurrencies. To assess the impact of VCRIX on the cryptocurrencies’ nexus, the cryptocurrencies are examined between Bitcoin and the remaining cryptocurrencies. We do this to indicate that Bitcoin acts as a reference point for all other cryptocurrencies, due to the former’s unique property of diversification, hedge and safe haven with other assets (see, Mensi et al., Citation2019; Popper, Citation2015; Shahzad et al., Citation2019), aside from having the largest market capitalization (Mnif & Jarboui, Citation2021).
Nonetheless, if the cryptocurrencies are highly integrated as indicated by extant literature (Ji et al., Citation2019; Maiti et al., Citation2020), we expect limited volatility transmission within the combined cryptocurrencies. Thus, there may be less expectation for the VCRIX to drive the highly integrated cryptocurrencies in a combined portfolio. This is, therefore, captured by the wavelet multiple techniques (WMC and WMCC), as our third contribution to the empirical literature. The wavelet multiple techniques are specifically pertinent to this study to examine the overall interconnectedness among cryptocurrencies amid the VCRIX simultaneously. Specifically, the wavelet multiple techniques allow us to investigate the degree of interdependencies among all the variables concurrently to reveal the leading or lagging variable at various investment horizons.
Fourth, the VCRIX employed in this study is an effective tool to reveal the safe haven properties of cryptocurrencies in times of shocks, and this measure is directly related to the cryptocurrency markets. Fifth, since time-frequency analysis is pertinent in this study, we utilize a relatively long period of the COVID-19 pandemic, which has caused havoc on markets (Asafo-Adjei, Boateng et al., Citation2021; Bossman et al., Citation2022; Bossman & Ferreira, Citation2021; Cevik & Ozturkkal, Citation2020; Owusu Junior, Adam et al., Citation2021). This would offer better discernments and indulgence about the safe haven properties of cryptocurrencies. In consequence of this, we investigate the heterogeneous dynamics of the markets for three sample periods, including the full sample, pre-COVID-19 and the COVID-19 pandemic samples.
Sixth, we sourced cryptocurrency data from recognized exchange to advance our empirical analysis, which most prior related literature ignores. This is because data from a questionable source might not provide reliable empirical outcomes (Alexander & Dakos, Citation2020). Specifically, cryptocurrency data was gleaned from Kraken. Kraken offers an Application Programming Interface (API) service that allows users to retrieve a limited history of the order book, as well as traded prices and volumes, through a variety of data transfer protocols (Alexander & Dakos, Citation2020). In this regard, the current study is among the very few empirical studies that assess the lead–lag relationships between and/or among cryptocurrencies’ returns and VCRIX returns through a variety of wavelet techniques while drawing insights from the COVID-19 pandemic in a pragmatic fashion.
We found inconsistent interdependencies between cryptocurrencies and VCRIX across diverse scales and time. With the moderate to low correlations revealed by the BCC between the VCRIX and cryptocurrencies, investors could attract portfolio gains by investing in both the actual asset(s) proxied by VCRIX and any of the cryptocurrencies through effective risk management strategies across time frequencies. Furthermore, the comovements between the cryptocurrencies designate strong persisting correlations between the Bitcoin and the remaining cryptocurrencies markets in the short, medium, and long term, indicating long-range dependence. Although the VCRIX fail to drive the high comovements between the cryptocurrencies, it serves as an effective proxy for hedges, diversifiers, and safe havens based on market conditions. The WMC and the WMCC indicate that there is a high integration among the cryptocurrencies. Categorically, the VCRIX could not lead or lag the interdependencies among the cryptocurrencies in the WMCC analysis, and partly supported by the partial wavelet outcome of limited impact of VCRIX as common interdependence. Findings from the study, therefore, divulge that investing in a single or few cryptocurrencies is highly risky due to the adverse impact of the VCRIX on a single (double) cryptocurrency(ies). However, investors are most likely to gain from diversification and hedge benefits rather than safe haven at benign market conditions, when they choose several cryptocurrencies.
The study is systemized by presenting related studies on the topic, then the research methodology. These are followed by the presentation and discussion of the results and the practical implications they offer. Finally, some concluding remarks are presented.
2. Literature review
The literature on cryptocurrencies is enormous. In recent periods, the works on cryptocurrencies could be largely categorized into four strands, with an emerging strand, which we unveil after briefly introducing the existing strands.
The first strand of research looks at the fundamental interconnections, stability, and time-varying dynamics of crypto markets (Fry & Cheah, Citation2016; Katsiampa et al., Citation2019; Omane-Adjepong et al., Citation2019; Le Tran & Leirvik, Citation2020). The second strand of research examines the roles of cryptocurrencies as hedgers, diversifiers, or safe havens amongst themselves (Bouri et al., Citation2021; Gurdgiev & O’Loughlin, Citation2020; Kristoufek, Citation2020; Le Tran & Leirvik, Citation2020) and between them and other assets (Aharon et al., Citation2021; Enilov et al., Citation2021; Gil-Alana et al., Citation2020; Owusu Junior et al., Citation2020; Tiwari et al., Citation2019). The third strand of research focuses on the transmission of volatility within cryptocurrencies (Rubbaniy, Khalid et al., Citation2021), the impact of the COVID-19 on cryptocurrencies (Corbet et al., Citation2020; Goodell & Goutte, Citation2020; Rubbaniy, Khalid et al., Citation2021), the impact of policy uncertainty on cryptocurrencies (T. Chen et al., Citation2021; Corbet et al., Citation2020; Goodell & Goutte, Citation2020; Nguyen Quang et al., Citation2020), and the interrelations between macroeconomic variables and cryptocurrencies (Aharon et al., Citation2021).
It is instructive to note that these studies’ findings are conflicting. They either show that cryptocurrencies have a high potential to serve as diversifiers, hedges, or safe havens depending on market conditions (T. Chen et al., Citation2021; Mariana et al., Citation2021; Rubbaniy, Khalid et al., Citation2021), or they are inconsistent (Aharon et al., Citation2021; C. Chen et al., Citation2020; Conlon & McGee, Citation2020; Corbet et al., Citation2020; Goodell & Goutte, Citation2020; Mnif & Jarboui, Citation2021; Mnif et al., Citation2020). With the conflicting conclusions, it is not surprising that the previously held position of Bitcoin and other cryptocurrencies—as diversifiers, safe havens and hedgers—has taken an opposite direction in recent times owing to the empirical evidence that suggests that cryptocurrencies are seeing some level of integration with traditional assets (Aharon et al., Citation2021; Rubbaniy, Khalid et al., Citation2021).
The interdependence and level of integration among cryptocurrencies, according to the existing research, imply the possibility for price gouging (see, e.g., Gandal et al., 2018; Katsiampa et al., Citation2019). This has shifted the focus of regulators and academics alike, as future cryptocurrency advancement is less likely to be sustained if key concerns of irregularity remain unsolved. In the spirit of this supposition, a forward-looking quantification of cryptocurrency markets’ volatility in comparison to historical realized volatility derived from the cryptocurrency market series is introduced (Kim et al., Citation2021; Rubbaniy, Khalid et al., Citation2021). This is what is termed the cryptocurrencies volatility index (VCRIX). While the VCRIX was the first scientifically backed proxy for the crypto-market (similar to the S&P 500), assessing forward-oriented risk in the crypto-currency market was a distinct difficulty (Kolesnikova, Citation2018). The VCRIX volatility index was intended to represent investor expectations about the cryptocurrency ecosystem, modeled after the “fear index” VIX for the American stock market.
Since its introduction, the literature on cryptocurrencies has picked a new direction, especially in the highly uncertain times of the COVID-19 pandemic, emerging as part of the new strands of literature on cryptocurrencies. The body of knowledge holds records of empirical works that use the VCRIX to measure investor sentiments in cryptocurrency markets (see, e.g., Anciaux et al., Citation2021; Dobrynskaya, Citation2021; Kim et al., Citation2021; Rubbaniy, Khalid et al., Citation2021; Rubbaniy, Polyzos et al., Citation2021). We now present highlights of studies from the emerging strand of works on cryptocurrencies that incorporate the VCRIX.
In their initial analysis of cryptocurrency liquidity connectedness and volatility regimes, although Anciaux et al. (Citation2021) discover a multitude of evidence of liquidity similarities between cryptocurrencies, especially when using order-book-based proxies to evaluate liquidity, the authors find better liquidity co-movements in high volatility regimes across all cryptocurrencies and for all liquidity proxies when volatility regimes based on the VCRIX volatility index on cryptocurrencies were added. Kim et al. (Citation2021) report that VCRIX creates a new crypto-currency volatility index based on the CRIX index that serves comparable services to VIX for the conventional market in the United States (S&P 500). The authors generated a VCRIX model, which was evaluated in a simulation using the S&P 500 ETF time series and exhibited a 78% correlation with the VIX, demonstrating the methodology’s feasibility.
From January 2015 to June 2020, Rubbaniy, Polyzos et al. (Citation2021) examined the herd effects in 101 cryptocurrencies in the COVID-19 era. The authors found no evidence of correlated trading when cryptocurrency-specific anxiety (VCRIX) is prevalent in the market, outside of the lockdown times. Rubbaniy, Khalid et al.’s (Citation2021) application of the wavelet coherence framework on the global COVID-19 fear index, cryptocurrency implied volatility index (VCRIX), and cryptocurrency returns adds to the inconclusive discussion on the safe-haven features of cryptocurrencies during COVID-19. The authors show that a non-financial market-based proxy of market stress, which represents household and retail investor fear, identifies cryptocurrencies as safe-haven assets; however, a financial market-based proxy of market turbulence identifies cryptocurrencies as traditional assets during the COVID-19 pandemic.
Intriguing observations from the VCRIX’s inclusion in recent empirical works suggest the significant role of the cryptocurrency implied volatility index in the fundamental dynamics between cryptocurrencies markets. This role of VCRIX is yet to be substantiated empirically given Rubbaniy, Khalid et al.’s results that indicate that cryptocurrencies’ potential to offer safe haven benefits during the COVID-19 amid the VCRIX is proxy-dependent. To assess the role of the measured risk of the cryptocurrency markets and the delivery of market status information (proxied by the VCRIX), we examine the influence of the cryptocurrency implied volatility on the fundamental relationship between two cryptocurrencies as well as the transmission of volatility inside individual crypto-markets. We also evaluate the degree of integration across all cryptocurrencies in the VCRIX at the same time.
As previously mentioned, wavelet analysis is an appealing instrument for examining localized disparities in power within a time series to define both prevailing modes of changeability and how the modes adjust in time via decomposition (Asafo-Adjei, Adam et al., Citation2021; Diallo et al., Citation2021; Frimpong et al., Citation2021; Owusu Junior et al., Citation2018; Tweneboah et al., Citation2019). Relative to existing works that only employ only bi-wavelet analysis (e.g., Qiao et al., Citation2020; Rubbaniy, Khalid et al., Citation2021), we explore the broad use of wavelet methods (i.e., bi- and partial wavelets, wavelet multiple correlations (WMC) and cross-correlations (WMCC)) to measure comovements or degree of integration between or among cryptocurrency indices in both the time- and frequency domains to accomplish this goal.
Notably, the emerging strand of literature establishes a common interdependence between cryptocurrencies and the VCRIX (Anciaux et al., Citation2021; Kim et al., Citation2021; Rubbaniy, Khalid et al., Citation2021). Premised on this, the conditional relationship between cryptocurrencies needs to be ascertained, and we achieve this using partial wavelet coherence, where VCRIX is treated as a covariate between any two pairs of cryptocurrencies (in our case, Bitcoin and other cryptocurrencies). Furthermore, although the empirical findings of Aharon et al. (Citation2021), and Katsiampa et al. (Citation2019) suggest interdependence and integration between cryptocurrencies, which imply the possibility for price gouging, the lead/lag markets are yet to be established empirically. The WMC and WMCC are utilized to ascertain the extent of integration between the sampled cryptocurrencies market, detailing the lead/lag cryptocurrency markets for effective risk management.
Theoretically, we complement existing studies by assessing the applicability of the adaptive, competitive, and heterogeneous markets hypotheses of Lo (Citation2004), Owusu Junior et al. (Citation2021), and Müller et al. (Citation1997), respectively, all of which support the use of the wavelet methodologies. The issues of possible price gouging in crypto markets and investor fears make this study timely.
3. Methodology
The bi-wavelet technique is essentially employed in this study to assess the time-frequency comovements of the study variables and also determine their lead–lag relationships. The partial wavelet in addition is utilized to assess the impact of VCRIX on the nexus between the cryptocurrencies. To investigate the degree of interconnectedness among cryptocurrencies and the VCRIX, the wavelet multiple techniques are employed. This is because interactions between the cryptocurrencies do not occur in isolation. As a result, an important factor, crucial to cryptocurrencies’ interaction, is necessary to be inculcated concurrently.
3.1. Bi-wavelet
For this section, we first consider the comovements between each cryptocurrency and VCRIX. Second, we assess the comovements between Bitcoin and the remaining cryptocurrencies, due to the former’s high market capitalization and the degree to offer high portfolio diversification. Although the second analysis is not the main focus of this study since it abounds in empirical studies, it is necessary to draw further inferences for other time-frequency techniques (partial wavelet) with VCRIX as the common interdependence.
3.1.1. Continuous Wavelet Transform (CWT)
The fundamentals of wavelet analysis comprise two factors: time or location and scale
, expressed below
where is the normalization factor, guaranteeing that the unit variance of the wavelet
|| is the location factor, offering the precise place of the wavelet; and
is the scale dilation factor, describing the stretched nature of the wavelet. The Morlet wavelet can be precise below
where the dominant frequency of the wavelet is denoted by . We set
at 6 (see, Asafo-Adjei et al., Citation2020; Citation2009).
A time series can be decomposed, based on a selected mother wavelet (Li et al., Citation2020) as
By sticking out the specific wavelet (
) onto the designated time series, we certainly attain
. Compatibly, the key benefit of a CWT is its facility to decompose and recreate the function x(t)
L2(
)
3.1.2. Wavelet Transform Coherence
The squared absolute value of a wavelet cross-spectrum normalization to a single spectrum of wavelet power is well known as the WTC (Torrence & Compo, Citation1998). Accordingly, the squared wavelet coefficient is stated as
where designates a smoothing factor, which balances resolution and significance, and
. A value near
stipulates a weak nexus, whereas a figure near
designates a strong co-movement. In the first instance of our analysis,
and
denote VCRIX and each cryptocurrency, respectively. The second instance of our bivariate analysis has
and
meaning Bitcoin and the remaining cryptocurrencies, respectively. There is a comprehensive co-movement between the series in the time-frequency perspective represented by wavelet analysis. A stronger reliance is established by a warmer identification. The nexus in this study is statistically scrutinized by the Monte Carlo procedure. This is not daunting because the theoretical distribution of the CWT coefficient is unidentified (Torrence & Compo, Citation1998).
3.1.3. WTC Phase difference
The wavelet transforms coherence phase difference indicates the disruptions in the fluctuation about the observed time series. Following Bloomfield et al. (Citation2004), the phase difference between x(t) and y(t) is characterized as below
where and
are the imaginary operators and real operators correspondingly. In the wavelet coherence map, the dimensional-phase pattern outlines the influence of the wavelet coherence difference. The dimensional arrows are utilized to differentiate diverse-phase patterns.
3.2. Partial Wavelet (PWc)
Partial Wavelet Coherence can help solve the problem of “pure” correlation between international stock markets and eradicate the impact of time series on the wavelet coherence amid
and
(Wu et al., Citation2020). We, specifically, perform the partial wavelet analysis to assess the possible impact of VCRIX on the interconnectedness between the cryptocurrencies. For this reason, we set the VCRIX as a control variable to investigate how it distorts the cryptocurrencies’ nexus.
Following Frimpong et al. (Citation2021), PWC can be designated using an equation analogous to the partial correlation squared, as
where ranges from 0 to 1. This section employs
and
to mean Bitcoin and the remaining cryptocurrencies’ returns, respectively, while
denotes the cryptocurrencies’ implied volatility index (VCRIX). Monte Carlo methods are used to estimate PWC.
3.3. Wavelet multiple (WM)
We employ the wavelet multiple as a frequency-dependent technique to examine the degree of integration among the cryptocurrencies and VCRIX instantaneously. Particularly, the WMC is important to divulge the extent to which all the variables are integrated across investment horizons without telling us the leading or lagging variable (Asafo-Adjei, Adam et al., Citation2021; Asafo-Adjei, Boateng et al., Citation2021). To provide an analytical view on the frequency-dependent lead–lag relationships, the WMCC is subsequently applied in the context of this study. We do all these in this current study because, the bi-wavelet and partial wavelet techniques are not enough to perform integration among more variables at the same time, wherein interactions between cryptocurrencies and VCRIX do not operate in isolation. Thus, if the cryptocurrencies, as well as VCRIX, commove across investment horizons, it is expected that major interactions could occur among them at the same time, revealing the financial markets integration phenomenon (Asafo-Adjei, Adam et al., Citation2021).
Let be a multivariate stochastic process and let
represent the resultant scale
wavelet coefficients attained by employing the MODWT. Fernández-Macho (Citation2012) outlines the WMC represent by
as a set of multiscale coherence calculated from
as follows. The square roots of the regression
are formed by the linear combination of
variables for which such R2 is maximum is calculated at each wavelet scale
. It is known from earlier studies that none of the auxiliary regressions ought to be run since the R2 conforms to the regression of a variable
on a set of predictors
can be represented as
, where
is the
diagonal element of the inverse of the thorough correlation matrix
. Hence, WMC is achieved as in EquationEq. (8
(8)
(8) )
where is the (n × n) correlation matrix of
With regards to the theory of regression, and the fitted values of as
, then the WMC can be expressed as EquationEq. (9
(9)
(9) )
where is selected to maximize
are the fitted values in the regression of
on the remaining wavelet coefficients at scale
.
We may define WMCC as generated by allowing a lag between observed and fitted values at each scale
below
The WMC and WMCC converge with the standard wavelet correlation and cross-correlation, where .
To estimate WMC and WMCC, we set the realization of the multivariate stochastic process to
be
Relating a MODWT of order
to each of the univariate time series {
, …,
}, for
, the
vectors of parameters of MODWT
is obtained.
From EquationEq. (10(10)
(10) ), a nonlinear function of all
wavelet correlations of scale
and a steady estimator of wavelet correlation from the MODWT can be represented by
We note that the covariances and variances of the wavelet can be expressed as
where : the regression of
on the same set of regressors
maximizes the R2,
denotes conforming fitted values, and
is the number of wavelet coefficients influenced by the boundary conditions associated with wavelet filter of length
and scale
but
is the number of wavelet parameters not influenced by the boundary conditions.
In the same vein, a consistent estimator of the WMCC can be computed as
In arriving at the required confidence interval (CI) of WMC, transformation designated as arctan , where arctan
is the inverse hyperbolic tangent function for simplicity’s sake, is applied (Asafo-Adjei, Adam et al., Citation2021; Fernández-Macho, Citation2012; Tweneboah, Citation2019). The CI is built on the same assumption of the realization of
in the estimation of WMC and WMCC and hence for
in equation (21), the
, where
, and
symbolize the folded normal distribution. Therefore, an imprecise (1 − α) CI is represented by
where the critical values
,
are:
and
with
as “the standard Gaussian probability distribution function” and
as the value of some WMC formulated under a null hypothesis of the absence of correlation.
3.4. Data sources and description
The study employed daily prices which are made up of cryptocurrencies; Bitcoin (BTC), Bitcoincash (BTCC), Ethereum (ETH), Litecoin (LTC), Ripple (XRP), Tether (TETH), and the cryptocurrencies volatility index (VCRIX). The daily data span from 2 August 2017 to 10 August 2021 yielding a total of 1,114 observations after cleaning the data for missing values. The suggested time frame was selected to encompass the aftermath of the 2007–2009 Global Financial Crisis, the US–China trade war and the COVID-19 pandemic. The cryptocurrencies were chosen for the given timeframe based on continuous data availability. The data on cryptocurrencies was obtained from Kraken as part of the centralized crypto exchanges (Alexander & Dakos, Citation2020). On the other hand, the VCRIX (Royalton CRIX Crypto Index)Footnote1 was gleaned from the website https://www.royalton-crix.com/ as developed by Royalton Partners. We employed spot price cryptocurrencies due to the high tendency for higher trading volume and longer trading hours globally (Baur & Dimpfl, Citation2019). As shown below, the study was based on daily returns of , where
is the unceasingly compounded return,
and
are current and preceding index correspondingly.
figure shows the time-varying prices and returns of cryptocurrencies and VCRIX. It can be observed from the plots that in the early part of 2020, the price series for the cryptocurrencies trend upwards, after a downward spike. That is, the prices of both cryptocurrencies are experiencing a rapid increase, which concurs with the assertion made by Zhang et al. (Citation2020), and Demir et al. (Citation2020) of markets rebound later in the COVID-19 periods since most businesses and economies have learnt how to survive. The fluctuations in the VCRIX is also shown to imitate shocks in the cryptocurrencies markets. This supports the assertion made by extant literature on the riskiness of cryptocurrencies (Das & Kannadhasan, Citation2018; Gil-Alana et al., Citation2020). The log-returns series in figure supports the stylized facts of asset returns thereby exhibiting volatility clustering.
Figure 1. Price (left) and returns (right) series of cryptocurrencies and VCRIX.
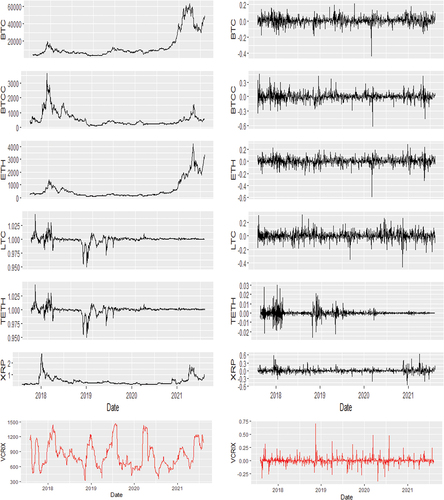
Table exhibits the preliminary statistics for the variables. The skewness values observed depict closer symmetry except for VCRIX and XRP. The returns of BTC, ETH and LTC are associated with more drawdowns as shown by the skewness values. On the other hand, kurtosis values further show the leptokurtic behavior of the cryptocurrency markets. The Jarque–Bera statistics reveal a statistical significance far from normality (p-value < 0.01). This is in line with several research on cryptocurrency return distributions (Shanaev & Ghimire, Citation2021; Szczygielski et al., Citation2020).
Table 1. Descriptive statistics
We further present an unconditional correlation between the cryptocurrencies’ returns and VCRIX returns in Table . It can be observed that the relationships between some of the cryptocurrencies’ returns are statistically significant and positive. On the other hand, some cryptocurrencies’ returns demonstrate weaker and insignificant relationships. The significant positive relationship explains the reason why it becomes practically impossible to diversify among some cryptocurrencies and, at worse, tend to transmit speculative bubbles to other financial assets (Asafo-Adjei, Owusu Junior et al., Citation2021; Gil-Alana et al., Citation2020). Notwithstanding, investors can still minimise their losses by forming relevant portfolios. Interestingly, the degree of associations between VCRIX and cryptocurrencies are weak and statistically insignificant, except for Tether, which is suggestive of portfolio diversification for the sampled period on average.
Table 2. Unconditional Correlation
4. Results and Discussion
The meaning of the scales in the care of data frequency of 5 days per week, , of the wavelet factors (Asafo-Adjei, Adam et al., Citation2021; Tweneboah, Citation2019; Tweneboah et al., Citation2019), are presented in Table .
Table 3. Interpretation of time-scales and frequencies
4.1. Time-frequencies
We present the statistical interpretations of the data with the aid of the “biwavelet” package obtained from Gouhier et al. (Citation2013). To ensure reliable elucidation of the data, right-pointing arrows and left-pointing arrows show when the commodities and the economic indicators are, respectively, in-phase (same directional movements) and anti-phase (opposite directional movements). Right-pointing arrows upwards and left-pointing arrows downwards designate that the earliest (first) variable is leading and vice versa for left-pointing arrows upwards and right-pointing arrows downwards. The interdependence between the matching series is represented by the surface color and the color palette. The red (warm) color signifies parts that have major interactions, while the blue (cold) color shows a lower series of correlations (Frimpong et al., Citation2021; Owusu Junior, Adam et al., Citation2021; Owusu Junior et al., Citation2018). The results outside the cone of influence (COI) are insignificant (see, Asafo-Adjei, Adam et al., Citation2021; Owusu Junior, Adam et al., Citation2021).
figure illustrates the comovements between VCRIX returns and six cryptocurrencies’ returns from 2017 to 2021. It can be analyzed from figure that VCRIX has a short-, medium-, and long-term nexus with cryptocurrencies. The right-pointing arrows indicate that an increase in the values of cryptocurrencies is related to an increase in the VCRIX. The positive comovements between VCRIX and cryptocurrencies occur in the long term for BTC (between 2017 and 2019), LTC (beyond 2017) and TETH (beyond 2017). The degree of these correlations makes diversification benefits between VCRIX and the said cryptocurrencies practically impossible. This indicates that investors may only find diversification, hedge and safe haven benefits at sections with negative comovements or fewer comovements between cryptocurrencies and the VCRIX, depending on the market conditions.
Figure 2. Comovements between VCRIX and cryptocurrencies.
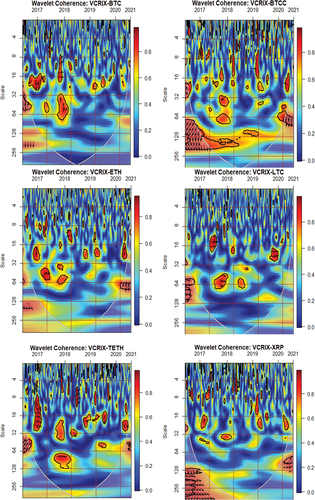
The right-pointing arrows upwards and left-pointing arrows downwards designate sections where the VCRIX is driving the cryptocurrencies. At this point, cryptocurrencies likely experience high fluctuations, which may lead to a loss of investment values. In the latter part of 2019 leading to 2020, there are few left-pointing arrows in the comovements between VCRIX and BTCC. This indicates that BTCC can act as a safe haven for most cryptocurrencies during the COVID-19 pandemic. Impliedly, we could infer—from the negative comovements—that the VCRIX may serve as a hedging proxy for cryptocurrencies (Baur & Lucey, Citation2010).
However, beyond the early section of 2020, there seem to be limited interdependencies between the VCRIX and the cryptocurrencies. The safe haven property of the cryptocurrencies is extinct which now supports the findings of Kristoufek (Citation2020), Gurdgiev and O’Loughlin (Citation2020), and Rubbaniy, Khalid et al. (Citation2021). During this period, investors may gain from diversification (Baur & Lucey, Citation2010). It is clear from Figure that investors may gain diversification benefits from long-term holdings of the cryptocurrencies (such as BTC, ETH, LTC and XRP) from 2017 to 2021 (Baur & Lucey, Citation2010), and effective risk management strategies across time and frequencies.
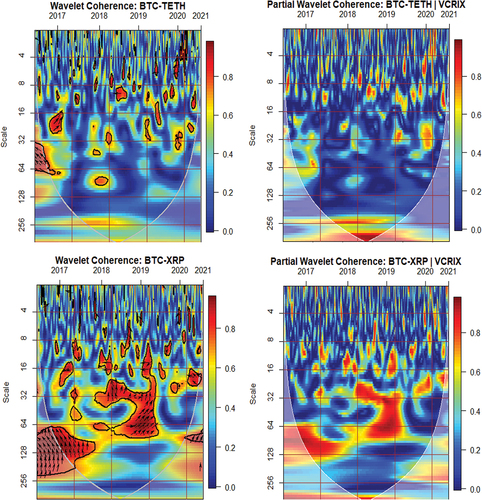
The influence of VCRIX on the comovements between BTC and other cryptocurrencies is presented in figure . There is a high interdependency between Bitcoin and the five other cryptocurrencies in the medium and long-term perspectives. These high comovements are characterized by right-pointing arrows indicating movement in-phase. These positive comovements signify that the behavior of BTC and the other cryptocurrencies are similar. In this regard, periods of high uncertainties or shocks in the cryptocurrencies occasion a fall in their values. This renders investors the inability to gain from forming a reliable portfolio between Bitcoin and the other cryptocurrencies.
Figure 3. Bi- and Partial wavelet interconnectedness of cryptocurrencies and VCRIX.
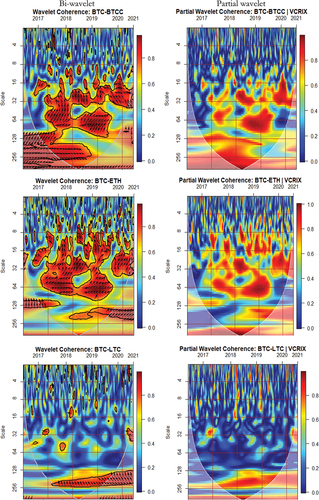
It can also be argued from that shocks in the BTC market, as the largest cryptocurrency, would cause poor performance of the remaining cryptocurrencies and vice-versa for a boom in the BTC market. It is therefore not daunting to see more right-pointing arrows upwards in most of the comovements. This indicates that the BTC market is a first-mover or a leader that responds to shocks before all other cryptocurrencies. In this sense, the behavior of the BTC drives the remaining cryptocurrencies to behave in a similar fashion. Specifically, there is a high interdependency between the BTC and two other currencies (BTCC and ETH), especially, in the medium- and long-terms. This is followed by XRP. This explains the varying levels of efficiencies within the cryptocurrencies markets (López-Martín et al., Citation2021). The relatively less persisting correlations between the BTC market and two other cryptocurrencies markets (LTC and TETH) signify that investors of these markets may have the potential to enjoy diversification benefits. The findings from the study support the works of Ji et al. (Citation2019) and Maiti et al. (Citation2020) who revealed high comovements among cryptocurrencies. The persisting correlation between BTC and the remaining cryptocurrencies exhibit long-range dependence. This is not daunting because Willinger et al. (Citation1999) indicate that long memory is widespread in nature, especially financial time series.
The VCRIX fail to drive the high persisting correlations between the cryptocurrencies as shown in the partial wavelet plots in figure . From the partial wavelet coherence plots, the degree of interdependence between pairs of cryptocurrencies assumes no change when implied volatility, measured by the VCRIX, is introduced as a covariate. Thus, the common interdependence for cryptocurrency markets’ volatilities (the VCRIX) does not significantly drive the relationship between selected pairs of cryptocurrencies. The implication is that idiosyncratic shocks may be more prevalent in individual cryptocurrency markets as opposed to those from their common interdependence. Consequently, the VCRIX may generally fail as a hedging proxy for cryptocurrencies, especially in the case where two or more cryptocurrencies are held in the same portfolio. The findings generally corroborate the conclusions of Gurdgiev and O’Loughlin (Citation2020), Kristoufek (Citation2020), and Rubbaniy, Khalid et al. (Citation2021) that there is little room for the VCRIX to impact cross-market linkages of cryptocurrencies.
Figure 3. (Continued)
4.2. Frequency-dependent analysis
4.2.1. Full sample
We subsequently present a frequency-dependent analysis for both cryptocurrency returns and VCRIX simultaneously to examine the degree of integration, interdependencies, and the leading or lagging variable over investment horizons for the sampled period. Although the time-frequency techniques supplied previously tell us what happens at every point in time (calendar time) and investment horizons (intrinsic times), it fails to reveal multiple interactions and the extent of averaged integration or interdependencies over the sampled period.
The frequency-dependent analysis is capable of revealing an average response of each variable to shocks from the other variable in the short, medium, and long terms, other than specifically providing calendar times. Thus, the frequency-dependent analysis enables us to perform a multiple analysis of the variables over investment horizons to accentuate the heterogeneous and adaptive behaviors of markets. Specifically, the WMC and WMCC techniques are utilized to reveal the degree of integration and interdependencies (leading or lagging), respectively. According to Fernández-Macho (Citation2012), the WMC and WMCC measure overall statistical interactions at various time scales for a set of observations on a multivariate random variable to provide better insights.
Given that cryptocurrency returns experience rapid oscillations, the wavelet multiple techniques employed in this study are capable of dealing with the heterogeneous behaviors of market participants, and deciphering as well as protecting against spurious correlation from simple assessments regarding possible associations with other variables (Fernández-Macho, Citation2012). We supplement the frequency-dependent discussion with the bivariate contemporary correlations (BCC) which is necessary for displaying averaged calendar time correlation for the sampled period, but at various investment horizons, and not necessarily integration or interdependencies (leading or lagging) among more variables at the same time.
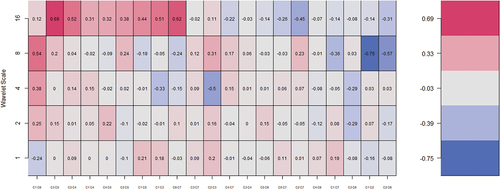
4.2.1.1. Bivariate contemporary correlations (BCC)
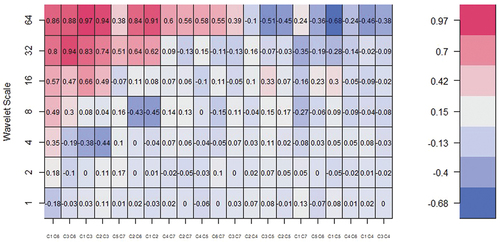
At 7 wavelet scales, the BCC is shown in figure . For calculating wavelet correlation coefficients, the horizontal axis displays the possible combinations. If we switch from left to right, the similarities between the pairs (C1-C7) become weaker. On the vertical axis, the wavelet scales reflect periods. The BCC matrix addresses the correlation between the realizations of two possible combinations of time series in the same period (Asafo-Adjei, Adam et al., Citation2021; Owusu Junior, Adam et al., Citation2021).
Figure 4. Wavelet bivariate correlations matrix. The codes for the variables are BTCC (C1), BTC (C2), ETH (C3), LTC (C4), TETH (C5), XRP (C6) and VCRIX (C7).
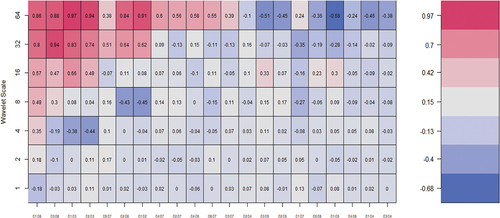
From figure , we present the BCC matrix for the cryptocurrencies and the VCRIX returns across the seven wavelet scales, which the results do not seem to differ significantly from the bivariate analysis. We find a mix of positive and negative relationships amid the pairs. For instance, BTCC and XRP demonstrated the maximum degrees of co-movement with parameters fluctuating over −0.18 to 0.86 at diverse time scales is around 0.44 indicating extreme correlational values. This is followed by ETH and XRP, BTCC and ETH, BTC and ETH, etc. The comovements between the cryptocurrencies are mostly positive from the monthly to quarterly scale representing medium- and long-term real economic transactions. This observation renders portfolio diversification impracticable between most cryptocurrency pairs due to contagion or the likelihood of speculative bubbles. This accentuates the high integration among cryptocurrencies as revealed by extant literature (Ji et al., Citation2019; Maiti et al., Citation2020).
However, the dynamics of the comovements is not the same for BTCC and VCRIX as a measure of investor fear and expectations in the cryptocurrencies markets. Thus, the VCRIX is capable of gauging fear into BTCC effectively in the short, medium, and long term. At most wavelet scales, the VCRIX demonstrates very weak negative comovements with the BTCC. Thus, the VCRIX acts as a potential hedging proxy for BTCC. Diversification benefits are not only limited to BTCC and VCRIX but also relevant pairs such as ETH and LTC, BTCC and LTC, XRP and LTC, etc. As a result, LTC becomes an effective hedge for most cryptocurrencies to partly support the outcome of Tiwari et al. (Citation2019).
4.2.1.2. Wavelet Multiple Correlations (WMC)
figure Table ) and figure (Table ) denote the WMC and WMCC, respectively, for the cryptocurrencies and VCRIX nexus returns series into frequency localization by the MODWT
Figure 5. Wavelet multiple correlations among cryptocurrencies and VCRIX. U-upper limits, L- lower (at 95% confidence interval).
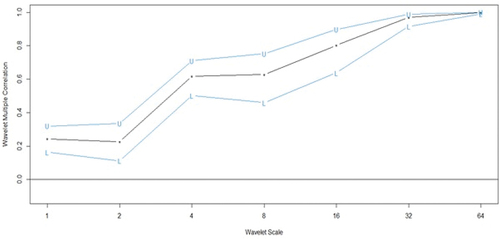
Figure 6. Wavelet multiple cross-correlations among cryptocurrencies and VCRIX.
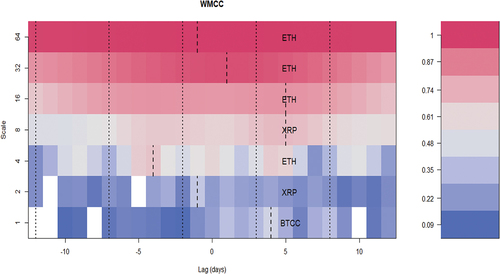
Table 4. Wavelet Multiple Correlations (WMC)
Table 5. Wavelet Multiple Cross Correlations (WMCC)
figure and Table capture the interdependencies among the cryptocurrencies and VCRIX in the short-, medium-, and long-term dynamics. The degree of interdependency is relatively high for the daily return series reaching as high as approximately 99.83% for the wavelet multiple correlations, 99.05% for the lower panel and 99.97% for the upper panel. There is a continuous augmentation in the WMC over the time horizon. Thus, monthly returns of one variable can be explained by the remaining variables to a degree of about 99.83% from daily, leading up to scale 64 interdependence. This accentuates the high convergence of cryptocurrencies’ returns in the long term, irrespective of the presence of VCRIX.
4.2.1.3. Wavelet Multiple Cross Correlations (WMCC)
The WMCC coefficients are presented in Table depicting seven wavelet scales. From figure , the scales at the y-axis have similar meanings as indicated at the preliminary stage of the wavelet multiple-analysis discussion. Following Asafo-Adjei, Adam et al. (Citation2021), Owusu Junior et al. (Citation2021), Asafo-Adjei et al. (Citation2021), and Boateng et al. (Citation2022) etc., the x-axis, however, represents the lag length of the series. In this case, 10 days for positive and negative lags each. Localizations at positive lag denote lagging variable, whereas negative lag denotes leading variable at the respective scales. At the zero-lag of localization, there is no lead or lag.
Localization implies the maximum values in the linear combination of all variables at the wavelet scales, which are indicated by dashed lines within the dotted lines (at all lags). A variable listed on a scale indicates the variable with the potential to lead or lag all the other variables. It implies that, at that scale, it has the maximum value in the linear combination of all the variables at the respective scales. The economic implication of the WMCC is that it indicates the degree of interdependence between the variables and determines the most influential variable at a specified wavelet scale to act as either a leading (first mover to respond to shocks) or lagging (the last variable to respond to shocks after the remaining variables) variable.
From figure (Table ), the BTCC lags at the intraweek scale. Also, XRP leads on the weekly scale but lags on the monthly scale representing short- and medium-term dynamics. We find that ETH leads or lags for most frequencies in the short (monthly scale), medium (quarterly to biannual scale), and long terms with high prospects for short-lived, intermediate and real economic transactions. This is to say, ETH is the dominant variable that has the potential to lead or lag the linear combination of the other variables, and may contribute to less market efficiency in the cryptocurrency.
We advocate that ETH acts as an effective hedge of heterogeneous localizations at various investment horizons. However, in the long term (at scale 64), ETH is the first variable to respond to shocks relative to all other variables. This renders the ETH market the most vulnerable to external shocks. This could be due to high performance within the ETH market over the years despite the intense competition it faces with other prominent cryptocurrencies. The outcome of the current study supports the time-varying comovements’ structure of cryptocurrencies (Bouri et al., Citation2021; Mensi et al., Citation2019). This deviates from the market efficiency of Fama (Citation1970) to respond to the HMH of Müller et al. (Citation1997) and the AMH by Lo (Citation2004). Findings from the study are in line with the assertion made by Owusu Junior et al. (Citation2021) that when financial markets become highly integrated, it becomes difficult for related adverse shocks to ensue contagion.
4.2.2. Pre-COVID-19 Pandemic
We carefully follow Boateng et al. (Citation2022) and Asafo-Adjei et al. (Citation2021) to obtain sub-samples for pre-COVID-19 pandemic and during the Pandemic. On this note, we segregate the full sample regarding the announcement made by the World Health Organization on the declaration of COVID-19 as a global pandemic on 11 March 2020. This is when the pandemic had reached its peak with its impact known to most economies and participants. Analysis for the pre-COVID-19 pandemic is conducted prior to the date of declaration. We do this to illustrate the extent of the convoluting impact of the pandemic on financial markets, specifically, the cryptocurrency markets. We present the wavelet bivariate correlations matrix for the pre-COVID-19 sample in figure .
Figure 7. Wavelet bivariate correlations matrix. The codes for the variables are BTCC (C1), BTC (C2), ETH (C3), LTC (C4), TETH (C5), XRP (C6) and VCRIX (C7).
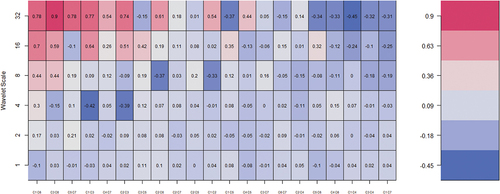
Prior to the COVID-19 pandemic, we find high comovements in the cryptocurrency markets in the long-term indicating real economic shocks. Specifically, BTCC correlates high with XRP, followed by ETH and XRP. Also, XRP and LTC commove with VCRIX and converge in the long term. It becomes important for existing investors to effectively hedge against volatilities in XRP and LTC due to similar dynamics with investor fear and expectations within the cryptocurrencies. On the other hand, VCRIX act as a potential hedging proxy for BTCC throughout the investment horizons, confirming the earlier findings. It can be observed that XRP was more associated with most cryptocurrencies, prior to the COVID-19 pandemic. Diversification benefits are found for assets combinations such as BTCC and VCRIX, ETH and LTC, BTCC and LTC, LTC and XRP, TETH and XRP, BTC and LTC, and XRP and VCRIX, as well as ETH and VCRIX, throughout the investment horizons.
figure and Table capture the interdependencies among the cryptocurrencies and VCRIX in the short-, medium-, and long-term dynamics prior to the COVID-19 pandemic.
Figure 8. Wavelet multiple correlations among cryptocurrencies and VCRIX.
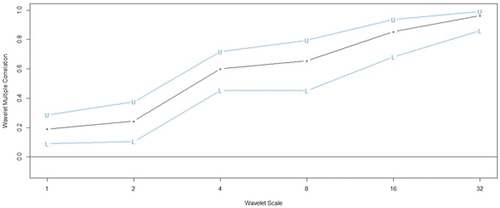
Table 6. Wavelet Multiple Correlations (WMC)
The degree of interdependency is relatively high for the daily return series reaching as high as approximately 96% for the wavelet multiple correlations, 86% for the lower panel and 99% for the upper panel. There is a continuous augmentation in the WMC over the time horizon. Thus, monthly returns of one variable can be explained by the remaining variables to a degree of about 96% from daily, leading up to scale 32 interdependence.
Findings from figure (Table ) reveal both lead and lag relationships among the cryptocurrencies’ returns and VCRIX returns prior to the COVID-19. Specifically, TETH lags in the short term, whereas ETH leads afterwards in the fortnightly scale. In the monthly, monthly to quarterly, and quarterly to biannual scales, we document lagging dynamics for XRP (at time 4), BTCC (at time 3) and ETH (at time 3), respectively. Prior to the pandemic, ETH acted as the first variable to respond to shocks in the short term (intraweek scale) before all other variables. In other words, for short-lived market transactions, ETH transmits shocks to the remaining variables after responding to shocks from other exogenous factors. Diversification benefits are prominent for ETH, and each of the remaining cryptocurrencies prior to the pandemic.
Figure 9. Wavelet multiple cross-correlations among cryptocurrencies and VCRIX.
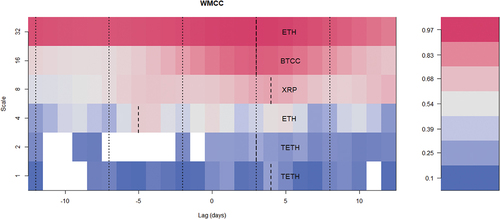
Table 7. Wavelet Multiple Cross Correlations (WMCC)
4.2.3. COVID-19 Pandemic Sample
From the short to long term, the comovements among the cryptocurrencies increase as shown in figure . The cryptocurrencies are highly correlated in the long term exhibiting real economic shocks relative to short-lived market dynamics. This is in line with the delayed responses of prices to information within the cryptocurrencies market. Specifically, BTCC is found to highly correlate with XRP, this is followed by ETH and TETH, BTC and LTC, BTCC and LTC, LTC and TETH, BTC and TETH, and BTCC and ETH. On the other hand, there exist low comovements among some cryptocurrencies such as BTC and XRP, BTCC and BTC, ETH and XRP, LTC and XRP, and TETH and XRP. This clearly shows that XRP is less associated with all the cryptocurrencies, except BTCC, relative to the pre-COVID-19 pandemic. For investors, a reliable portfolio can be formed among the less dissociated cryptocurrencies. This implies that it is not advisable to include the highly correlated cryptocurrencies in a single portfolio, especially, XRP and BTCC, in the COVID-19 pandemic. On the other hand, the VCRIX serves as a potential hedging proxy for cryptocurrencies due to low correlations.
Figure 10. Wavelet bivariate correlations matrix. The codes for the variables are BTCC (C1), BTC (C2), ETH (C3), LTC (C4), TETH (C5), XRP (C6) and VCRIX (C7).
The outcome from figure (Table ) indicates a low integration among the cryptocurrencies relative to the pre-COVID-19 pandemic period. This partly explains the adverse impact of the pandemic on most financial markets (Asafo-Adjei, Owusu Junior et al., Citation2021). In this regard, we advocate that the pandemic has altered the discourse of cryptocurrencies markets requiring rebalancing of portfolios and efficient allocation of financial assets. This is to say, the less integrated cryptocurrencies in the COVID-19 pandemic over the investment horizons becomes prominent for portfolio diversification potentials. Considering the pandemic period as financial market stress, we document safe haven benefits among most cryptocurrencies in the short and medium terms, which contradicts the outcome of Rubbaniy, Khalid et al. (Citation2021) that cryptocurrencies do not offer safe haven benefits during the COVID-19 when the VCRIX was employed.
Figure 11. Wavelet multiple correlations among cryptocurrencies and VCRIX.
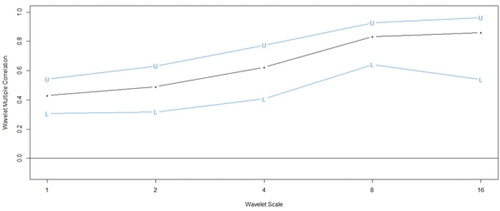
Table 8. Wavelet Multiple Correlations (WMC)
We document both lead and lag relationships among the cryptocurrencies’ returns and VCRIX returns during the COVID-19 as shown in figure (Table ). Specifically, BTCC lags in the short term, whereas XRP leads immediately after BTCC. In the fortnightly, monthly, and monthly to quarterly scales, we find that ETH (at time 4), BTC (at time −9) and ETH (at time −9), respectively, lags or lead. During the pandemic, ETH, BTC and XRP are the first variables to respond to shocks in their respective scales before all other cryptocurrencies and VCRIX. As a result, it is not advisable to include ETH, BTC and XRP in a single portfolio throughout the investment horizons of the pandemic. Analogously for our model, ETH, BTC and XRP act as a transmitter (leader) of shocks to the remaining cryptocurrencies and the VCRIX. Diversification benefits are prominent for each of ETH, BTC and XRP, and the remaining cryptocurrencies. Consequently, investors of ETH, BTC and XRP can find safe haven benefits in the pandemic using BTCC as an effective receiver (lagger) of shocks.
Figure 12. Wavelet multiple cross-correlations among cryptocurrencies and VCRIX.
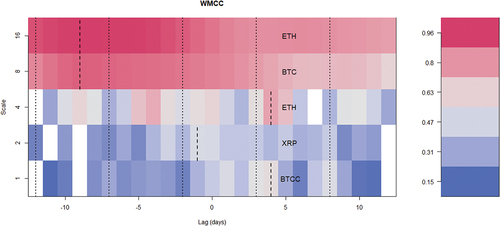
Table 9. Wavelet Multiple Cross Correlations (WMCC)
5. Theoretical and Practical Implications of Findings
Theoretically, under the tenets of the competitive market hypothesis of Owusu Junior et al. (Citation2021), it is natural to expect that spillovers and information flow between markets intensify during stressed market periods owing to practically suboptimal investor attitudes. Naturally, volatilities in asset prices respond to investors’ expectations and fear. The susceptibility of key market participants to engage in price gouging in cryptocurrency markets has attracted the attention of market players, particularly investors, in recent periods. This warrants that the fundamental dynamics between cryptocurrency markets stand the chance of being affected. Consequently, investigating the role of investor expectations and fears in the context of cryptocurrency markets is a timely response to a critical problem in erratic times like the era of the COVID-19 pandemic.
As a forward-looking risk in the cryptocurrency markets, the VCRIX acts as a proxy on two occasions, tranquil and turbulent trading periods. On a pairwise basis, the comovement of a cryptocurrency and the VCRIX facilitate the assessment of the safe haven (hedging) role of implied volatilities in cryptocurrency markets. Having revealed a fluctuating and cryptocurrency-dependent relationship between the VCRIX and cryptocurrencies, it is impractical for investors to rely on a single cryptocurrency to hedge market volatilities resulting from investor expectations and fear in cryptocurrencies’ markets. Similarly, we divulge that not only could we assess the role of cryptocurrencies as either a hedge or safe haven for implied market volatilities, but we could also infer from their relationships the role of the implied volatility indices (i.e., the VCRIX) as a hedging proxy for worse-performing cryptocurrencies across trading periods. From this perspective, the results of the study underscore the role of VCRIX as a proxy diversifier, hedge, and safe haven instrument for cryptocurrencies although the efficacy of such roles is scale- or frequency-dependent. This explains why despite the high connectedness of cryptocurrencies amid the VCRIX (from the wavelet multiple correlations), the wavelet bivariate contemporary correlations (BCC) show moderate-to-low coherence between cryptocurrencies and VCRIX.
In the definitions of Baur and Lucey (Citation2010), insights from the BCC analysis indicate that positive but mild correlations between VCRIX and cryptocurrencies imply that VCRIX serves as a diversifier proxy for cryptocurrencies and vice versa. Intuitively, positive (but not perfect) correlations between cryptocurrencies and VCRIX are a signal for investors to take up diversification advantages by including the proxied diversifier in their cryptocurrency-dominated portfolios. Conversely, negative or the absence of correlations are indications of hedging and safe haven roles of the VCRIX during tranquil and turbulent trading periods, respectively. As a result, in investment cycles where VCRIX and cryptocurrencies show no or negative correlations (Baur & Lucey, Citation2010), it is practically optimal for investors to consider the inclusion of the actual assets that are proxied by the VCRIX in their cryptocurrency-dominated portfolios. Notwithstanding, investors must note that a strategic and time-based portfolio rebalancing is required for optimal allocations between the primary assets in their portfolios and the diversifier, safe haven, or hedge instruments proxied by the VCRIX.
Furthermore, with deductions from market efficiency (Fama, Citation1970), we expect that in a stressed trading period like the COVID-19 pandemic, similar comovements are revealed between cryptocurrency implied volatility (VCRIX) and cryptocurrencies. The inconsistent comovement between these assets and their measure of implied volatility (i.e., the VCRIX) point to the fact that the cryptocurrency markets are inefficient in the COVID-19 pandemic era (López-Martín et al., Citation2021). Consequently, there is room for investors to trade on arbitrage, where gains could be made based on the favorable differential proceeds from the concurrent purchases and sale of cryptocurrencies in different markets. Therefore, price gouging with cryptocurrencies may be prevalent in crisis periods (Gandal et al., 2018; Katsiampa et al., Citation2019).
Summarily, in an ecosystem of cryptocurrencies, where trade uncertainties are common among market participants, gains from the trade of multiple cryptocurrencies rest in the long term for the average investor or institutional investors, whereas arbitragers and speculators may gain from short-term trading. Hedging, safe haven and diversification could be proxied by the VCRIX but they all require time and frequency-based assessments to warrant effective rebalancing where necessary. Notwithstanding, competing for different assets—in the cryptocurrency ecosystem—during stressed market periods warrants assessments of idiosyncratic risks, market efficiency, and market participants’ adaptability and risk-reward trade-off preferences as supported by the competitive market hypothesis (Owusu Junior, Frimpong et al., Citation2021), the adaptive (Lo, Citation2004) and heterogeneous (Müller et al., Citation1997) markets hypotheses.
6. Conclusion
The study utilizes the wavelet techniques—bi-wavelet, partial wavelet, and multiple wavelets to assess the comovements between cryptocurrencies amidst the cryptocurrency volatility index as a measure to gauge fear into the cryptocurrency markets. The daily data span from 2 August 2017 to 10 August 2021 yielding a total of 1,114 observations after cleaning the data for missing values. The suggested time frame was chosen to encompass the aftermath of the 2007–2009 global financial crisis, the US–China trade war, and the COVID-19 pandemic. The purpose of the study was to assess the comovements between cryptocurrencies and the volatility index through the bi-wavelet, the impact of the volatility index on the comovements between the cryptocurrencies through both the bi-wavelet and partial wavelet and assess the degree of integration among the cryptocurrencies amidst the volatility index through the WMC and WMCC techniques. The wavelet techniques employed in this study are consistent with the heterogeneous market hypothesis (HMH) of Müller et al. (Citation1997) and the adaptive market hypothesis (AMH) by Lo (Citation2004).
Findings from the study provide that the comovements between the cryptocurrencies and VCRIX are high across investment horizons as indicated by the bi-wavelet. The VCRIX as a measure of investor fear and uncertainty was found to transmit bubbles to most cryptocurrencies. As a result, investors of cryptocurrencies should be vigilant and employ effective risk management strategies across time and frequencies to mitigate shocks from the VCRIX. Consequently, a potential hedge with the VCRIX is practically impossible for multiple cryptocurrencies in the same portfolio, but it is most preferred as a significant predictor of cryptocurrencies’ returns. This would therefore provide signals to investors to rebalance their portfolios or for effective asset allocation across investment horizons while taking note of existing market conditions.
Furthermore, the comovements between the cryptocurrencies indicate high comovements between the Bitcoin market and most cryptocurrencies (BTCC, XRP and ETH). The relatively less persisting correlations between the Bitcoin market and three other cryptocurrencies markets (LTC and TETH) signify that investors of these markets may enjoy diversification benefits. Generally, the strong correlations between Bitcoin and most cryptocurrencies from the short-, medium-, and long-terms exhibit long memory dynamics. The VCRIX fails to drive the high comovements between the cryptocurrencies as shown in the partial wavelet analysis. These findings divulge that rather than their common interdependence (i.e., the implied volatility index of cryptocurrencies (VCRIX)), the high fluctuations in the cryptocurrencies markets emanate from idiosyncratic shocks (Aharon et al., Citation2021) transmitted by individual cryptocurrencies and this renders most investors reluctant to invest in these markets.
In addition, the BCC and the WMC indicated high integrations among cryptocurrencies. However, these relations may be distorted by the VCRIX which depicts negative integration with the cryptocurrencies as revealed by the BCC analysis. In this sense, investors may hedge against the adverse impact of the VCRIX across investment horizons. It is not daunting that VCRIX could not lead or lag the interdependencies among the cryptocurrencies in the WMCC analysis. This suggests that, when there is high integration among financial markets, it becomes difficult for adverse shocks to penetrate the combined assets, except in the case of individual assets. This denotes that investors can form a reliable portfolio with all the cryptocurrencies, and would have a high potential of minimizing their investment risk due to their heterogeneous dynamics of comovements and degree of integration across time and frequencies. As posited by Guasoni and Wong (Citation2020), financial integration improves welfare.
Findings from the study, therefore, divulge that investing in a single or few cryptocurrencies is highly risky due to the adverse impact of the VCRIX on individual cryptocurrencies. However, investors are likely to gain from diversification, safe haven and hedge benefits, depending on the market conditions, when they choose several cryptocurrencies. More importantly, the behavior of the VCRIX across both time and frequency domains offers insightful signals for investors of cryptocurrency-dominated assets to embark on timely portfolio rebalancing to achieve diversification, safe haven, or hedging advantages depending on the market conditions.
Investors should be wary of the idiosyncratic shocks of cryptocurrencies coupled with possible arbitrage opportunities that may persist in cryptocurrency markets particularly in turbulent periods to ensure effective trading decisions and adjustment of portfolio allocations across diverse investment horizons. Going forward, policymakers and practitioners should strategically regulate the cryptocurrency ecosystem to mitigate the possibility of price gouging, which could wipe off the interest of investors in cryptocurrencies.
Further studies may employ multi-frequency analysis through an effective non-linear causality technique since multi-scales are richer in information. This study may be extended to other financial markets to examine the pattern of causality and degree of integration.
Data availability
The data in relation to the findings of this study are available upon request.
Disclosure statement
No potential conflict of interest was reported by the author(s).
Additional information
Funding
Notes on contributors
Samuel Kwaku Agyei
Samuel Kwaku Agyei, Professor Anokye Mohammed Adam, Mr Ahmed Bossman, Dr Peterson Owusu Junior, and Mr Emmanuel Asafo-Adjei are researchers at the Department of Finance, School of Business, University of Cape Coast, Ghana. They have published related articles in referred journals and have contributed immensely to academics. Mr Oliver Asiamah is a postgraduate student at the Laboratoire d’Analyse et de Prospective Economiques, Universite de Limoges, Limoges, France. Ms Roberta Asafo-Adjei, is a postgraduate student at the Department of Finance, School of Business, Kwame Nkrumah University of Science and Technology.
Notes
1. Details on the methodology and sources for the Royalton CRIX Crypto Index for earlier years could be fetched from https://www.royalton-crix.com/
References
- Aharon, D. Y., Umar, Z., & Vo, X. V. (2021). Dynamic spillovers between the term structure of interest rates, bitcoin, and safe‑haven currencies. Financial Innovation, 7(59), 1–34. https://doi.org/10.1186/s40854-021-00274-w
- Alexander, C., & Dakos, M. (2020). A critical investigation of cryptocurrency data and analysis. Quantitative Finance, 20(2), 173–188. https://doi.org/10.1080/14697688.2019.1641347
- Anciaux, H., Desagre, C., Nicaise, N., & Petitjean, M. (2021). Liquidity co-movements and volatility regimes in cryptocurrencies. Available at SSRN 3769309.
- Asafo-Adjei, E., Adam, A. M., & Darkwa, P. (2021). Can crude oil price returns drive stock returns of oil producing countries in Africa? Evidence from bivariate and multiple wavelet. Macroeconomics and Finance in Emerging Market Economies, 1–19. https://doi.org/10.1080/17520843.2021.1953864
- Asafo-Adjei, E., Agyapong, D., Agyei, S. K., Frimpong, S., Djimatey, R., Adam, A. M., & Ma, J. (2020). Economic policy uncertainty and stock returns of Africa: A wavelet coherence analysis. Discrete Dynamics in Nature and Society, 2020, 1–8. https://doi.org/10.1155/2020/8846507
- Asafo-Adjei, E., Boateng, E., Isshaq, Z., Idun, A. A. A., Owusu Junior, P., Adam, A. M., & Trinidad Segovia, J. E. (2021). Financial sector and economic growth amid external uncertainty shocks: Insights into emerging economies. PLoS one, 16(11), e0259303. https://doi.org/10.1371/journal.pone.0259303
- Asafo-Adjei, E., Owusu Junior, P., & Adam, A. M. (2021). Information flow between Global Equities and Cryptocurrencies: A VMD-based entropy evaluating shocks from COVID-19 pandemic. Complexity, 2021. https://doi.org/10.1155/2021/4753753
- Baur, D. G., & Dimpfl, T. (2019). Price discovery in bitcoin spot or futures? Journal of Futures Markets, 39(7), 803–817. https://doi.org/10.1002/fut.22004
- Baur, D. G., & Lucey, B. M. (2010). Is gold a hedge or a safe haven? An analysis of stocks, bonds and gold. Financial Review, 45(2), 217–229. https://doi.org/10.1111/j.1540-6288.2010.00244.x
- Bloomfield, D. S., McAteer, R. J., Lites, B. W., Judge, P. G., Mathioudakis, M., & Keenan, F. P. (2004). Wavelet phase coherence analysis: Application to a quiet-sun magnetic element. The Astrophysical Journal, 617(1), 623. https://doi.org/10.1086/425300
- Boateng, E., Asafo-Adjei, E., Addison, A., Quaicoe, S., Yusuf, M. A., Adam, A. M., & Adam, A. M. (2022). Interconnectedness among commodities, the real sector of Ghana and external shocks. Resources Policy, 75, 102511. https://doi.org/10.1016/j.resourpol.2021.102511
- Bohte, R., & Rossini, L. (2019). Comparing the forecasting of cryptocurrencies by Bayesian time-varying volatility models. Journal of Risk and Financial Management, 12(3), 150. https://doi.org/10.3390/jrfm12030150
- Borri, N. (2019). Conditional tail-risk in cryptocurrency markets. Journal of Empirical Finance, 50, 1–19. https://doi.org/10.1016/j.jempfin.2018.11.002
- Bossman, A., Agyei, S. K., Owusu Junior, P., Agyei, E. A., Akorsu, P. K., Marfo-Yiadom, E., Amfo-Antiri, G., & Gubareva, M. (2022). Flights-to-and-from-quality with Islamic and conventional bonds in the COVID-19 pandemic era: ICEEMDAN-based transfer entropy. Complexity, 2022, 1–25. https://doi.org/10.1155/2022/1027495
- Bossman, A., & Ferreira, P. J. S. (2021). Information flow from COVID-19 pandemic to Islamic and conventional equities: An ICEEMDAN-induced transfer entropy analysis. Complexity, 2021, 1–20. https://doi.org/10.1155/2021/4917051
- Bouri, E., Vo, X. V., & Saeed, T. (2021). Return equicorrelation in the cryptocurrency market: Analysis and determinants. Finance Research Letters, 38, 101497. https://doi.org/10.1016/j.frl.2020.101497
- Campbell, J. Y., & Hentschel, L. (1992). No news is good news: An asymmetric model of changing volatility in stock returns. Journal of Financial Economics, 31(3), 281–318. https://doi.org/10.1016/0304-405X(92)90037-X
- Cevik, S., & Ozturkkal, B. (2020). Contagion of Fear: Is the Impact of COVID-19 on Sovereign Risk Really Indiscriminate? IMF Working Papers, 20(263). https://doi.org/10.5089/9781513561578.001
- Cheikh, N. B., Zaied, Y. B., & Chevallier, J. (2020). Asymmetric volatility in cryptocurrency markets: New evidence from smooth transition GARCH models. Finance Research Letters, 35, 101293. https://doi.org/10.1016/j.frl.2019.09.008
- Chen, J. (2002, May). Intertemporal CAPM and the cross-section of stock returns. In EFA 2002 Berlin Meetings Discussion Paper.
- Chen, T., Lau, C. K. M., Cheema, S., & Koo, C. K. (2021). Economic Policy Uncertainty in China and Bitcoin Returns: Evidence From the COVID-19 Period. Frontiers in Public Health, 9, 140. https://doi.org/10.3389/fpubh.2021.651051
- Chen, C., Liu, L., & Zhao, N. (2020). Fear sentiment, uncertainty, and bitcoin price dynamics: The case of COVID-19. Emerging Markets Finance and Trade, 56(10), 2298–2309. https://doi.org/10.1080/1540496X.2020.1787150
- Conlon, T., & McGee, R. (2020). Safe haven or risky hazard? Bitcoin during the COVID-19 bear market. Finance Research Letters, 35, 101607. https://doi.org/10.1016/j.frl.2020.101607
- Corbet, S., Larkin, C., & Lucey, B. (2020). The contagion effects of the COVID-19 pandemic: Evidence from gold and cryptocurrencies. Finance Research Letters, 35, 101554. https://doi.org/10.1016/j.frl.2020.101554
- Das, D., & Kannadhasan, M. (2018). Do global factors impact bitcoin prices? Evidence from wavelet approach. Journal of Economic Research, 23, 227–264.
- Demir, E., Bilgin, M. H., Karabulut, G., & Doker, A. C. (2020). The relationship between cryptocurrencies and COVID-19 pandemic. Eurasian Economic Review, 10(3), 349–360. https://doi.org/10.1007/s40822-020-00154-1
- Diallo, O. K., Mendy, P., & Burlea-Schiopoiu, A. (2021). A method to test weak-form market efficiency from sectoral indices of the WAEMU stock exchange: A wavelet analysis. Heliyon, 7(1), e05858. https://doi.org/10.1016/j.heliyon.2020.e05858
- Dobrynskaya, V. (2021). Cryptocurrencies Meet Equities: Risk Factors and Asset Pricing Relationships. SSRN Electronic Journal. Available at SSRN 3877248. https://doi.org/10.2139/ssrn.3877248
- Enilov, M., Fazio, G., & Ghoshray, A. (2021). Global connectivity between commodity prices and national stock markets: A time‐varying MIDAS analysis. International Journal of Finance & Economics. https://doi.org/10.1002/ijfe.2552
- Fama, E. F. (1970). Efficient market hypothesis: A review of theory and empirical work. The Journal of Finance, 25(2), 28–30. https://doi.org/10.2307/2325486
- Fernández-Macho, J. (2012). Wavelet multiple correlation and cross-correlation: A multiscale analysis of Eurozone stock markets. Physica A: Statistical Mechanics and Its Applications, 391(4), 1097–1104. https://doi.org/10.1016/j.physa.2011.11.002
- Frimpong, S., Gyamfi, E. N., Ishaq, Z., Kwaku Agyei, S., Agyapong, D., & Adam, A. M. (2021). Can Global Economic Policy Uncertainty Drive the Interdependence of Agricultural Commodity Prices? Evidence from Partial Wavelet Coherence Analysis. Complexity, 2021.
- Fry, J., & Cheah, E. T. (2016). Negative bubbles and shocks in cryptocurrency markets. International Review of Financial Analysis, 47, 343–352. https://doi.org/10.1016/j.irfa.2016.02.008
- Gil-Alana, L. A., Abakah, E. J. A., & Rojo, M. F. R. (2020). Cryptocurrencies and stock market indices. Are they related? Research in International Business and Finance, 51, 101063. https://doi.org/10.1016/j.ribaf.2019.101063
- Goodell, J. W., & Goutte, S. (2020). Diversifying with cryptocurrencies during COVID-19. Available at SSRN 3631971.
- Gouhier, T. C., Grinsted, A., Simko, V., Gouhier, M. T. C., & Rcpp, L. (2013). Package ‘biwavelet’. Spectrum, 24, 2093–2102.
- Guasoni, P., & Wong, K. C. (2020). Asset prices in segmented and integrated markets. Finance and Stochastics, 24(4), 939–980. https://doi.org/10.1007/s00780-020-00433-4
- Gurdgiev, C., & O’Loughlin, D. (2020). Herding and anchoring in cryptocurrency markets: Investor reaction to fear and uncertainty. Journal of Behavioral and Experimental Finance, 25, 100271. https://doi.org/10.1016/j.jbef.2020.100271
- Ji, Q., Bouri, E., Lau, C. K. M., & Roubaud, D. (2019). Dynamic connectedness and integration in cryptocurrency markets. International Review of Financial Analysis, 63, 257–272. https://doi.org/10.1016/j.irfa.2018.12.002
- Katsiampa, P., Corbet, S., & Lucey, B. (2019). High frequency volatility co-movements in cryptocurrency markets. Journal of International Financial Markets, Institutions and Money, 62, 35–52. https://doi.org/10.1016/j.intfin.2019.05.003
- Kim, A., Trimborn, S., & Härdle, W. K. (2021). VCRIX—A volatility index for crypto-currencies. International Review of Financial Analysis, 78, 101915. https://doi.org/10.1016/j.irfa.2021.101915
- Kolesnikova, A. (2018). VCRIX-volatility index for crypto-currencies on the basis of CRIX (Master’s thesis, Humboldt-Universität zu).
- Kristoufek, L. (2020). Grandpa, grandpa, tell me the one about Bitcoin being a safe haven: Evidence from the COVID-19 pandemics. Frontiers in Physics, 8. arXiv preprint arXiv:2004.00047. https://doi.org/10.3389/fphy.2020.00296
- Le Tran, V., & Leirvik, T. (2020). Efficiency in the markets of crypto-currencies. Finance Research Letters, 35, 101382. https://doi.org/10.1016/j.frl.2019.101382
- Li, R., Li, S., Yuan, D., & Yu, K. (2020). Does economic policy uncertainty in the US influence stock markets in China and India? Time-frequency evidence. Applied Economics, 52(39), 4300–4316. https://doi.org/10.1080/00036846.2020.1734182
- Liu, J., & Serletis, A. (2019). Volatility in the cryptocurrency market. Open Economies Review, 30(4), 779–811. https://doi.org/10.1007/s11079-019-09547-5
- Lo, A. W. The adaptive markets hypothesis. (2004). The Journal of Portfolio Management, 30(1), 15–29. Retrieved. https://doi.org/10.3905/jpm.2004.442611
- López-Martín, C., Benito Muela, S., & Arguedas, R. (2021). Efficiency in cryptocurrency markets: New evidence. Eurasian Economic Review, 11(3), 403–431. https://doi.org/10.1007/s40822-021-00182-5
- Maiti, M., Vukovic, D., Krakovich, V., & Pandey, M. K. (2020). How integrated are cryptocurrencies. International Journal of Big Data Management, 1(1), 64–80. https://doi.org/10.1504/IJBDM.2020.106874
- Mariana, C. D., Ekaputra, I. A., & Husodo, Z. A. (2021). Are Bitcoin and Ethereum safe-havens for stocks during the COVID-19 pandemic? Finance Research Letters, 38, 101798. https://doi.org/10.1016/j.frl.2020.101798
- Mensi, W., Lee, Y. J., Al-Yahyaee, K. H., Sensoy, A., & Yoon, S. M. (2019). Intraday downward/upward multifractality and long memory in Bitcoin and Ethereum markets: An asymmetric multifractal detrended fluctuation analysis. Finance Research Letters, 31, 19–25. https://doi.org/10.1016/j.frl.2019.03.029
- Mnif, E., & Jarboui, A. (2021). COVID-19, bitcoin market efficiency, herd behaviour. Review of Behavioral Finance, 150, 6–9. https://doi.org/10.1108/RBF-09-2020-0233
- Mnif, E., Jarboui, A., & Mouakhar, K. (2020). How the cryptocurrency market has performed during COVID 19? A multifractal analysis. Finance Research Letters, 36, 101647. https://doi.org/10.1016/j.frl.2020.101647
- Müller, U. A., Dacorogna, M. M., Davé, R. D., Olsen, R. B., Pictet, O. V., & Von Weizsäcker, J. E. (1997). Volatilities of different time resolutions—analyzing the dynamics of market components. Journal of Empirical Finance, 4 (2–3), 213–239. https://www.sciencedirect.com/science/article/pii/S0927539897000078
- Nguyen Quang, B., Le, T. H., & Nguyen Phuc, C. (2020). Influences of uncertainty on the returns and liquidity of cryptocurrencies: Evidence from a portfolio approach. International Journal of Finance & Economics. https://doi.org/10.1002/ijfe.2283
- Nguyen, H., Liu, B., & Parikh, N. Y. (2020). Exploring the short-term momentum effect in the cryptocurrency market. Evolutionary and Institutional Economics Review, 17(2), 425–443. https://doi.org/10.1007/s40844-020-00176-z
- Omane-Adjepong, M., Alagidede, P., & Akosah, N. K. (2019). Wavelet time-scale persistence analysis of cryptocurrency market returns and volatility. Physica A: Statistical Mechanics and Its Applications, 514, 105–120. https://doi.org/10.1016/j.physa.2018.09.013
- Owusu Junior, P., Adam, A. M., Asafo-Adjei, E., Boateng, E., Hamidu, Z., & Awotwe, E. (2021). Time-frequency domain analysis of investor fear and expectations in stock markets of BRIC economies. Heliyon, 7(10), e08211. https://doi.org/10.1016/j.heliyon.2021.e08211
- Owusu Junior, P., Adam, A. M., Tweneboah, G., & McMillan, D. (2020). Connectedness of cryptocurrencies and gold returns: Evidence from frequency-dependent quantile regressions. Cogent Economics & Finance, 8(1), 1804037. https://doi.org/10.1080/23322039.2020.1804037
- Owusu Junior, P., Adam, A. M., Tweneboah, G., & Soo, K. T. (2017). Co-movement of real exchange rates in the West African Monetary Zone. Cogent Economics & Finance, 5(1), 1351807. https://doi.org/10.1080/23322039.2017.1351807
- Owusu Junior, P., Frimpong, S., Adam, A. M., Agyei, S. K., Gyamfi, E. N., Agyapong, D., & Tweneboah, G. (2021). COVID-19 as Information Transmitter to Global Equity Markets: Evidence from CEEMDAN-Based Transfer Entropy Approach. Mathematical Problems in Engineering, 2021. https://doi.org/10.1155/2021/8258778
- Owusu Junior, P., Kwaku Boafo, B., Kwesi Awuye, B., Bonsu, K., Obeng-Tawiah, H., & McMillan, D. (2018). Co-movement of stock exchange indices and exchange rates in Ghana: A wavelet coherence analysis. Cogent Business & Management, 5(1), 1481559. https://doi.org/10.1080/23311975.2018.1481559
- Popper, N. (2015). Digital gold: The untold story of Bitcoin. Penguin UK.
- Qiao, X., Zhu, H., & Hau, L. (2020). Time-frequency co-movement of cryptocurrency return and volatility: Evidence from wavelet coherence analysis. International Review of Financial Analysis, 71, 101541. https://doi.org/10.1016/j.irfa.2020.101541
- Rua, A., & Nunes, L. C. (2009). International movement of stock market returns: A wavelet analysis. Journal of Empirical Finance, 16(4), 632–639. https://doi.org/10.1016/j.jempfin.2009.02.002
- Rubbaniy, G., Khalid, A. A., & Samitas, A. (2021). Are Cryptos Safe-Haven Assets during Covid-19? Evidence from Wavelet Coherence Analysis. Emerging Markets Finance and Trade, 57(6), 1741–1756. https://doi.org/10.1080/1540496X.2021.1897004
- Rubbaniy, G., Polyzos, S., Rizvi, S. K. A., & Tessema, A. (2021). COVID-19, Lockdowns and herding towards a cryptocurrency market-specific implied volatility index. Economics Letters, 207, 110017. https://doi.org/10.1016/j.econlet.2021.110017
- Sami, M., & Abdallah, W. (2020). How does the cryptocurrency market affect the stock market performance in the MENA region? Journal of Economic and Administrative Sciences, 37(4), 741–753. https://doi.org/10.1108/JEAS-07-2019-0078
- Shahzad, S. J. H., Bouri, E., Roubaud, D., Kristoufek, L., & Lucey, B. (2019). Is Bitcoin a better safe-haven investment than gold and commodities? International Review of Financial Analysis, 63, 322–330. https://doi.org/10.1016/j.irfa.2019.01.002
- Shanaev, S., & Ghimire, B. (2021). A fitting return to fitting returns: Cryptocurrency distributions revisited. SSRN Electronic Journal. https://doi.org/10.2139/ssrn.3847351
- Szczygielski, J., Karathanasopoulos, A., & Zaremba, A. (2020). One shape fits all? A comprehensive examination of cryptocurrency return distributions. Applied Economics Letters, 27(19), 1567–1573. https://doi.org/10.1080/13504851.2019.1697420
- Tiwari, A. K., Raheem, I. D., & Kang, S. H. (2019). Time-varying dynamic conditional correlation between stock and cryptocurrency markets using the copula-ADCC-EGARCH model. Physica A: Statistical Mechanics and Its Applications, 535, 122295. https://doi.org/10.1016/j.physa.2019.122295
- Torrence, C., & Compo, G. P. (1998). A practical guide to wavelet analysis. Bulletin of the American Meteorological Society, 79(1), 61–78. https://doi.org/10.1175/1520-0477(1998)079<0061:APGTWA>2.0.CO;2
- Tweneboah, G. (2019). Dynamic interdependence of industrial metal price returns: Evidence from wavelet multiple correlations. Physica A: Statistical Mechanics and Its Applications, 527, 121153. https://doi.org/10.1016/j.physa.2019.121153
- Tweneboah, G., Owusu Junior, P., & Oseifuah, E. K. (2019). Integration of Major African Stock Markets: Evidence From Multi-Scale Wavelets Correlation. Academy of Accounting and Financial Studies Journal, 23(6), 1–15.
- Willinger, W., Taqqu, M. S., & Teverovsky, V. (1999). Stock market prices and long-range dependence. Finance and Stochastics, 3(1), 1–13. https://doi.org/10.1007/s007800050049
- Wu, K., Zhu, J., Xu, M., & Yang, L. (2020). Can crude oil drive the co-movement in the international stock market? Evidence from partial wavelet coherence analysis. The North American Journal of Economics and Finance, 53, 101194. https://doi.org/10.1016/j.najef.2020.101194
- Yarovaya, L., Brzeszczyński, J., & Lau, C. K. M. (2016). Intra-and inter-regional return and volatility spillovers across emerging and developed markets: Evidence from stock indices and stock index futures. International Review of Financial Analysis, 43, 96–114. https://doi.org/10.1016/j.irfa.2015.09.004
- Zhang, D., Hu, M., & Ji, Q. (2020). Financial markets under the global pandemic of COVID-19. Finance Research Letters, 36, 101528. https://doi.org/10.1016/j.frl.2020.101528