
 ?Mathematical formulae have been encoded as MathML and are displayed in this HTML version using MathJax in order to improve their display. Uncheck the box to turn MathJax off. This feature requires Javascript. Click on a formula to zoom.
Abstract
The COVID-19 pandemic emerged at a time when the South African economy was already battling to recover from the aftermath of the global financial crisis of 2007–09 which led the country to experience a decade-old slowdown in labour productivity. Our study investigates the role which government plays in influencing labour productivity by estimating a log-linearized growth model augmented with a fiscal sector using the autoregressive distributive lag model applied to annual data of 1990–2020. We further disaggregate the composition of government size into seven expenditure items and six revenue items, and find i) education, health, recreation and public safety to be expenditure items most beneficial to short-run and long-run labour productivity ii) income taxes and VAT to be revenue items most beneficial to long-run productivity and yet most taxes have adverse short-run effects. The policy implications of the study are discussed.
PUBLIC INTEREST STATEMENT
Labour productivity is the amount of output which can be produced by each labourer and is considered an encompassing measure of welfare for economists. For instance, businesses are interested in increasing labour productivity as it has the potential to lower costs and increase profits. On the other hand, improved productivity could translate to higher wages and improved working conditions for labours whilst governments consider labour productivity as key to long-term job creation. Notably, South Africa has had poor labour productivity performance since her democratic transition in 1994 and this has worsened since the 2007-2008 global financial crisis. Our paper investigates the extent to which fiscal policy instruments such as taxes and expenditures can play a role in improving labour productivity in South Africa and by taking a disaggregated approach in our empirical analysis, we able to identify the individual tax and revenue items which either distort or improve labour productivity.
1. Introduction
This study examines the effect of government expenditure and revenues on labour productivity in South Africa over the last three decades. We consider this study important since conventional economic theory predicts labour productivity to be key in raising a country’s long-term living standards and wellbeing, and yet labour productivity growth has been on a decline since the great recession period of 2008–2010 which coincides with an era of deteriorating economic growth and welfare (Bloom et al., Citation2020; Fernald, Citation2014). The more recent coronavirus pandemic has further deteriorated labour productivity and international government bodies such as the International Labour Organization (ILO), International Monetary Fund (IMF) and the World Bank have placed emphasis on government intervention as a prescription for inducing labour productivity recovery and closing the growing “productivity-gap” between industrialized and non-industrialized economies (; ILO, Citation2020, ; IMF, Citation2021; World Bank, Citation2021).
Considering the stark differences in economic and fiscal structures globally, it is likely that the influence of the public sector on productivity varies across different countries, and this provides a motivation for country-specific empirical investigation. Moreover, it is unlikely that different/disaggregated classifications of public expenditures and taxation affect labour productivity the same way. We point this out because both conventional economic theory and empirical evidence commonly aggregate the effects of fiscal size on labour productivity (Cassou & Lansing, Citation1999; Mabugu et al., Citation2013). Furthermore, the “one-rule-fit-all” policy recommendations from the IMF and ILO do not provide a precise prescription of the fiscal mixture and adjustment needed to improve domestic labour productivity levels.
In our paper, we investigate the impact of government expenditures and taxes on labour productivity for South Africa between 1990 and 2020 using seven disaggregated measures of government expenditure items (education; health; housing; defence; social protection; public safety and order, as well as recreation, culture and religion) as well as six measures of fiscal revenue collections (Value Added Tax; personal income tax; Property tax; fuel levies and SACU payment). Whilst we acknowledge the existence of previous international studies on the subject matter, we observe that the existing literature either investigates the impact of government expenditure on labour productivity (Ali, Citation1985; Aschauer, Citation1989; Auci et al., Citation2021; Fedotenkov et al., Citation2021; Hansson & Henrekson, Citation1994; Knight & Sabot, Citation1987; Najarzadeh et al., Citation2014; Wei et al., Citation2018) or investigate the impact of taxation on labour productivity (Thomas, Citation1998; Vartìa, Citation2008; Ordonez, Citation2014; Salotti & Trecroci, Citation2016;, McPhail et al., Citation2018; Davanzati & Giangrande, Citation2020; Peng et al., Citation2021). Our study bridges these two strands of empirical literature from a disaggregated perspective and therefore provides a more “encompassing” outlook on the subject matter.
figure presents a time series plot between the disaggregated classes of government expenditure items and labour productivity in South Africa for the period 1990–2020. As can be observed, labour productivity has been on a gradual increase since 1994. Furthermore, it can also be observed that educational expenditure has taken a greater portion of overall government spending since the dawn of the democratic dispensation in 1994. This increase became more pronounced from 2006, in the era of ASGISA, a government policy strategy which focused primarily on improving skills and innovation to accelerate growth and productivity. Other notable increasing expenditure items have been social protection and health expenditures. Social protection is particularly important for South Africa whose economy is characterized by high unemployment and wide income gaps, most of which exist as a legacy of apartheid. In order to mitigate these effects, the government offers a wide range of social grants to the South African population. Spending on health is important for alleviating chronic diseases and other life-threatening illness by increasing access of the poor to quality health services. Moreover, health and social protection expenditure items have increased drastically as government mitigates the health, social and economic effects of the COVID-19 pandemic (Bhorat et al., Citation2021).
Figure 1. Government revenue components and labour productivity.
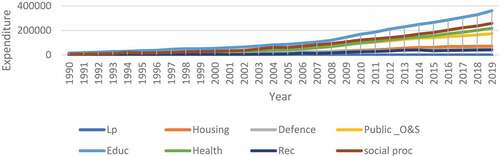
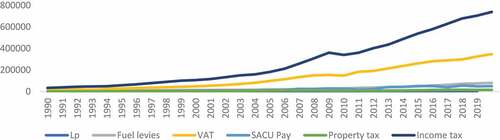
figure presents a time series plot of disaggregated classes of government revenue items and labour productivity in South Africa for the period 1990–2020. Tax revenue has been notably increasing in South Africa following the establishment of the South African Revenue Services (SARS) in 1998, and tax collections have been dominated by personal income tax and value-added tax (VAT). A notable shortfall in revenue collection was experienced in most tax items from 2008 to 2010 as a consequence of the global financial crisis and recession periods. This shortfall was more notable because it followed a period (i.e. 2004–2006) when the South African economy recorded its first fiscal surplus in the new democratic era. Nevertheless, the growth in revenue collection picked up in the post-recession period, although there has been an increased dependence and concentration on income taxes and VAT. In recent years, there has been debate on whether the SARS should include a wealth tax as an additional source of fiscal revenues (Arendse & Stock, Citation2018) and this debate has intensified during the COVID period.
Figure 2. Government revenue components and labour productivity.
Our study’s main contribution to the literature is that it sheds light on two key policy questions pertaining to the sound mix of fiscal policies which will be required to boast labour productivity. Firstly, “do all public expenditures and taxation affect labour productivity the same way or do their effects differ across disaggregated fiscal items?” Secondly, “which fiscal expenditure or revenue components of government spending are most conducive for labour productivity?” “Are there any expenditure or taxation items that are redundant or unproductive?”. Against the backdrop of a lack of academic literature addressing these policy questions for the case of South Africa, our study fills in this empirical “hiatus” and contributes to the literature by estimating log-linearized growth regressions using the autoregressive distributive lag (ARDL) model of Pesaran et al. (Citation2001) to investigate the short-run and long-run cointegration relationship between disaggregated fiscal expenditure/revenue items and labour productivity.
The rest of the study is organized as follows. Section 2 presents the literature review. Section 3 outlines the empirical framework and the methods used for estimation purposes. Section 4 presents the data and main empirical analysis. Section 5 concludes the study in the form of policy implications and avenues for future research.
2. Literature review
A country’s ability to improve its standard of living depends on its ability to raise its output per worker and the literature identifies numerous channels through which this occurs. Firstly, higher productivity results in higher profits and growth for companies (Bloom et al., Citation2015). Secondly, higher productivity leads to higher employment and wages (Lazear, Citation2019; Stansbury & Summers, Citation2017). Thirdly, higher productivity leads to higher economic growth (Eichengreen et al., Citation2011). Fourthly, higher productivity leads to lower costs for consumers (Byerlee et al., Citation2005). Lastly, an increase in labour productivity within economic sectors is a main driver of economic growth, particularly in the industry and services sectors (Holman et al., Citation2008).
Labour productivity has grown to be an important tool used to measure economic performance in growth accounting policy models (Solow, Citation1956). Dynamic growth theory attributes the growth in labour productivity to improvements in labour, human capital, technology and government size. According to new growth models, technological advancement through research and development and high quality of human capital play a leading role in enhancing the output capabilities of labourers (Mankiw et al., Citation1992; Romer, Citation1990). Improving human capital through education, skills and research are viewed as essential components to advancing and learning new technologies required for dynamic growth (Romer, Citation1986) and new growth theory further hypothesizes that improvements in labour productivity can be fostered through an efficient government spending and collection structure (Barro, Citation1990; Barro & Redlick, Citation2011; Bleaney et al., Citation2001; Hansson & Henrekson, Citation1994).
In the next two subsections we review the two strands of empirical literature which examine the impact of government structure on labour productivity. Firstly, we review the literature which looks at the impact of government expenditure items on labour productivity. Secondly, we review the literature which investigates the impact of taxation items on labour productivity.
2.1. Government expenditure and labour productivity
Whilst traditional theory highlights the importance of government spending in stimulating the economy through multiplier effects, more recent dynamic growth theory argues that the effects of increasing fiscal size on output productivity are ambiguous. On one hand, government spending addresses market failures, increases utilizations, reduces social inequality and are a natural portion of GDP accounting, hence exerting a positive effect on productivity. On the other hand, government size, may crowd out private investment and production and encourage rent-seeking opportunities, which would exert a negative effect on output productivity (Hansson & Henrekson, Citation1994). Further ambiguity can be placed on traditional theory and empirical evidence on account of aggregating government expenditures which masks any possible heterogeneous effects of individual spending items on growth and output productivity (Easterly & Rebelo, Citation1993; Engen & Skinner, Citation1992; Fölster & Henrekson, Citation1999; Ram, Citation1986; Romer & Romer, Citation2010).
Interestingly, there exists a handful of international empirical literature which have examined the impact of disaggregated fiscal expenditure items on labour productivity. For instance, an earlier study by Ali (Citation1985) uses traditional OLS estimates based on 1978 data on a sample of 65 developing and 15 industrialized economies and finds that an increase in adult literacy improves labour productivity. The author concludes that education is an investment in human capital that raises labor productivity through skills provision, facilitating innovations and enhancing labour mobility. Knight and Sabot (Citation1987) take Tanzania (lower educational quality) and Kenya (higher educational quality) as a natural experiment to examine the impact of educational policy on labour productivity within a growth output accounting framework in the 1980ʹs. The authors find that if the Tanzanian government had implemented similar educational investment policies to Kenya, that would have increased the quality and quantity of Tanzania’s secondary education, which in turn, would increase productivity and average earnings. Aschauer (Citation1989) examine the impact of disaggregated public expenditure items for the US economy between 1949 and 1985 using ordinary least squares (OLS) and two staged least squares (2SLS) estimates and finds that i) non-military expenditure is more productive than military expenditure ii) from the non-military components, it is infrastructure spending which exerts the most positive influence on productivity. Hansson and Henrekson (Citation1994) also use OLS investigate the impact of government transfers, government consumption, government investment and education spending on labour productivity for 14 OECD countries between 1970 and 1987. The authors find that whilst government transfers, consumption and outlays have negative effects on labour productivity, education expenditure has a positive effect whereas government investment has no effect on productivity.
More recent studies include those of Najarzadeh et al. (Citation2014) who estimated Panel OLS (POLS) and Generalized Methods of Moments (GMM) regressions to examine the impact of ICT (internet usage) and public expenditures on educational on labour productivity for a sample of 108 countries between 1995–2010 and found that both variables have a positive and significant impact on labour productivity. Wei et al. (Citation2018) conducted a study on China’s prefecture-level cities between 2007 and 2013 and using two-way fixed effects (FE) estimators the authors found that health expenditure improves labour productivity in agriculture and non-agriculture sectors by improving people’s cognitive abilities although this relationship turns negative in regions which have poor infrastructure. Applying the true random effect (TRE) estimators to the stochastic production frontier technique, Auci et al. (Citation2021) investigate the impact of disaggregated public expenditures (public services; economic affairs; social protection; recreation; culture and religion; public order and safety; education; health; housing; environmental protection and defence) for 15 European countries between 1996 and 2014, and find that whilst education and health expenditures exert a positive effect on productivity the remaining classes of expenditures exert a negative effect. Fedotenkov et al. (Citation2021) investigated the impact of 10 disaggregated classes of public expenditures (defence; economic affairs; education; environmental protection; health; housing; public order and safety; public services; recreation; social protection) on services labour productivity in 21 EU countries between 1996 and 2017 using two-way fixed effects and GMM estimators. For the business services sector, the authors find that a negative impact of defence spending on productivity, a positive impact for public order and safety whilst the rest of the expenditure items exert insignificant effects. For the industry sector, environmental protection exerts a negative effect on labour productivity whilst social protection produces a positive effect and the remaining expenditure items produce insignificant estimates.
2.2. Taxation and labour productivity
Taxation is an integral part of any country’s fiscal policy simply because a major part of government expenditure is financed through tax revenue. In retrospect, taxation directly affects labour productivity by distorting prices and allocation of factors of production and alters the rate of return expected from entrepreneurship, influences private investment decisions and reduces incentive to supply labour (Stephan, Citation1975). For instance, income taxes reduce labour earnings and affect how much people are willing to work whilst taxes on goods and services as well as businesses, can distort efficient production decisions. Moreover, since taxes change decisions and behaviours of economic agents, they can further impact private sector productivity by reducing savings, investment, the supply of labour, entrepreneurship, and innovation (Rao et al., Citation2008).
Notably, there are a number of empirical studies which have examined the impact of different tax categories on labour productivity. Thomas (Citation1998) investigates the impact of labour taxes on the Swedish labour market between 1970 and 1996 using OLS and GMM estimates applied to a labour market model and finds that an increase in payroll taxes raises the cost of labour, lowers total labour hours and thus diminishes labour productivity. Vartìa (Citation2008) studies the cross-sectional impact of taxes on productivity at industry level for manufacturing and business sectors for 16 OECD countries between 1983 and 2001 using OLS estimators. The author finds that whilst corporate and top income taxes adversely affects labour productivity, the tax incentives for Research and Development (R&D) improve productivity particularly in more profitable industries which have more entrepreneurial and R&D activity. Ordonez (Citation2014) calibrates a dynamic general equilibrium (DGE) model of occupational choice and capital accumulation for Mexico and find that in the presence of limited tax enforcement, capital-labour ratios are lowered, unproductive entrepreneurs enter the market and cause a misallocation of resources to low-productive firms, which then lowers output productivity. However, in the presence of complete tax enforcement these inefficiencies are removed, and productivity is improved.
Salotti and Trecroci (Citation2016) examine the impact of fiscal deficits, expenditures, income tax, social tax, property tax and good tax on labour productivity 20 advanced and 80 emerging economies between 1970 and 2009 using FE and GMM estimators and find a negative impact of expenditure and all tax classifications on labour productivity. McPhail et al. (Citation2018) investigate the impact of marginal tax rates on labour productivity across 48 US states between 1981 and 2015 by estimating a neoclassical growth model with OLS. The authors find that whilst marginal property tax, sales tax, marginal tax on capital returns all exert negative effects on labour productivity, the effect of labour tax on productivity is neutral. Davanzati and Giangrande (Citation2020) recently studied the impact of labour market deregulation and taxation on labour productivity in Italy using an analytical model derived from a Marx-Kaldor framework and found that the Italy’s liberalization agenda has increased income inequality, lowered economic growth and consequentially lower labour productivity The authors confirm that higher taxes, caused by increased debt, adversely affects labour productivity through a deterioration of the quality of the labour workforce. More recently, Peng et al. (Citation2021) study the impact of the replacement of business tax with VAT in the Chinese services sector on firm-level productivity in manufacturing sector using difference-in-difference estimators and find that the VAT tax reforms have a positive effect on productivity levels. The authors find that the positive effect is caused by its effect on firm specialization which is more prominent in non-state owned and labour intensive firms.
3. Empirical framework
According to dynamic growth theory, the output for an economy (i.e. Y), can be modelled as a function of factor inputs, in particular capital (K) and labour (L), via a production function of general form:
Which, in per capita terms can be represented as:
Where Y/L is labour productivity and K/L is the capital-labour ratio. According to Hansson and Henrekson (Citation1994) government activities, G, can affect output or labour productivity through the level of total factor productivity, A, such that:
In substituting Equationequation (3)(3)
(3) into (2) and log-linearizing the outcome, we can specify the following time series empirical function:
Where α and β’s are the intercept and regression coefficients, respectively, et is a well behaved error term, Xt is a vector of control variables inclusive of inflation (πt) and the exchange rate (ERt), which are included in order to capture the effects of monetary policy (i.e. the South African Reserve Bank (SARB) currently practices inflation targeting as its policy mandate) and openness (i.e. the exchange rate plays a key role in international trade activity in financial and goods markets), respectively. To estimate the empirical regression (4), we make use of the Autoregressive Distributed Lag model (ARDL) of Pesaran et al. (Citation2001) to model the short- and long-run cointegration relationships between the time series. The ARDL framework is preferred due to its well-known empirical advantages, such as, i) its flexibility in accommodating a mixture of stationary and non-stationary series and ii) its suitability for small sample sizes iii) produces unbiased estimates of the long-run coefficients even if some of the regressors are endogenous (Pesaran et al., Citation2001). We specify our baseline ARDL model as:
Where ∆ denotes the first difference, c0 denotes a drift component, c1 … . c5 and ψ1 … . ψ5 are the regression coefficients, εt denotes a white noise residual. Our modelling process consists of four interrelated steps. In the first step of the modelling process, we test for cointegration effects using the bounds testing procedure of Pesaran et al. (Citation2001) which involves testing the null hypothesis no long-run cointegration effects, i.e.
Against the alternative hypothesis of cointegration effects, i.e.
The test is based on an F-statistic whose critical values are non-standard, hence Pesaran et al. (Citation2001) formulate lower I(0) bound and upper I(1) bound critical values in which ARDL cointegration effects are validated if the computed F-statistic exceeds the upper bound. In the second step of the modelling process, we use the coefficient estimates obtained from regression (4) to compute the long-run regression parameters represented in regression (4) as β1 = c2/c1, β2 = c3/c1, β3 = c4/c1, β4 = c5/c1, and the intercept α is computed via backward substitution. In the third step of the modelling process, we model the short-run and error correction mechanism by making use of the error from the long-run estimated regression to create the error correction term i.e. ECTt = lg(Y/L)t—α—β1 lg(K/L)t—β2 lgGt—β3 lgGt—β4 lgERt, and derive the following specification:
Where the coefficient γ measures the speed of adjustment to equilibrium after a “shock” to the system, and the coefficient is expected to be negative. Moreover, Pesaran et al. (Citation2001) treat the t-statistic of the coefficient estimate of γ, as an alternative test for cointegration within the ARDL model with a significant (insignificant) coefficient indicating the presence (absence) of cointegration. In the final step of the modelling process we perform conventional diagnostic tests on the regression error terms such as tests for residual normality, serial correlation tests, heteroscedasticity tests as well as tests for correct functional form and regression stability.
4. Data and empirical analysis
4.1. Data description, descriptive statistics and pairwise correlations
For our empirical analysis, the study uses annual time series data sourced from the South African Reserve Bank (SARB) over a 30-year period of 1990 to 2020. The main dependent variable we source is labour productivity. The main independent variables are government expenditure on education, defence, health, housing, social protection, public safety and order, and recreation, culture and religion as well as the government revenue components, namely, net tax, VAT, property tax, tax on international trade, fuel levies and income tax. The other control variables included are capital-labour ratio, consumer price inflation and real effective exchange rate (REER). A summary of the variables is provided in Table .
Table 1. Description of time series
Table presents the summary statistics of the time series (Panel A) as well as the correlation matrix of variables (Panel B). From the summary statistics we observe some stylized facts on public expenditure and revenue items such as education, social protection and health having the highest averages on expenditure items whilst income tax and VAT are the leading revenue items. Moreover, the correlation provides us with some evidence on the co-movements between the series and shows a negative correlation between labour productivity and i) defence ii) education, whilst the remaining expenditure items and all revenue items are found to have a positive correlation. Nonetheless, we treat these findings as preliminary to our main empirical analysis and hence we do not draw any inferences based on them.
Table 2. Descriptive statistics and correlation matrix
4.2. Unit root tests
Before estimating the ARDL model, we test for stationarity amongst the variables to establish the order of integration. Even though ARDL is flexible enough to deal with a combination of I(0) and I(1) variables, it is important to ensure that none of the time series is integrated of order I(2) or higher. The findings from the conventional ADF and PP unit root tests reported in Table indicate that whilst most series contain a unit root in their levels, all variables are stationary in their first differences. These results allow us to proceed and carry out the ARDL modelling procedure.
Table 3. Unit root test results
4.3. ARDL modelling process
4.3.1. Co-integration test
As a first step to the modelling process we perform bounds tests on the selected ARDL model regressions. Since we have seven expenditure items and six revenue items, we have a total of 13 regressions to work with. The modified AIC and SC information criterion all advocate for an ARDL model specification (1, 0, 0, 0, 0) as optimal lag selection for all regressions. The F-statistics obtained from bounds test for cointegration for the 13 regressions are reported in Table . Note that all reported statistics are above the upper 5% critical bound level, which implies that the null hypothesis of no ARDL cointegration is rejected. This allows us to proceed to provide long-run and short-run estimates for the 13 regressions.
Table 4. Bounds test for cointegration
4.3.2. Government expenditure and labour productivity estimates
Having validated ARDL cointegration effects, we proceed to estimate the ARDL (1, 0, 0, 0, 0) regressions for the 7 expenditure items with results being reported in (1)—(7) in Table . From the long-run estimates presented in Panel A of Table , we observe, in order of magnitude (strongest to weakest), that the education, health, recreation and public safety expenditure items all produce positive and statistically significant coefficient estimates whilst those for defence, housing and social protection produce statistically insignificant estimates. From the short-run estimates presented in Panel B of Table , only education, health and recreation spending items are positively and significantly related with productivity whilst the remaining expenditure items (i.e. defence, housing and social protection) produce insignificant coefficient estimates.
Table 5. Government expenditure items and labour productivity
Our findings are comparable to those in previous literature. For instance, Hansson and Henrekson (Citation1994), Auci et al. (Citation2021) and Fedotenkov et al. (Citation2021) similarly find positive effects of health and educational expenditures on labour productivity, whilst finding insignificant effects on the remaining expenditure items. Moreover, Aschauer (Citation1989) also found similar insignificant effects of defence or military spending on productivity levels. Further note that over both the long-run and short-run the coefficient estimates on the capital-labour ratio and real effective exchange rate are generally positive whilst those for inflation are negative, and the signs on these variables concur with those depicted by growth theory and empirical evidence (Barro, Citation1990; Schmoller & Spitzer, Citation2021). Moreover, the negative and statistically significant error correction terms provide further confirmation of significant cointegration effects and give additional information on the speed of reversion back to equilibrium after a shock, with safety and order having the highest reversion speed followed by health, education.
4.3.3. Government revenues and labour productivity estimates
We now present the estimated ARDL (1, 0, 0, 0, 0) regressions for the 6 revenue items and report the results in (1)—(6) in Table . From the long-run estimates reported in Panel A of Table , we observe positive and statistically significant estimates on income tax and VAT whilst the remaining revenue items produce insignificant coefficient estimates. These results are comparable to those obtained in Ordonez (Citation2014) and McPhail et al. (Citation2018) who similarly find a positive impact of labour tax on labour productivity whilst Peng et al. (Citation2021) also find a positive effect of VAT on productivity. Conversely, the short-run estimates reported in Panel B of Table inform us that VAT, SACU revenues, income tax and property tax all have negative and statistically significant effects on labour productivity whilst the short-run coefficients for SACU, interest tax and fuel tax remain statistically insignificant. These later results are more similar to those found in previous literature such as Vartìa (Citation2008), Salotti and Trecroci (Citation2016), McPhail et al. (Citation2018), and Davanzati and Giangrande (Citation2020) who find a negative impact of income tax, property tax and capital gains tax on labour productivity.
Table 6. Government expenditure items and labour productivity
The sign on the coefficient estimates for the control variables are similar to the ones obtained for the “expenditure items” regressions reported in the previous section of the paper. In this regard, panels A and B of Table generally present positive long-run and short-run estimates on the capital-labour ratio and real effective exchange rate whilst a negative coefficient dominates the inflation variable. Moreover, the error correction terms reported in Panel B of Table produce their negative and statistically significant estimates and further reveal that income and property taxes exert the quickest equilibrium correction behaviour whilst the remaining revenue items display slow reversion rates.
4.3.4. Diagnostic tests
As a final step in our modelling process, we perform residual diagnostic tests and tests for correct functional form and regression stability on each of the estimated regressions. Firstly, we test for normality in the residuals using the Jarque-Bera (J-B) test. Secondly, we check for serial correlation in the residuals by performing the Breusch Godfrey (B-G) LM test. Thirdly, we test for heteroscedasticity effects by performing ARCH tests. Fourthly, we test for correct functional form by performing Ramsey’s RESET test. Lastly, we check for reliability and stability of the model using CUSUM and CUSUM of squares.
Panel A of Table reports the p-values of the diagnostic tests on the 7 “expenditure regressions” whilst Panel B of Table reports those for the “revenue items” regressions. Judging by the reported p-values, all estimated regressions fail to reject the null hypotheses of normality, no serial correlation, homoscedasticity and correct functional. Moreover, the CUSUM and CUSUM.SQ plots advocate for regression stability in all estimated functions. All-in-all, the findings from our diagnostic tests allow to interpret our empirical results with confidence as they do not violate the classic regression assumptions.
Table 7. Diagnostic tests on regressions
5. Conclusions
This paper investigates the impacts of fiscal expenditures and revenue collections on labour productivity for the South African economy between 1990 and 2020. To this end, we estimated a log-linearized production function augmented with a government sector using an ARDL model and further disaggregate our measure of public spending and revenues into separate categories. For expenditure items, we focus on health, education, housing, social protection as well as public safety and order, whilst for revenue components, we focus on income tax, VAT, tax on trade, fuel levies, SACU income receipts and property taxes.
Our empirical findings can be summarized in two points. Firstly, for expenditure items, health, recreation and public safety are the only items which have positive and significant (over both the long-run and short-run) effects on labour productivity whereas the remaining expenditure items have no significant effects on productivity. Secondly, for revenue items, most items such as VAT, SACU revenues, income tax and property tax exert an adverse effect on productivity over short-run whilst over the long-run income taxes and VAT exert positive effects on labour productivity whilst the remaining revenue items have no significant impacts.
Overall, our findings have important implications for policy debate. For instance, on the expenditure side, there have been proposals of a national health insurance (NHI) as a means of increasing access of the poor to quality health services. Our results show that increased health expenditures in such policies could have positive effects on labour productivity. On the other hand, our results further imply that the decrease in educational and public safety expenditures which have occurred since 2016 are likely to adversely impact output productivity whereas the experienced decreases in the military budget are unlikely to affect labour productivity. On the revenue side, our findings suggest that only income taxes and VAT increase productivity over the long-run whilst other wealth-related taxes such as taxes on property do not have a significant impact on productivity. We treat our evidence in favour of the recently proposed wealth tax as a supplement to income taxes to improve the efficiency of fiscal revenues collections. Our results indicate that if wealth taxes are designed as an extension of income taxes this would have positive spillover effects into labour productivity over the long-run.
Notwithstanding the contribution of our study to the literature, one aspect of the “government size—labour productivity” debate which our study has not addressed is that concerning the possibility of nonlinear relationships between the expenditure and revenue items on productivity. As theoretically postulated by the BARS curve, it is possible that relationship between government size and output and productivity is not linear and either of concave or convex shape, with the turning points being considered optimal points which fiscal policymakers should strive to keep fiscal size at. Future studies could focus on identifying possible optimal points for expenditure and revenue items using more specialized nonlinear econometric techniques.
Disclosure statement
No potential conflict of interest was reported by the author(s).
Additional information
Funding
Notes on contributors
Andrew Phiri
Andrew Phiri, who is the corresponding author of the manuscript, is an associate professor with the department of economics at Nelson Mandela University, South Africa. He enjoys a wide range of publications with research interests mainly in macroeconomics, applied econometrics and financial economics.
Chuma Mbaleki
Chuma Mbaleki is a post-graduate student at the department of economics at Nelson Mandela University and is the first author of the article. His research interests are in public economics and applied econometrics.
References
- Ali, S. (1985). Contribution of education towards labour productivity: A cross-country study. Pakistan Economic and Social Review, 23(1), 41–18 https://www.jstor.org/stable/25824974.
- Arendse, J., & Stock, L. (2018). Investigating a new wealth tax in South Africa: Lessons from international experience. Journal of Economic and Financial Sciences, 11(1), a175. https://doi.org/10.4102/jef.v11i1.175
- Aschauer, D. (1989). Is public expenditure productive? Journal of Monetary Economics, 23(2), 177–200. https://doi.org/10.1016/0304-3932(89)90047-0
- Auci, S., Castellucci, L., & Coromaldi, M. (2021). How does public spending affect technical efficiency? Some evidence from 15 European countries. Bulletin of Economic Research, 73(1), 108–130. https://doi.org/10.1111/boer.12236
- Barro, R. (1990). Government spending in a simple model of endogenous growth. Journal of Political Economy, 98(5, Part 2), S103–S125. https://doi.org/10.1086/261726
- Barro, R., & Redlick, C. (2011). Macroeconomic effects of government purchases and taxes. The Quarterly Journal of Economics, 126), 1(1), 51–102. https://doi.org/10.1093/qje/qjq002
- Bhorat, H., Oosthuizen, M., & Stanwix, B. (2021). Social assistance amidst the COVID-19 epidemic in South Africa: A policy assessment. South African Journal of Economics, 89(1), 63–81. https://doi.org/10.1111/saje.12277
- Bleaney, M., Gemmell, N., & Kneller, R. (2001). Testing the endogenous growth model: Public expenditure, taxation, and growth over the long run. Canadian Journal of Economics, 34(1), 36–57. https://doi.org/10.1111/0008-4085.00061
- Bloom, N., Bunn, P., Mizen, P., Smietanka, & Thwaites, G. (2020), “The impact of COVID-19 on productivity”, NBER Working Paper No. 28233, December.
- Bloom, N., Liang, J., Roberts, J., & Ying, Z. (2015). Does working from home work? Evidence from a Chinese experiment. The Quarterly Journal of Economics, 130(1), 165–218. https://doi.org/10.1093/qje/qju032
- Byerlee, D., Diao, X., & Jackson, C. (2005, January). Agriculture, rural development and pro-poor growth: Country experiences in the post-reform era. Agriculture and Rural Development Discussion Paper No, 21 1–72 .
- Cassou, S., & Lansing, K. (1999). Fiscal policy and productivity growth in the OECD. The Canadian Journal of Economics, 32(5), 1215–1226. https://doi.org/10.2307/136478
- Davanzati, G., & Giangrande, N. (2020). Labour market deregulation, taxation and labour productivity in a Marxian-kaldorian perspective: The case of Italy. Cambridge Journal of Economics, 44(2), 371–390 https://doi.org/10.1093/cje/bez041.
- Easterly, W., & Rebelo, S. (1993). Fiscal policy and economic growth: An empirical investigation. Journal of Monetary Economics, 32(3), 417–458. https://doi.org/10.1016/0304-3932(93)90025-B
- Eichengreen, B., Park, D., & Shin, K. (2011, March). When fast growing economies slow down: International evidence and implications for China. NBER Working Paper No, 16919 1–50 doi:10.3386/w16919 .
- Engen, E., & Skinner, J. (1992), “Fiscal policy and economic growth”, NBER Working Paper 4223, December.
- Fedotenkov, Gupta, R., & Fedotenkov, I. (2021). The effects of public expenditures on labour productivity in Europe. Empirica 48(2) , 845–874. forthcoming. https://doi.org/10.1007/s10663-021-09505-w
- Fernald, J. (2014). Productivity and potential output before, during, and after the great recession. NBER Macroeconomics Annual, 29(1), 1–51. https://doi.org/10.1086/680580
- Fölster, S., & Henrekson, M. (1999). Growth and the public sector: A critique of the critics. European Journal of Political Economy, 15(2), 337–358. https://doi.org/10.1016/S0176-2680(99)00010-5
- Hansson, P., & Henrekson, M. (1994). A new framework for testing the effect of government spending on growth and productivity. Public Choice, 81(3–4), 381–404. https://doi.org/10.1007/BF01053239
- Holman, C., Joyeux, B., & Kask, C. (2008, February). “Labour productivity trends since 2000, by sector and industry”. Monthly Labour Review, 64–82 https://www.jstor.org/stable/monthlylaborrev.2008.02.064.
- ILO. (2020). “Driving up productivity - A guide for employer and business membership organizations”. activities (ACT/EMP).
- IMF (2021), “Group of Twenty: Boasting productivity in the aftermath of COVID-19”, June.
- Knight, J., & Sabot, R. (1987). Educational policy and labour productivity: An output accounting exercise. The Economic Journal, 199–214 https://doi.org/10.2307/2233331.
- Lazear, E. (2019), “Productivity and wages: Common factors and idiosyncrasies across countries and industries”, NBER Working Paper No. 26428, November.
- Mabugu, R., Robichaud, V., Maisonnave, H., & Chitiga, M. (2013). Impact of fiscal policy in an intertemporal CGE model for South Africa. Economic Modelling, 31(C), 775–782. https://doi.org/10.1016/j.econmod.2013.01.019
- Mankiw, G., Romer, D., & Weil, D. (1992). A contribution to the empirics of economic growth. The Quarterly Journal of Economics, 107(2), 407–437. https://doi.org/10.2307/2118477
- McPhail, J., Orazem, P., Singh, R., & Stammer, R. (2018), “Do state marginal taxes rates lower state labour productivity?”, Iowa State University Department of Economics Working Paper No. 18006, December.
- Najarzadeh, R., Rahimzadeh, F., & Reed, M. (2014). Does the internet increase labour productivity? Evidence from a cross-country dynamic panel. Journal of Policy Modeling, 36(6), 986–993. https://doi.org/10.1016/j.jpolmod.2014.10.003
- Ordonez, J. (2014). Tax collection, the informal sector, and productivity. Review of Economic Dynamics, 17(2), 262–286. https://doi.org/10.1016/j.red.2013.07.004
- Peng, F., Peng, L., & Wang, Z. (2021). How do VAT reforms in the service sectors impact TFP in the manufacturing sector: Firm-level evidence from China. Economic Modelling, 99(1-2), e105483. https://doi.org/10.1016/j.econmod.2021.03.002
- Pesaran, M., Shin, Y., & Smith, R. (2001). Bound testing approaches to the analysis of level relationship. Journal of Applied Econometrics, 16(3), 174–189. https://doi.org/10.1002/jae.616
- Ram, R. (1986). Government Size and economic growth: A new framework and some evidence from cross-section and time series data. American Economic Review, 76(1), 191–203 https://www.jstor.org/stable/1804136.
- Rao, S., Tang, J., & Wang, W. (2008). What explains the Canada-US labour productivity gap? Canadian Public Policy, 34(2), 163–192. https://doi.org/10.3138/cpp.34.2.163
- Romer, P. (1986). Increasing returns and long-run growth. Journal of Political Economy, 94(1), 1002–1037. https://doi.org/10.1086/261420
- Romer, P. (1990). Endogenous technological change. Journal of Political Economy, 98(5), S71–102. https://doi.org/10.1086/261725
- Romer, C., & Romer, D. (2010). The macroeconomic effects of tax changes: Estimates based on new measure of fiscal shocks. American Economic Review, 100(3), 763–801. https://doi.org/10.1257/aer.100.3.763
- Salotti, S., & Trecroci, C. (2016). The impact of government debt, expenditure and taxes on aggregate investment and productivity growth. Economica, 83(330), 356–384. https://doi.org/10.1111/ecca.12175
- Schmoller, M., & Spitzer, M. (2021). Deep recessions, slowing productivity and missing (dis-) inflation in the Euro area. European Economic Review, 134(C), e103708. https://doi.org/10.1016/j.euroecorev.2021.103708
- Solow, R. (1956). A contribution to the theory of economic growth. Quarterly Journal of Economics, 70(1), 65–94. https://doi.org/10.2307/1884513
- Stansbury, A., & Summers, L. (2017), “Productivity and pay: Is the link broken?”, NBER Working Paper No. 24165, December.
- Stephan, P. (1975). The impact of income taxes on labour productivity: A human capital approach. Public Finance Review, 3(4), 361–379. https://doi.org/10.1177/109114217500300404
- Thomas, A. (1998), “The effects of tax wedges on hours worked and unemployment in Sweden”, IMF Working Paper No. 98/152, October.
- Vartìa, L. (2008), “How do taxes affect investment and productivity?“ An industry-level analysis of OECD countries, OECD Economic Departments Working paper. 656, December.
- Wei, F., Xia, Y., & Kong, Y. (2018). Public health expenditure and labour productivity: A tentative interpretation based on the science of brain cognition. NeuroQuantology, 16(5), 319–333. https://doi.org/10.14704/nq.2018.16.5.1274
- World Bank (2021), “Global productivity: trends, drivers, and policies”.