?Mathematical formulae have been encoded as MathML and are displayed in this HTML version using MathJax in order to improve their display. Uncheck the box to turn MathJax off. This feature requires Javascript. Click on a formula to zoom.
Abstract
The influence of external debt on the environment is a rising issue in the rapidly developing climate crisis. This study analyzes the relationship between carbon dioxide emissions per capita, gross domestic product per capita and ecological footprint per capita by applying an autoregressive distributed lag model for the Republic of Turkey. According to the results of this study there is an inverted U relationship between carbon dioxide emissions and external debt. There is no inverted U relationship between ecological footprint per capita and external debt while there is bidirectional causal relationship between external debt and economic growth. In addition, the results reveal that economic growth has a significant impact on ecological footprint per capita in the long run. There is causal relationship from external debt to emissions. This study recommends that further analysis be done for other countries that have high foreign debt to investigate the relationship between external debt and emissions. Similar analysis may be carried out for the external debt and ecological footprint per capita nexus for future studies.
Public Interest Statement
Developing countries such as Turkey has high external debt to finance their developments. Examining of external debt on the environment carries importance since significant amounts of external debt are spent on infrastructure. The key question here is: Is there a relationship between external debt and the environment in term of carbon dioxide emissions and ecological footprint for Turkey?. The findings show that the relationship holds for carbon dioxide emissions and the spending of external debt contributes positively to the environment. It is thus recommended that countries such as Turkey to continue projects to positively affect the environment and contribute to sustainability.
1. Introduction
The history of Turkey is central to that of modern civilization. The rise and fall of great powers throughout history runs through the Turkish straits where some of antiquities most powerful empires reigned. To sustain such power required resources raised through either conquest, taxes or debt. All of these have a long tradition for funding Istanbul’s many rulers. The Republic of Turkey inherited debt accrued by its predecessor, the Ottoman Empire who used the proceeds to sustain economic development and maintain a strong military posture. It took Turkey into the 1950s to retire this foreign debt. During and following World War II, Turkey also utilized substantial foreign debt to stabilize its economy and modernize its infrastructure.
However, its most rapid increase in foreign debt followed Turkey’s transition to a more open, market-based economy starting in the early 1980s. After opening their market to foreign investment, political instability, insufficient local reserves, an increase in oil prices and the devaluation of the Turkish lira are major factors that contributed to the increased levels of Turkey’s external debt. Turkey like many countries further increased its debt levels following the 2008 world financial crisis to resuscitate internal markets and for the ever-anticipated stimulative effects of infrastructure development. This debt was just one of many options employed by Turkey to revive their struggling economy. For example, the Turkish government even sought to expedite investment in civilian construction projects by conveying Turkish citizenship to foreigners willing to invest $250,000. Through all of this, the Turkish Military’s continual purchases of foreign arms added its share to the rising debt levels on the national balance sheet.
Kuznets (Citation1955) examined the relationship between income inequality and economic growth and stated that there was an inverted U relationship between them. Income inequality rises to a certain point which is called the turning point, then after that point as economic growth increases income inequality decreases. After 1990, a similar relationship is examined between environmental pollutants and economic growth which is called the Environmental Kuznets Curve (EKC).
Studies examining the EKC show evidence that a similar inverted U relationship exists between income inequality and economic growth. As income level increases, communities prefer to pay for a cleaner environment by choosing less environmentally damaging products (Dinda, Citation2004). This leads to the fundamental question in the EKC research which is at what point does economic growth stop contributing to environmental pollution and start solving the environmental pollution crisis (Dinda, Citation2004).
In Turkey, GDP per capita and external debt (EXD) levels increased significantly from 1970 until today. Turkey aggressively used EXD to develop its overall infrastructure especially after 2000 mainly in the transportation, manufacturing, energy and construction sectors to improve overall prosperity. These are sectors that can contribute directly to environmental pollution. But, as a part of this spending sustained by the use of EXD in these areas, Turkey hopes to reduce the costs of energy and transportation for its citizen and industry with a project they have titled “Savings in Every Place.” This type of spending on conservation efforts and efficiencies in theory should lower emissions. With these two competing sources of spending using external debt, it stands to reason that EXD may provide greater insight than GDP alone into a possible EKC relationship.
The primary motivation for this study is delve into this relationship and ascertain Turkey’s heavy use of EXD for economic growth and infrastructure effect on the environment. For this study we use EXD alongside GDP per capita to measure their effect on the environment for two key factors that measure environmental pollution, carbon dioxide emissions (C) and ecological footprint per capita (EFPC). EFPC is a much broader measure incorporating the ecological assets a population or product uses to produce the natural resources consumed. The question to be answered is does an EKC exists for C and EFPC in terms of EXD. That is, as EXD continues to increase, do we see a “turning point” where we transition and start seeing environmental improvement as measured by C and EFPC.
Turkey, with its geographic location at a literal cross-roads between east and west and the globes developed and developing economies is an ideal case for this analysis. Turkey is a country with aspirations to join the ranks of Western economies and return to the global power and the economic position it historically held.
This study uses external debt totals in current US$ for EXD, square of EXD (EXD2), GDP per capita in constant 2010 US$ (G) for the period from 1970 to 2016. EXD used in this study is the sum of short-term and long-term debt and the use of IMF credit. C in this study is the metric tons of carbon dioxide emissions per capita. The Ecological footprint per capita (EFPC), which is measured in global hectares per capita, is used instead of C in the second model to examine the relationship between EFPC and EXD. EFPC is used to represent productive surface area such as forests, carbon demand on land, fishing grounds, cropland, built-up land and grazing land.
The Results confirm an inverted “U” effect on environmental pollution and external debt both in the long run and short run. A significant causal relationship is observed from external debt to emissions with no causality documented from emissions to external debt. Economic growth significantly affects emissions for the short run while no significant effect is seen over the long run. Economic growth’s effect is significant on the ecological footprint in both the short run and the long run.
2. Literature review and hypotheses
This study takes the EKC hypothesis as basis. The EKC hypothesis states that economic growth and environmental degradation have an inverted U relationship. That is, environmental pollution increases as economic growth increases but reaches a “turning point” where pollution levels start declining as economic growth continues. There are mixed results through the literature on this relationship and no consensus for the income level where a turning point is reached and the environment starts to improve (Dinda, Citation2004).
A number of issues are at work ferreting out this relationship. This can be seen in the studies that analyze a pollution haven hypothesis (PHA) in conjunction with the EKC hypothesis. The PHA argues that companies move polluting operations to countries where environmental regulations are lower to avoid stricter regulations developed countries impose. PHA posits that pollution control costs have significant influence on trade flows and investment decisions affecting both trade levels and foreign direct investment. Developing countries will put low environmental standards alongside cheap labor to attract investment from developed countries to promote their economic growth. According to PHA, as trade liberalization increases, the negative of environmental regulations will increase on the economic growth.
2.1. Related literature
For studies that analyze emissions and EFP as dependent variables, EXD is found to have no significant effect on C by Katircioglu and Celebi (Citation2018) and Beşe, Friday and Spencer (2021) for Turkey, and Brazil and Turkey respectively. Beşe et al. (Citation2021) found EXD had a significant effect on emissions in the case of China. Akam et al. (Citation2021) found EXD had a significant effect on C in the long run for a panel of thirty-three heavily indebted poor countries (see Table ).
Table 1. Literature Review
For studies analyzing just EFP, the EKC hypothesis is confirmed between EG and EFP by Destek and Sarkodie (Citation2019) and Dogan et al. (Citation2019) for panel country studies and single country studies respectively. Al-mulali et al. (Citation2015) analyzed the EKC hypothesis by grouping analyzed countries into different income levels. Al-mulali et al. (Citation2015) confirmed the EKC hypothesis for high-income and upper middle-income countries (see, Table ).
Köksal et al. (Citation2020) confirmed that SEC affects the environment negatively. I. Ozturk et al. (Citation2016) analyzed the relationship between GDP from tourism and EFP by analyzing panel countries for different income levels and confirmed the EKC hypothesis for high-income and upper middle-income countries. While Ozcan et al. (Citation2018) did not confirm the EKC hypothesis between EFP and EG, Charfeddine and Mrabet (Citation2017) confirmed the EKC hypothesis for selected panel countries. Bulut (Citation2021) confirmed the EKC hypothesis for EFP and EG and did not confirm PHA, while Öz and Öztürk (2016) and Gökmenoğlu and Taspinar (Citation2016) confirmed the EKC hypothesis for C and EG as well as confirming PHA (see Table ).
Table 2. Literature Review
For studies confirming the EKC hypothesis for emissions, Uzar and Eyuboglu (Citation2019), Pata (Citation2018b), Bölük and Mert (Citation2015), and Beşer and Beşer (Citation2017), Pata (2019), Gozgor and Can (Citation2016), Pata (2018), Katircioglu (Citation2017) and Dogan (Citation2016) confirmed the EKC hypothesis in Turkey. Income inequality, noncarbohydrate energy consumption, export, oil prices and agriculture output are also analyzed besides EG-C relationship in this context in the literature (see Table ).
Table 3. Literature Review
Studies not confirming the EKC hypothesis for emissions include Alola and Donve (Citation2021), Aydin and Esen (Citation2017), Beşe and Kalayci (Citation2019), and Balıbey (Citation2015) who did not confirm the EKC hypothesis in the context of Turkey. For studies analyzing the role of other variables for EG-C nexus, Turan Katircioǧlu and Taspinar (Citation2017) found that financial development affected emissions differently on short run and long run. For other studies analyzing emissions, Direkci and Gövdeli (Citation2016) found international tourist arrivals decreased emissions, Magazzino (Citation2016) found no relationship between EG and emissions and Lebe and Akbaş (Citation2015) found that financial development and urbanization significantly affected energy use in the context of Turkey (see, Table ).
Table 4. Literature review
2.2. Objectives, contribution and hypotheses of the study
The contribution of this study is to fill a significant gap in the literature by examining the relationships between C and EXD, and EFPC and EXD which heretofore is not examined in the literature. Confirmation of the inverted U relationship between EXD and C is a unique contribution to the EKC literature.
The objectives of this study are to examine how EXD levels of Turkey affect the environment in C and EFPC terms. Since climate change is among the top issues in the world, examination of the spending of high foreign-indebted countries such as Turkey is important.
The following hypotheses are examined in this study regarding the Kuznets curve relationship between EXD and C, EXD and EFPC for the period between 1970 and 2016 for Turkey.
Hypothesis 1: There is long-run relationship between EXD, G, EXD2 and C.
Turan Katircioǧlu and Taspinar (Citation2017) analyzed the effect of financial development on emissions, Katircioglu (Citation2017) analyzed the effect of oil prices on emissions, Uzar and Eyuboglu (Citation2019) analyzed the effect of income inequality on emissions, and Katircioglu and Celebi (Citation2018) and Akam et al. (Citation2021) analyzed the effect of external debt on emissions. Following these studies, we hypothesize there is long-run relationship between economic growth, external debt and carbon dioxide emissions.
Hypothesis 2: There is inverted U relationship between EXD and C.
Katircioglu and Celebi (Citation2018), Beşe, Friday and Spencer (2021) and Beşe, Friday, Ozden (2021) and Akam et al. (Citation2021) analyzed the effect of external debt on carbon dioxide emissions. Following these studies, we hypothesize there is inverted U relationship between EXD and C.
Hypothesis 3: There is long-run relationship between EXD, G, EXD2 and EFPC.
Köksal et al. (Citation2020) analyzed the effect of SEC on EFP, Bulut (Citation2021) and Charfeddine and Mrabet (Citation2017) confirmed the EKC hypothesis for EG-EFP nexus, and Ozcan et al. (Citation2018) did not confirm the EKC hypothesis for EG-EFP nexus. Following these studies, we hypothesize there is long-run relationship between external debt, economic growth and ecological footprint per capita.
Hypothesis 4: There is inverted U relationship between EXD and EFPC.
Following studies of Köksal et al. (Citation2020), Bulut (Citation2021), Charfeddine and Mrabet (Citation2017), Ozcan et al. (Citation2018), and Köksal et al. (Citation2020), we hypothesize there is inverted U relationship between external debt and EFPC.
Hypothesis 5: EXD has a significant effect on C and EFPC in the long run.
Following studies of Katircioglu and Celebi (Citation2018), Beşe, Friday and Spencer (2021), Beşe et al. (Citation2021) and Akam et al. (Citation2021), we hypothesize external debt has a significant effect on carbon dioxide emissions and EFPC.
In addition to testing the hypothesis above, other relationships between the variables are examined in the results part and addressed in the discussion and conclusions.
3. Data and Methods
The data used in this study is retrieved from the World Bank database website. Data for EFPC is retrieved from the Global Footprint Network website. The variables used in this study are C, EXD, EXD2 and G and EFPC for Turkey for the period 1970 to 2016.
The ARDL model is the general methodology in the EKC literature according to Shahbaz and Sinha (2019). This study also employs the ARDL model to be consistent with current literature and the ARDL model allows for the analysis of the relationship between the variables which are at stability levels of I(0) and I(1). The relationship between C, EXD, square of EXD and G are modeled in the equations below. EXD and EXD2 are used in addition to G which is employed in the traditional environmental Kuznets curve. The addition of energy consumption is not made to the equation since the model did not satisfy the stability requirements in this case. In EquationEquation 1(1)
(1) , C, for carbon dioxide emissions per capita is the dependent variable. On the right side of the equation,
are coefficients for the examined variables which are EXD, square of EXD and G, with
for the error term. In EquationEquation 2
(2)
(2) , EFPC is entered as the dependent variable with the same set of explanatory variables.
3.1. ARDL model application
The ARDL model is used to investigate the cointegration between the variables and is modeled as below in equation 3. M is for long run coefficients and N is for short run coefficients for the related variables. is for White noise residuals.
+
+
(3)
Hypothesis of no cointegration is =
= 0
Hypothesis of cointegration is
0
After cointegration is confirmed, long run coefficients are calculated according to the model of ARDL in equation 4. Short-run coefficients are calculated as in equation 5. Error correction model (ECM) of ARDL model is calculated as in equation 6.
+
+
(4)
+
+
(5)
(6)
3.2. Zivot and Andrews structural break unit root tests application
Zivot and Andrews (Citation1992) structural break unit root test is used to investigate the unit root of the variables in this study. According to unit root test results, 2004 is the break date for G, 1979 is the break date for EXD and EXD2, and 1978 is the break date for C, and 2005 is the break date for EFPC. All the variables are found to be stable at I(1) level except EFPC is found to be stable at I(0) level. 1978 break date is used in the analysis of ARDL model for cointegration between the variables for C, and 2005 break date is used in the analysis for EFPC being the dependent variable. Schwarz criteria is used to determine the number of optimal lags. ARDL model chooses the optimal level of variables according to Schwarz criteria (see, Figure and Figure ).
After cointegration is found between the variables and long run and short run coefficients are calculated, Ramsey Reset Test (RT), Heteroskedasticity Test: Breusch-Pagan-Godfrey (BT), Heteroskedasticity Test: ARCH (HT), Heteroskedasticity Test: White (HTT), Breusch-Godfrey Serial Correlation LM Test (BMT), Normality Test (NM), Cusum Test (CUS) and Cusum square Test (CUSQ) are used to determine if the model is stable.
3.3. Toda and Yamamoto granger noncausality tests application
After cointegration is found and determined the model is stable, the Toda and Yamamoto (Citation1995) granger noncausality test is used to determine the direction of causality between the variables. For calculating the causality with Toda and Yamamoto granger noncausality test, first unit root levels of the variables are considered. Then a lag order is determined to provide the stable model between the variables by running Vector Autoregressive Model (VAR). The stability of the model is checked with VAR Residual Heteroskedasticity Tests (VART), VAR Residual Serial Correlation LM Tests (VARLM) and Roots of Characteristic Polynomial Endogenous variables (RCP). After lag order is determined, a VAR model is run with determined lag order by adding variables as exogenous variables to the system with lag order of determined lag order plus a maximum number of stationary levels of variables which is 1 in this case. The direction of causal relationships between the variables are calculated with VAR Granger Causality/Block Exogeneity Wald Tests. EViews software is used for all calculations in this study.
4. Results
4.0.1. ARDL model results for C and EXD relationship
An ARDL model is used to check the long run relationship between the variables. Cointegration between the variables is confirmed with an F-statistic value of 4.90 with 2.5% significance. After cointegration is found between the variables, cointegration and long run form is run to calculate the short run and long run coefficients of the variables. The cointegration between the variables is confirmed also with the coefficient cointegration equation being −0.48 at the 1% significance. According to ARDL-ECM results, EXD has a significant positive effect on emissions in the long-run with 1% significance and EXD2 has a significant negative effect on emissions in the long run with 1% significance (see Table A2). Results confirm that there is an inverted U relationship between EXD and emissions in the long run which is called an external debt Kuznets curve. Results confirm external debt Kuznets curve in Turkey for the period 1970–2016. G though showing a positive effect on emissions in the long run is not statistically significant. Stability of the model is confirmed with related stability test results provided below (see Table A1, Figure and Figure ).
4.0.2. ARDL model results for EFPC and EXD relationship
ARDL model application for the relationship between EFPC and EXD is satisfactorily established (see Table A3, Figure and Figure ). The long run relationship between the variables is confirmed with cointegration test where F-statistic is significant with 10.46 at the 1% significance and coefficients of the variables are calculated (see Table A4). The long-run relationship between the variables shows that EXD does not significantly affect EFPC, and G has a significant and positive effect on EFPC.
4.1. Zivot and Andrews structural break unit root tests application
First unit root levels of each variable obtained by Zivot and Andrews (Citation1992) Structural Break Unit Root Test. All variables are found to be stable at unit root level 1 except EFPC which is stable at unit root level 0. The structural break dates for the variables are 1978 for C, 1979 for EXD and EXD2 and 2004 for G, and 2005 for EFPC.
4.1.1. Toda and Yamamoto granger noncausality results for C and EXD relationship
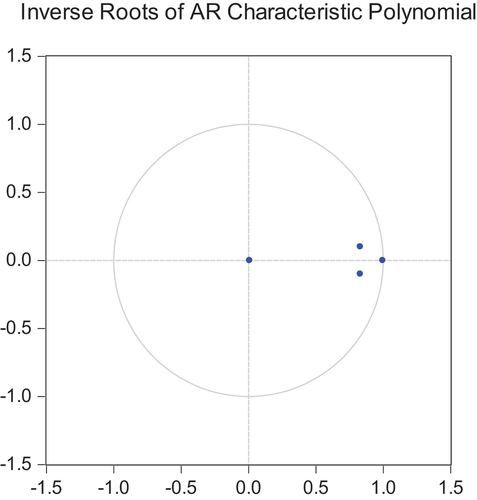
A VAR model is established with lag order satisfying the stability test results. Stability of the established model is confirmed with related stability tests where the VAR Residual Heteroskedasticity test has chi-square value of 365.84, degrees of freedom value of 350 and probability value of 0.2692, and VAR Residual Serial Correlation LM test has LM-stat value of 14.31 and probability value of 0.5750. According to Roots of Characteristic Polynomial Endogenous Variables, no roots lie outside the unit circle and VAR satisfies the stability condition (Figure ). Then, new VAR model is established by adding exogenous variables, and VAR Granger Causality/Block Exogeneity Wald Tests are run (see Table A5). According to the results, causality from EXD and EXD2 to C is confirmed. The causal relationship is not confirmed from G to C with test results. Causality from C to EXD is not confirmed but causality from G to EXD is confirmed. Causality from C to G is not confirmed but causality from EXD to G is confirmed.
4.1.2. Toda and Yamamoto granger noncausality results for EFPC and EXD relationship
A VAR model is established with lag order satisfying the stability test results. Stability of the established model is confirmed with related stability tests where the VAR Residual Heteroskedasticity test has chi-square value of 97.77, degrees of freedom value of 80 and probability value of 0.0862 and VAR Residual Serial Correlation LM test has LM-stat value of 12.15 and probability value of 0.7335. According to Roots of Characteristic Polynomial Endogenous Variables, no roots lie outside the unit circle and VAR satisfies the stability condition (Figure ). Then, new VAR model is established by adding exogenous variables, and VAR Granger Causality/Block Exogeneity Wald Tests are run (see Table A5). According to the results, no causal relationship between the variables is confirmed.
5. Discussion
Turkey began aggressive investment for big projects in 2000 to develop infrastructure and increase efficiency especially in the transportation and energy sectors. Investments mostly financed by foreign debt aimed to decrease transportation times between local places and big cities and increase the percentage of cleaner energy sources. Findings of this study are compatible with this for Turkey’s last two decades of investment that are mostly financed with foreign debt. This study confirms the inverted U relationship between EXD and C which means that EXD first affects environmental pollution then after a point in time, EXD’s effect on environment starts to decrease. This is similar to the relationship between growth and environmental pollution for the traditional EKC hypothesis. This inverted U relationship between EXD and C which is found in this study is compatible with Turkey’s investments financed by foreign debt.
5.1. Relationship between C and EXD
The results of this study show that EXD has a significant effect on C and a causality relationship exists from EXD to Katircioglu and Celebi (Citation2018) confirmed causality from EXD to C in the short run but no causality is found in the long run between EXD and C. Further analysis did not confirm causality from C to EXD which is in line with Katircioglu and Celebi (Citation2018). Akam et al. (Citation2021) on the other hand, found bi-directional causality between EXD and C for a panel of 33 heavily indebted poor countries.
There is no causal relationship between C and G, and G does not have a significant effect on C according to ARDL model results. The results also show that EXD does not increase emissions in the long run which is in line with Katircioglu and Celebi (Citation2018). Akam et al. (Citation2021) found that EXD increases C in the long run for panel of 33 heavily indebted poor countries.
5.2. Relationship between G and EXD
Another result of this study shows that there is bidirectional causality relationship between G and EXD which is also found by Akam et al. (Citation2021) for panel of 33 heavily indebted poor countries. In this case, G and EXD are influencing each other over the long run. Turkey’s growth needs EXD and EXD further influences Turkey’s growth. This finding is also compatible with the current reality that the Turkish economy is over reliant on foreign debt. Although the public sector has tried to minimize its borrowing from external sources, the private sector is still heavily indebted to external sources. This foreign debt problem mostly affects small and medium enterprises which can be more heavily impacted by the fluctuation in exchange rates between the US dollar and Turkish lira to finance their debts.
Over reliance of Turkey on foreign debt has created opportunities for its growth and at the same time created risks for its private sector which mostly consist of small and medium enterprises. Turkey may should consider efforts to minimize the foreign debt reliance for the private sector especially small and medium enterprises. Further regulations for EXD are needed in Turkey since EXD has a significant effect on both C and G.
Turkey should continue to pursue its efforts for efficiency in the construction, transportation and energy sectors. Turkey currently has projects for constructing three nuclear plants within the next 25 years. Turkey has adapted their laws and regulations to accommodate the wind and sun energy sectors. Further efforts are needed to protect and maintain the inverted U relationship between Turkey’s EXD and emissions. Besides the effect of EXD on emissions, EXD’s effect on G is important. Economic regulations are very critical for Turkey to balance its foreign debt with more domestic resources to prevent the impact of foreign debt on small and medium enterprises.
5.3. Relationship between G, EXD and EFPC
EXD does not have a significant impact on EFPC. The results of the ARDL model shows that there is no significant relationship between EXD and EFPC. G positively affects EFPC in the long run but no causal relationship from G to EFPC is confirmed. The results for EFPC are that EXD does not have a significant effect and causal effect on EFPC. Although Turkey’s economic growth increases EFPC, it does not cause EFPC. The overall relationship between EXD, EFPC and G shows that the use of foreign debt does not significantly affect the environment in terms of EFPC, but further policies should be carried out to protect the environment as well.
6. Conclusions
This study examines the Environmental Kuznets Curve relationship between both EXD (External Debt) and G (Economic Growth measured as Per Capita GDP) with C (Carbon Dioxide Emissions) and EFPC (Economic Footprint) from 1970 through 2016 for Turkey.
Turkey historically and especially over the last two decades has relied heavily on EXD to develop its overall infrastructure in the transportation, manufacturing, energy, and construction sectors to improve overall prosperity. These are sectors that can contribute directly to environmental pollution. However, within these investments, Turkey aims to provide big savings for spending on energy and transportation for every citizen and industry through a project called “Savings in Every Place.” The hoped outcome is to reduce these costs which in turn should reduce emissions.
The main findings of this study are that there is long-run relationship between EXD, G and EFPC, an inverted U relationship between EXD and EFPC is not confirmed, G has a significant impact on EFPC in the long run, there is long-run relationship between EXD, G and C which is also confirmed by Katircioglu and Celebi (Citation2018) in Turkey. For other findings of this study, there is bi-directional causality between G and EXD which is also confirmed by Akam et al. (Citation2021) for a panel of 33 heavily indebted countries, there is causality from EXD to C which is confirmed only for the short run by Katircioglu and Celebi (Citation2018) in Turkey, and there is an inverted U relationship between EXD and C.
The inverted U relationship between EXD and C shows that Turkey’s investments for its infrastructure for “Savings in Every Place” may have contributed in reducing carbon dioxide emissions.
The bidirectional causal relationship between G and EXD shows that Turkey’s infrastructure investments and economy are highly dependent on external debt. Turkey should manage this dependency carefully to not destabilize its economic growth and its infrastructure development.
Positive and significant effects of G on EFPC over the long run shows that Turkey may start projects similar to emissions-related issues for ecological footprint issues to stabilize the effect of economic growth on the environment in terms of its ecological footprint.
The time period analyzed and the focus specifically to the case of Turkey are the limits of this study. This study mainly focused on the effect of EXD on emissions in the long run, the significance of EXD on both economic growth and environmental pollution and Turkey’s over reliance on foreign debt. This may limit the applicability of policy recommendations for Turkey to reduce its reliance on foreign debt especially for the private sector which mainly consists of small and medium enterprises and modeling the effect of EXD on carbon dioxide emissions.
This study recommends that further analysis be done for other countries which have high foreign debt to investigate the relationship between EXD and C. In addition, this analysis can be further extended by analyzing total greenhouse gas emissions, methane, nitrous oxide and fluorinated gases. In addition, comparison of EFPC and C can be pursued for other countries as well. Besides greenhouse gas emissions, future research should analyze how different countries spending from foreign debt affects EFPC and its more general effect to the environment than just emissions.
Author contributions
This article has been written in collaboration of two authors – Emrah Beşe and Haven Swint Friday. Emrah Beşe was responsible for research design and analysis. Haven Swint Friday worked on the literature and introduction parts. All the remaining parts of this study were processed in close collaboration of two authors.
Disclosure statement
No potential conflict of interest was reported by the author(s).
Additional information
Funding
Notes on contributors
Emrah Beşe
Emrah Beşe is a researcher. His interests include energy economics, environmental economics, sustainability and health economics. The current paper contributes to wider knowledge in the field of energy economics, environmental economics and sustainability. Specifically, it provides insights into the relationship between external debt and environment which is an important issue especially for developing countries.
H. Swint Friday
H. Swint Friday is a senior lecturer at Texas A&M University – RELLIS. His main teaching courses are Financial Management, Intermediate Corporate Finance and Insurance Principles.
References
- Abul, S. J., Satrovic, E., & Muslija, A. (2019). The link between energy consumption and economic growth in gulf cooperation council Countries. International Journal of Energy Economics and Policy, 9(5), 38–20. https://doi.org/10.32479/ijeep.7872
- Adom, P. K., & Adams, S. (2020). Technical fossil fuel energy efficiency (tffee) and debt-finance government expenditure Nexus in Africa. Journal of Cleaner Production, 271, 122670. https://doi.org/10.1016/j.jclepro.2020.122670
- Ahmad, M., Muslija, A., & Satrovic, E. (2021). does economic prosperity lead to environmental sustainability in developing economies ? environmental kuznets curve theory. Environmental Science and Pollution Research. https://doi.org/10.1007/s11356-020-12276-9
- Akam, D., Owolabi, O., & Nathaniel, S. P. (2021). Linking external debt and renewable energy to environmental sustainability in heavily indebted poor countries : New insights from advanced panel estimators. Environmental Science and Pollution Research, 28(46), 65300–65312. https://doi.org/10.1007/s11356-021-15191-9
- Al-mulali, U., Weng-wai, C., Sheau-ting, L., & Mohammed, A. H. (2015). Investigating the environmental Kuznets curve (EKC) hypothesis by utilizing the ecological footprint as an indicator of environmental degradation. Ecological Indicators, 48, 315–323. https://doi.org/10.1016/j.ecolind.2014.08.029
- Alola, A. A., & Donve, U. T. (2021). Environmental implication of coal and oil energy utilization in Turkey : Is the EKC hypothesis related to energy ? Management of Environmental Quality: An International Journal, 32(3), 543–559.
- Aydin, C., & Esen, Ö. (2017). the validity of the environmental kuznets curve hypothesis for co2 emissions in turkey: new evidence from smooth transition regression approach. Mustafa Kemal University Journal of Social Sciences Institute, 14(39), 101–116.
- Balıbey, M. (2015). Relationships among CO2 emissions, economic growth and foreign direct investment and the environmental kuznets curve hypothesis in Turkey. International Journal of Energy Economics and Policy, 5(4), 1042–1049.
- Beşe, E., Friday, H. S., & Ozden, C. (2021). The effect of external debt on emissions evidence from China. International Journal of Energy Economics and Policy, 11(1), 440–447. https://doi.org/10.32479/ijeep.10605
- Bese, E., Friday, H., & Spencer, M. (2021). Analysis of the relationship between income growth and, coal consumption and emissions from nonlinear perspective. Journal of Academy of Business and Economics, 21(1), 55–77. https://doi.org/10.18374/JABE-21-1.5
- Beşe, E., & Kalayci, S. (2019). testing the environmental kuznets curve hypothesis: evidence from Egypt, Kenya and Turkey. International Journal of Energy Economics and Policy, 9(6), 479–491. https://doi.org/10.32479/ijeep.8638
- Beşer, M. K., & Beşer, B. H. (2017). The relationship between energy consumption, co2 emissions and GDP per capita : a revisit of the evidence from turkey. Alphanumeric Journal, 5(3). https://doi.org/10.17093/alphanumeric.353957
- Bölük, G., & Mert, M. (2015). The renewable energy, growth and environmental Kuznets curve in Turkey: An ARDL approach. Renewable and Sustainable Energy Reviews, 52, 587–595. https://doi.org/10.1016/j.rser.2015.07.138
- Bulut, U. (2021). Environmental sustainability in Turkey : An environmental Kuznets curve estimation for ecological footprint. International Journal of Sustainable Development & World Ecology, 28(3), 227–237.
- Charfeddine, L., & Mrabet, Z. (2017). The impact of economic development and social-political factors on ecological footprint : A panel data analysis for 15 MENA countries. Renewable and Sustainable Energy Reviews, 76, 138–154. https://doi.org/10.1016/j.rser.2017.03.031
- Destek, M. A., & Sarkodie, S. A. (2019). Investigation of environmental Kuznets curve for ecological footprint : The role of energy and fi nancial development. Science of the Total Environment, 650, 2483–2489. https://doi.org/10.1016/j.scitotenv.2018.10.017
- Dinda, S. (2004). Environmental Kuznets Curve hypothesis: A survey. Ecological Economics, 49(4), 431–455. https://doi.org/10.1016/j.ecolecon.2004.02.011
- Direkci, T. B., & Gövdeli, T. (2016). CO2 emission, energy consumption, economic growth and tourism for co2 emission, energy consumption, economic growth and tourism for turkey : evidence from a cointegration test with a structural break. International Journal of Management and Economics Invention, 2(12), 1145–1155. https://doi.org/10.18535/ijmei/v2i12.03
- Dogan, N. (2016). Agriculture and environmental kuznets curves in the case of Turkey : Evidence from the ARDL and bounds test. Agric. Econ. – Czech, 12, 566–574. https://doi.org/10.17221/112/2015-AGRICECON
- Dogan, E., Taspinar, N., & Gokmenoglu, K. K. (2019). Determinants of ecological footprint in MINT countries. Energy and Environment, 1–22. https://doi.org/10.1177/0958305X19834279
- Gökmenoğlu, K., & Taspinar, N. (2016). The relationship between Co2 emissions, energy consumption, economic growth and FDI: The case of Turkey. Journal of International Trade and Economic Development, 25(5), 706–723.
- Gozgor, G., & Can, M. (2016). Export product diversification and the environmental Kuznets curve : Evidence from Turkey. Environmental Science and Pollution Research, 23(21), 21594–21603. https://doi.org/10.1007/s11356-016-7403-9
- Katircioglu, S. (2017). Investigating the role of oil prices in the conventional ekc model: evidence from Turkey. Asian Economic and Financial Review, 7(5), 498–508. https://doi.org/10.18488/journal.aefr/2017.7.5/102.5.498.508
- Katircioglu, S., & Celebi, A. (2018). Testing the role of external debt in environmental degradation : Empirical evidence from Turkey. Environmental Science and Pollution Research, 25(9), 8843–8852. https://doi.org/10.1007/s11356-018-1194-0
- Köksal, C., Işik, M., & Katircioğlu, S. (2020). The role of shadow economies in ecological footprint quality: Empirical evidence from Turkey. Environmental Science and Pollution Research, 27(12), 13457–13466. https://doi.org/10.1007/s11356-020-07956-5
- Kuznets, S. (1955). economic growth and income inequality. The American Economic Review, 45(1), 292–302. https://doi.org/10.1596/978-0-8213-7318-7
- Lebe, F., & Akbaş, Y. E. (2015). Effect of industrialization, financial development, economic growth and urbanization on energy consumption in turkey: an evidence with multiple structural breaks. EGE ACADEMIC REVIEW, 15(2), 197–206.
- Magazzino, C. (2016). the relationship among real gross domestic product, co2 emissions, and energy use in South Caucasus and Turkey. International Journal of Energy Economics and Policy, 6(4), 672–683.
- Ozcan, B., Apergis, N., & Shahbaz, M. (2018). A revisit of the environmental Kuznets curve hypothesis for Turkey: New evidence from bootstrap rolling window causality. Environmental Science and Pollution Research, 25(32), 32381–32394. https://doi.org/10.1007/s11356-018-3165-x
- Ozturk, I., Al-Mulali, U., & Saboori, B. (2016). Investigating the environmental Kuznets curve hypothesis: The role of tourism and ecological footprint. Environmental Science and Pollution Research, 23(2), 1916–1928. https://doi.org/10.1007/s11356-015-5447-x
- Ozturk, Z., & OZ, D. (2016, June). the relationship between energy consumption, income, foreign direct investment, and co2 emissions: the case of Turkey, 0–20
- Pata, U. K. (2018a). The effect of urbanization and industrialization on carbon emissions in Turkey: Evidence from ARDL bounds testing procedure. Environmental Science and Pollution Research, 25(8), 7740–7747. https://doi.org/10.1007/s11356-017-1088-6
- Pata, U. K. (2018b). The influence of coal and noncarbohydrate energy consumption on CO2 emissions: Revisiting the environmental Kuznets curve hypothesis for Turkey. Energy, 160, 1115–1123. https://doi.org/10.1016/j.energy.2018.07.095
- Toda, H. Y., & Yamamoto, T. (1995). Statistical inference in vector autoregressions with possibly integrated processes. Journal of Econometrics, 66(1–2), 225–250. https://doi.org/10.1016/0304-4076(94)01616-8
- Turan Katircioǧlu, S., & Taspinar, N. (2017). Testing the moderating role of financial development in an environmental Kuznets curve: Empirical evidence from Turkey. Renewable and Sustainable Energy Reviews, 68(1), 572–586. https://doi.org/10.1016/j.rser.2016.09.127
- Uzar, U., & Eyuboglu, K. (2019). The nexus between income inequality and CO2 emissions in Turkey. Journal of Cleaner Production, 227, 149–157. https://doi.org/10.1016/j.jclepro.2019.04.169
- Zivot, E., & Andrews, D. W. K. (1992). Further evidence on the great crash, the oil-price shock, and the unit-root hypothesis. Journal of Business and Economic Statistics, 10(3), 25–44.
Appendix
Table A1. Stability Test Results for ARDL Model of C-EXD Relationship
Table A2. ARDL-ECM Test Results for C-EXD Relationship
Table A3. Stability Test Results for ARDL Model of EFPC-EXD Relationship
Table A4. ARDL-ECM Test Results for EFPC-EXD Relationship
Table A5. VAR Granger Causality/Block Exogeneity Wald Tests
Figure A1. ARDL model selection according to schwarz criteria.
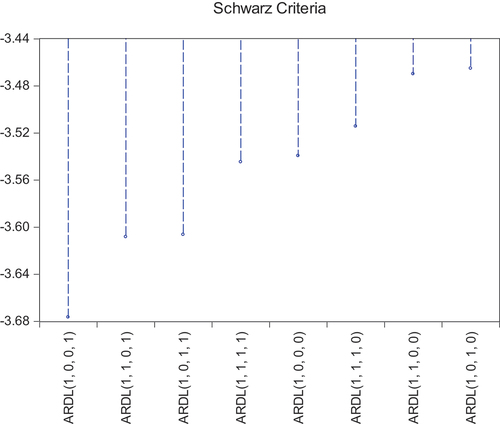
Figure A2. CUS test results for ardl model of C-EXD relationship.
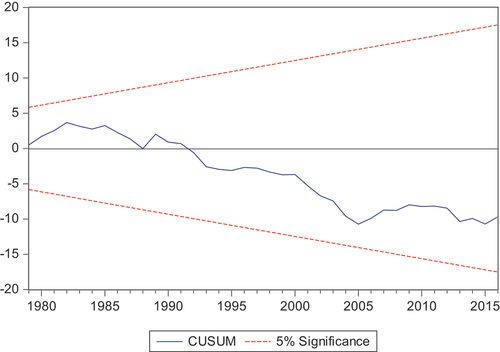
Figure A3. CUSQ test results for ardl model of C-EXD relationship.
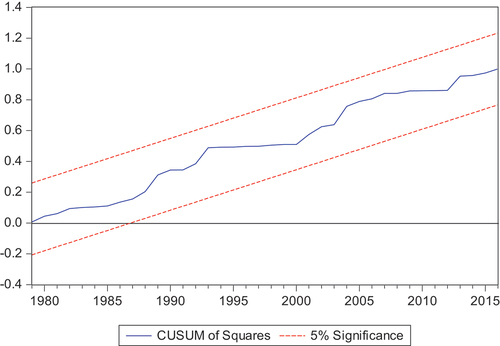
Figure A4. ARDL model selection according to Schwarz criteria.
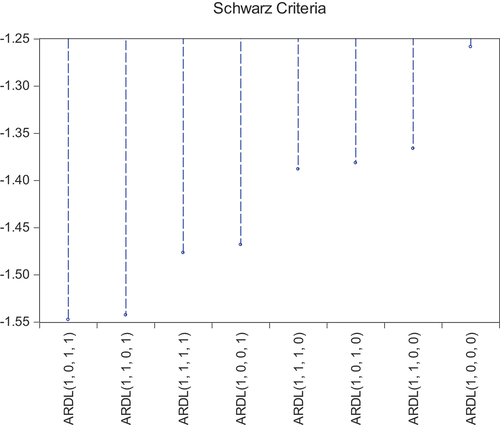
Figure A5. Cus test results for ardl model of EFPC-EXD relationship.
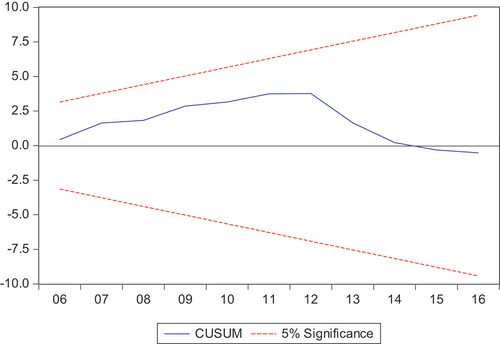
Figure A6. CUSQ test results for ardl model of EFPC-EXD relationship.
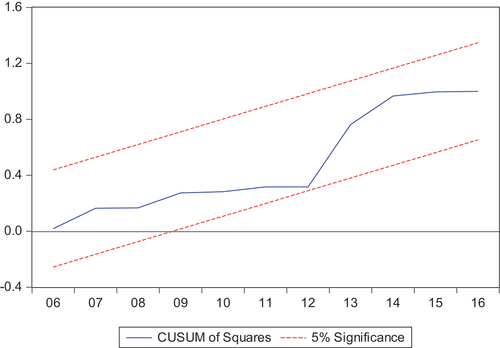
Figure A7. Roots of characteristic polynomial endogenous variables.

Figure A8. Roots of characteristic polynomial endogenous variables.