
 ?Mathematical formulae have been encoded as MathML and are displayed in this HTML version using MathJax in order to improve their display. Uncheck the box to turn MathJax off. This feature requires Javascript. Click on a formula to zoom.
Abstract
The aim of this study is to assess the contribution of the international business sector (IBS) to the development of the national economy. A new index has been developed, which is expressed as a primary income share and makes it possible to analyze IBS structure both by the primary income from abroad (received) share and by the value added export share. This study analyzes the long-term development trends of IBS and its structural shifts for OECD and top non-OECD countries. Our new index has increased markedly in OECD countries, where IBS generated a third of primary income in the middle of the second decade of the analyzed period. In contrast, in top non-OECD member countries, this index grew slowly, while IBS generated about one-fifth of primary income. To analyze qualitative shifts in IBS growth in terms of cluster analysis OECD countries have been grouped according to the prevailing IBS models. The results showed that OECD countries changed their basic IBS model moving from the Partial model to the Dual one. It is the change in this basic model that accounts for the long-term trend of increasing gap in the development level of IBS in OECD and top non-OECD countries.
Public interest statement
This study analyzes the long-term development trends of international business activities comparing OECD and top non-OECD countries.
The study confirms the long-term trend of the increasing gap in the development of international business sector (IBS) in the analyzed countries. The reason is the change in the basic model of IBS, the variety of which is also developed in the study.
Real indicators based on accounting in the IBS value in the national economy for countries under consideration significantly exceed indices calculated using the traditional method. This fact may affect important decisions of policy makers on further granting credits to certain countries.
The aforesaid considerations confirm the advantage of using the concept of IBS value for international comparisons, including calculating the indices implemented by the World Bank.
1. Introduction
In the context of the increasing globalization, international economic integration, and regionalization, no country can keep out of the current global trends. All the processes mentioned above are quite controversial, providing both new opportunities, impulses for the social and economic development of states and emergent threats as well. However, each state aspires to maximize the benefits of participation in various forms of international economic relations (international trade, movement of factors of production, transfer of technology or industrial cooperation) as well as to minimize losses. Against the background of the emergence of new opportunities to use international relations as an additional factor of economic growth, there is an issue of adequate assessment of the contribution of such a factor made to the economic development of a national economy. In this regard, the study of the international business sector is of particular relevance. The research carried out within national economic sectors is of great importance, as it provides aggregated indices and can serve as an outstanding reference point for both business development and public policy formulation. Against the backdrop of the present-day world, this research is primarily important for the international business sector, its significance growing rapidly.
As section “Literature Review” will demonstrate, today in contemporary investigations IBS is mainly analyzed on the basis of the ownership criterion, and in this respect can be estimated on the basis of the share of gross domestic product (GDP) created by foreign enterprises in the territory of the country.
At the same time, understanding of IBS as a set of national enterprises focused on doing business internationally, i.e. international transactions, is very rare. In such research, the authors raise the question of how to ensure the presence of domestic business in the world markets, its participation in all forms of international economic relations (IER) and its formation as global firms (Warner-Søderholm et al., Citation2014).
However, following this approach, IBS is the most undeveloped category, and, moreover, it remains unclear which key indices should this sector be estimated with. This undeveloped part of the issue serves as a basis of our research. Consequently, our understanding of IBS relies on the necessity to assess the contribution of domestic business involved in various types of international transactions to the development of the national economy. Since the definition of IBS is not sufficiently developed, the contribution of this phenomenon as a factor of development of the national economy is still not comprehensively estimated; no methodology has been elaborated to assess this contribution. Therefore, the presented research is urgent and relevant.
On the basis of above-mentioned, the objective of the article could be formulated. The main goal of this research is to assess the contribution of IBS being defined by the criterion of international transactions to the development of a national economy.
The main steps of the research are the following:
1. Analysis of existing views and formulation of the author’s concept of IBS.
2. Development of indicators corresponding to the concept of IBS.
3. Selection of countries’ groups for analysis: OECD countries and a group of top non-OECD countries.
4. Choosing the database for collection of empirical data on IBS functioning.
5. Analysis of trends in OECD countries compared to the group of top non-OECD countries.
6. Analysis of changes in groups within OECD countries.
7. Interpretation of relationship of external changes relative to the group of top non-OECD countries and changes within OECD countries.
2. Literature review
Predominantly, the term “International Business Sector” (IBS) is being used in practice (”Barbados: IMF Country Report,” Citation2018; PriceWaterhouseCoopers Report; Doing Business in Bermuda: Country Commercial Guide for U.S. Companies, Citation2016), while in the scientific literature it is being used rarely and occasionally (Worrell, Citation2017). There are a number of different interpretations of the category. Understanding of IBS as a set of foreign companies (primarily multinational companies), their branches, and subdivisions operating in the country is presented in scientific literature much broader. Within this framework, the following issues are frequently analyzed: the nature of the impact of MNCs on the host country’s economic development (Castellani et al., Citation2018; Pearce, Citation2017); the host country’s attitude towards the activities of MNCs while attempting to maximize benefits and minimize risks (Durović, Citation2018). Besides, economists discuss the potential challenges and opportunities for MNCs in the profit-making process in host countries; cross-cultural communication among Western MNCs operating in Africa; resource- and rent-seeking behavior of MNCs; opportunities to resist neocolonial business methods and strategies (Nyuur et al., Citation2018).
In the context of an institutional perspective, the impact of national institutions on MNCs’operation is analyzed, and how international companies can implement the diversity of national economic institutions in the development of their business strategies is considered (Jackson & Deeg, Citation2008). Also, the peculiar trend of the IBS studies, which is gaining popularity today and is connected with attempts to combine academic knowledge with practical business research, is being emphasized (Nyuur et al., Citation2018). The interdisciplinary approach while carrying out the IBS study is reflected in the publication “The Routledge Companion to the Geography of International Business” (Nyuur et al., Citation2018). Research in the field of emerging markets (Africa, China) is particularly relevant today (Castellani et al., Citation2018); thus, this paper is within the mainstream of recent investigations.
The particular practical rather than the theoretical aspect of IBS category is reflected in the concept of International Business and Financial Services Sector, which is widely used in “host jurisdictions” states, i.e. host territories for international companies providing a “domicile”—a legal address; in other words, these are offshore zones (for instance, Bermuda, Barbados, Bahamas, Antigua and Barbuda). In this sense, IBS makes a significant contribution to the economies of these countries. For example, in Barbados, IBS is a substantial source of foreign exchange earnings, being the second after tourism (”Barbados: IMF Country Report,” Citation2018, P. 2; Worrell, Citation2017). Financial offshore centers, according to scientists (Butkiewicz & Gordon, Citation2013; González-Miranda et al., Citation2013), have a positive impact on the growth of national income within the national economies of these countries; in Barbados and Bahamas, they contribute 7–9% of GDP. In Barbados, IBS includes such groups of companies as International Business Companies, International Societies with Restricted Liability, Exempt Insurance Companies, Qualifying Insurance Companies, International Banks. They are engaged in export-import, production, research, financial and credit, insurance activities, real estate transactions as well. Having entered into tax agreements with such countries as the USA, Great Britain, Canada, Switzerland, China, Barbados offers significant tax preferences to IBS enterprises. It is interesting though that the International Business Companies within IBS are residents of Barbados; however, they must carry out trading or manufacturing activities only for the export purposes (”Barbados: IMF Country Report,” Citation2018, pp. 2–6, PriceWaterhouseCoopers Report, P. 4–6). In Bermuda, IBS is represented, mainly, by financial services, i.e. insurance, securities trading, consulting; and makes 27% of GDP and 11% of the employed population (Doing Business in Bermuda: Country Commercial Guide for U.S. Companies, Citation2016, P. 55).
3. Materials and methods
Methodology background. IBS can be understood in two ways: firstly, by the criterion of ownership as a result of the operation of a set of foreign entities of international business within the national economy; secondly, by the criterion of transactions perceived as functioning of internal entities, both resident and non-resident, engaged in international business. Definitely, the second understanding is more comprehensive, as it is being taken as a basis in this study.
The holistic assessment of IBS represents a weak point. There are many indices that can describe IBS in terms of international trade, international investment, and contractual forms of international business; however, they cannot be brought down to a common denominator. In order to obtain such a comprehensive assessment of the international business sector, it is worth using the approaches applied in the analysis of other economic sectors. The methods of assessment of institutional sectors of the economy are the most developed.
Unfortunately, though IBS is not an institutional sector as is the case with the transactional sector. Along with the results of the international activities of entities wholly engaged in international business, it includes the results of the international activities of only partially engaged entities. Disturbingly, it is impossible that IBS be applied to a universal method of assessment introduced both to institutional sectors of the three-/five-factor model as well as to the transactional sector (by a fraction of the added value created in the economy), because, coupled with the added value, the results of its functioning are reflected in the income generated and received from abroad.
International business, on the one hand, may be determined as “consisting of transactions that are devised and carried out across national borders to satisfy the objectives of individuals and organizations”. At the same time, it can be defined as “any firm (or a «quasi-firm»—our note) that engages in international trade and investment”. International business is also understood as the set of cross-border transactions carried out either by all entities or firms only (Bonsu, Citation2015).
Having considered the above mentioned, two utmost important factors can be followed. In the first instance, within the framework of international business, the transactions are concerned. In other words when considering primary and secondary income from abroad, only the first one should be taken into account, since the latter constitutes transfers rather than transactions. In the second instance, the subject of international business can be considered as all transactions, as well as those that are the objects of activity of firms. There is no consensus on the issue. In this regard, either all primary income from abroad or only their part related to the activities carried out by firms can be taken into account as the performance results of the IBS activity. Let us focus on a more comprehensive option, which corresponds to the objectives of our study better.
Methodology implementation. Respectively, in order to implement the concept discussed in the first part, it is required to A) identify a part of the value added, created by IBS in the country; B) determine the amount of factor income coming from abroad. While the first part of the issue corresponds to the general indices of estimation of economic sectors, the second one is sector-specific, as it is determined by the features of IBS in comparison with other economic sectors.
A) Primarily, it should be highlighted that IBS is fundamentally different from the foreign sector. Considering the practical implementation of the categories of foreign sector, International Business Sector and opportunities to assess their contribution to the development of a national economy, it is worth noting the following. In macroeconomic understanding of the four main macroeconomic subdivisions (households, firms, the state and the foreign sector) foreign sector is expressed in net exports (Xn), i.e., is based on the elements of calculating GDP by expenditure or in net demand of foreign institutional entities on domestic production. Usually, the contribution of the foreign sector (Xn into GDP) to the national economy is being assessed. It is acknowledged that due to the foreign sector the GDP growth rate increases (for instance, out of 3% GDP growth rate, the foreign sector provides 1%). However, this category as well as the corresponding index has several drawbacks: a) it depends not only on the activity of the domestic business but also on foreign business; b) it includes an intermediate product; c) it excludes investments and factor income.
Consequently, the “foreign sector to GDP” index reflects the difference between the domestic IBS and foreign IBS contribution. The widely used index “ratio of export to GDP” allows for avoiding this limitation. Nevertheless, the “ratio of export to GDP” index poorly reflects the IBS contribution made to the national economy as GDP contains net exports, but not its entire value. This is clearly demonstrated by the fact that for a number of countries it exceeds 100% (Luxembourg, Malta, Ireland, Saint-Martin, Singapore, Hong Kong, Vietnam, UAE in 2017), and for others, this contribution is simply distorted. Insufficient accuracy of the “ratio of export to GDP” (this indicator frequently overestimates the contribution of exports to GDP) to assess the impact of external factors on economic development, as well as to assess the dependence of economic growth on the dynamics of exports, is also emphasized in certain studies (Breslin, Citation2012, P. 79; Kim et al., Citation2017, P. 6).
The disadvantages of the “export to GDP ratio” can be eliminated with the help of the less frequently analyzed “value added export to GDP ratio”, which, however, is used in the IMF reports and several pieces of research (”Republic of Korea IMF Country Report,” Citation2010; Alhayat, Citation2013; Arora & Cardarelli, Citation2010).
Value added export could be calculated by deducting the value of imported components from the total export value (Breslin, Citation2012, P. 79; Johnson, Citation2014). This is exactly the “domestic value-added exports” being calculated by excluding the “foreign value-added”, i.e. added value originated in other countries and imported for the creation of goods that make up the export of the country (Banga, Citation2013, P. 7). From henceforth, we shall understand the “value added export” index as “domestic value-added exports”.
In this regard, there are studies dedicated to the comparison of the shares of “domestic value-added content” and “foreign (imported) value-added content” in gross value of total export. For instance, for Asian countries, the shares range from 52% to 48%, respectively, in Vietnam to 75% and 25% in China (Athukorala et al., Citation2014, pp. 177–178).
Concerning the dynamics of “domestic value-added exports”, the authors point to a downward trend of its share in the total exports of many developing countries, such as India (by 12%), South Korea (by 17%), China (by 21%). At the same time, some developed and developing countries tend to increase it (Great Britain, Italy, Malaysia, Russia; Banga, Citation2013, P. 9).
Comparing the “export to GDP ratio” and “value added export to GDP ratio”, it is explained that when the export is calculated based on the value added, its contribution to economic growth (following Asian countries example) is being assessed as much higher than the simple net export index calculated in the framework of the SNA (Arora & Cardarelli, Citation2010). Sometimes both of these indicators are examined and compared (Eichengreen et al., Citation2010).
Generally, if there is no re-export, the “value added export to GDP ratio” cannot exceed 100%. Further, still it is believed that it can reach no more than 50% since the public sector, transport, and housing and utilities sectors produce non-market products that are not supplied to the foreign market (Shaikh, Citation2007, P. 136).
There are challenging research lines based on the “value added export to GDP ratio”, which seems to be quite informative (Alhayat, Citation2013). Specifically, the growth rates of the “value added export to GDP ratio” and annual growth rates of the “destination market’s GDP-to-World’s GDP ratio” are compared. Whereas the growth rate of the “value added export to GDP ratio”, hence export revenues, exceeds the growth rate of target markets, it means that this country is well positioned to increase its presence in foreign markets.
This index can be used to evaluate the role of IBS, however, the comprehensive reflection of its contribution is rather questionable, as, in fact, it represents only one form of international business, i.e. international trade.
where IBSVAS—contribution of IBS to GDP expressed as value added share;
VAE—value added export;
GDP—Gross Domestic Product.
In fact, sometimes the “value added export to GDP ratio” is being referred to as “foreign earnings, share in GDP” (Foster et al., Citation2012; Pieters et al., Citation2012); and economists conclude that new measures of trade are needed for the modern international economy.
Indeed, the “foreign earnings” index covers only export revenues, while those that are received as primary incomes are not reflected, which generally stands to reason since they comprise the Gross National Income (GNI) rather than GDP.
B) As can be seen from the above, and having considered various indices apt to be used for IBS analysis, including “value added export to GDP ratio”, we find these indices to be insufficient. Therefore, the practical part of the research methodology lies in the development of another, more appropriate sector-specific indicator for IBS characterization as well as the analysis of its dynamics. The analysis of the index is being carried out through the chain and base indices, which represents the key research method applied in our study.
The issues mentioned above can be bypassed by calculating the ratio of a sum of “value added export” and “primary incomes from abroad received” to GNI. However, both this index and the “export to GDP” one do not accurately reflect the contribution of IBS to the national economy, since, just as GDP contains the net export, but not its entire value, GNI is comprised only of net factor income rather than all primary income from abroad received by the national economy.
However, this issue can be solved through the implementation of other indices of the System of National Accounts (SNA). Indeed, based on the definition of GNI:
where PIFA—primary income from abroad (received);
PITA—primary income to abroad;
PITR—primary income total resources;
PITU—primary income total uses;
GDP—Gross Domestic Product;
GNI—Gross National Income.
Namely, the “primary income total resources” index (equal to “primary income total uses”) includes all primary incomes received from abroad, as opposed to net factor income alike GNI. In absolute terms IBS can be expressed as amount of “value added export” and “primary income from abroad (received)”..
where IBS—the size of International Business Sector by primary income;
VAE—value added export;
PIFA—primary income from abroad (received).
Thus, the calculation of the ratio of the amount of “value added export” and “primary income from abroad (received)” to primary income total resources gives a clear assessment of the IBS contribution to the national economy functioning based on the index of “primary income total resources”. This ratio, expressed in the final index of IBSPIS, except for errors, can never exceed 100%.
where IBSPIS—contribution of IBS to PITR, expressed as primary income share;
IBS—the size of International Business Sector by primary income;
PIFA—primary income from abroad (received);
GDP—Gross Domestic Product;
PITR—primary income total resources.
Due to this index, it is possible to precisely divide the primary income total resources both into a share of the income received domestically and covered from abroad, which reflects the contribution of IBS, while the rest is covered by the domestic sources of the country.
Consequently, following the logic of the research, the authors moved from studying the international business activities to investigating the international business sector. The current scientific literature explores other sectors, namely primary, secondary, tertiary as well as institutional sectors in the National Accounts, and, in addition, the transaction and transformation sectors. But for their assessment economists use certain indicators as a share to GDP. Also, in the previous studies, international business activity was characterized by a set of non-sector indicators (for example, “export to GDP ratio”, “value added export to GDP ratio”, “ratio of value-added to gross exports” etc.). Such indicators are used to analyze the major export drivers of economic growth (Hagemejer & Mućk, Citation2019; Jangam et al., Citation2021), to investigate the effects of exchange rates on value-added exports (Choi, Citation2021), to explain the link between economic complexity and growth (Koch, Citation2021), to document changes in the value-added content of trade (Johnson & Noguera, Citation2017). IBS requires a different methodology, which is implemented in this study.
Within the framework of the research, and in order to carry out an analysis and comparison of the trends, the two groups of counties are being concerned: all countries making up the Organization for Economic Co-operation and Development (CitationOECD Statistical information,) and a certain group of countries unaligned to OECD, however, having close ties with the latter. In particular, this group includes: OECD key partners (Brazil, China, India, Indonesia, and South Africa, all-G20 members), several other non-OECD G20 members (Russian Federation and Argentina, missing oil producing Saudi Arabia) as well as OECD candidates for accession (Colombia and Costa-Rica, as of 2019), all of these being abbreviated as top non-OECD countries. It can be easily noticed that the group comprises all BRICS countries. Basically, the specified two groups of countries are the typical representatives of the developed countries and emerging markets. Besides, many non-OECD resource-poor countries do not have sufficient sources to increase their value added exports (Arkhiiereiev et al., Citation2021). The statistics used in calculations were taken from OECD statistics database (https://stats.oecd.org/) and the World Bank database (https://data.worldbank.org/).
Obtaining value-added estimates is the most challenging issue. It is generally agreed that OECD-WTO Trade in Value Added (TiVA) database is the most qualitative and reliable (Utz-Peter Reich, Citation2018; Ceglowski, Citation2019). Therefore, despite the availability of alternative bases, it was TiVA that we decided to use. Unfortunately, high-quality TiVA benchmarks are available only with a significant delay, which sometimes reaches 5–6 years between the releases of various revisions and is not less than 3 years at the time of the release of a new edition. In this respect the TiVA loses out to some other databases. That is why a significant lag is inherent for the analyzed data. The data with a significant lag are also used in articles (Bohn et al., Citation2021).
The first release of TiVA indicators was published on the 16th of January 2013 and contained the data for the years 2005, 2008, 2009 only. At the time of writing this article, the following revisions of TiVA database were available: TiVA-2015 only containing the data with gaps, TiVA-2016 presenting the data for the period of 1995–2011 and TiVA 2018 presenting the years 2005–2015. The revisions mentioned were based on different editions of Input-Output tables: the 2015 version of OECD’s Inter-Country Input-Output (ICIO) Database, the 2016 version of OECD’s Inter-Country Input-Output (ICIO) Database and the 2018 version of OECD’s Inter-Country Input-Output (ICIO) Database respectively. Therefore, in a strict sense, data is incomparable between different versions. Moreover, TiVA-2016 was the longest database, and TiVA-2018 was the newest one.
In addition, there was a short database TiVA Nowcast Estimates in OECD.Stat, presenting the years 2012–2014. The Nowcast Estimates are made consistent with TiVA data, covering the period of 1995–2011. Thus, by arranging the TIVA-2016 data with TiVA Nowcast Estimates we obtained a set of comparable data for two decades of 1995–2014. It is more preferable compared to TiVA-2018 which covers only one decade and contains data for only one more year.Footnote1
The basic limitations of the conducted research connected with usage of proposed methodology include the following. First, the approach is limited to official estimates of gross output and value-added by industry and national accounts main aggregates of demand and trade. Furthermore, the database does not cover all the national economies.
4. Results and discussion
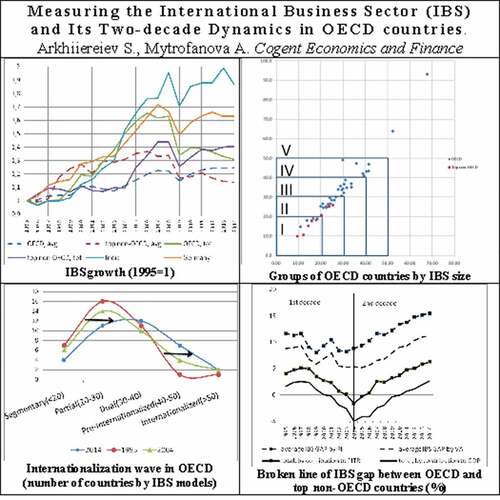
Considering the dynamics of changes in two specified main indices characterizing the International Business Sector, namely IBSVAS («value added export to GDP ratio», reflecting the contribution of IBS to GDP, expressed as value added share of GDP) and IBSPIS, (reflecting the contribution of IBS to PITR, expressed as primary income share) in two groups of countries—OECD and top non-OECD countries, we can pay attention to the following consistent patterns.
In OECD group of countries (see, Figure ) one may identify several similar dynamic trends in IBSVAS and IBSPIS. First, they increased smoothly until 2000–2001, then, owing to the crisis, decreased in 2001–2003. Further, the upward trend persisted until 2008. In 2009, there was a sharp short-term decline due to the global financial and economic crisis, and then during 2010–2014 the resumption of smooth growth was observed.
Figure 1. International business sector primary income and value added shares,%, for OECD countries. Source: Authors’ drawing based on OECD statistics and the World Bank database.
Altogether, the average value of IBSVAS within OECD group of counties for the period 1995–2014 went up by 4,53 points. The average value of IBSPIS for the period 1995–2014 went up by 5,09 points, that is the importance of foreign sources in the formation of primary income of OECD countries increased, which indicated strengthening of trends of production internationalization and tendencies of globalization in terms of the world economy, especially among developed countries. In fact, the trade share within developed countries is higher than among developed and developing countries.
In regards to the maximum and minimum values of the analyzed indices within OECD group, the “leaders” and “outsiders” for both indices are the same. Thus, Luxembourg has the largest share of value added export in GDP and, accordingly, the contribution of foreign sources in generating Luxembourg’s primary income is the highest. The United States has the smallest share of value added export in GDP, while it is observed the smallest contribution of foreign sources in generating primary incomes as well.
The waves of dynamics of the values of both indicators for individual countries also follow the already analyzed dynamics of changes in the average ratio values.
Within top non-OECD countries, the dynamics of the average values of IBSVAS and IBSPIS indicators (see, Figure ) over a period of 1995–2014 deems to be quite similar. Until 1999, there was an upward trend in this regard, while during 2000–2002 a downward one, in 2003–2006 a gradual increase followed by a new decline in 2009 was observed, and a further gradual decline could be seen between 2010 and 2014.
Figure 2. International business sector primary income and value added shares, %, for top non-OECD countries.Source: Authors’ drawing based on OECD statistics and the World Bank database.
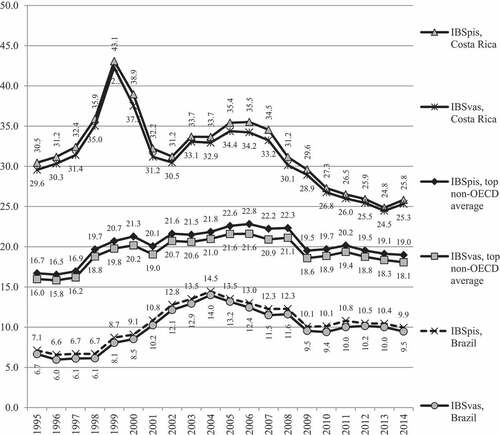
As a result of such changes, the absolute variation of the average IBSVAS index for top non-OECD countries over a period of 1995–2014 is only +0,48 points. The absolute variation of the IBSPIS index for the analyzed period is also slight, amounting to +0,77 points, that is, the value of foreign sources while generating primary income of top non-OECD countries increased insignificantly.
Concerning the maximum and minimum values of the analyzed indicator within the group of top non-OECD countries, the “leaders” and “outsiders” regarding both indicators also coincide: they are Brazil and Costa Rica. Costa Rica has the highest share of value added export in GDP; consequently, the contribution of foreign sources that generate primary income of Costa Rica is also the highest. Brazil has the lowest share of value added export in GDP and, generally, the lowest contribution of foreign sources made to primary income generation.
However, the waves of changes in the maximum and minimum values for some countries differ from the average trends. For example, changes in the value of indicators in Costa Rica are represented much more clearly than within the group of countries on the average. The dynamics of these indices in Brazil (the minimum values) reflected an upward trend until 2004, which was further replaced by a downward trend until 2014.
Comparing the dynamics of the average values of the analyzed indicators in both groups of countries, it can be observed that their drop in the crisis periods within top non-OECD countries was sharper; and over a period of 2010–2014 within top non-OECD countries the average values were characterized not by an upward trend, as in OECD countries, but by a downward one. Overall, the average values of both indicators in top non-OECD countries increased less markedly than in OECD countries between 1995 and 2014. These differences may be hypothesized as the world economy is characterized by widening the gap between developed and developing countries in terms of the origin of products being produced and supplied to external markets: developed countries produce significantly more high-value-added products. Consequently, if such a trend is persisting, the imbalances between developed and developing countries at the levels of economic and social development can be expected to widen further.
At the same time, when considering the IBSVAS and IBSPIS indicators for two groups of countries, it should be emphasized that the second is more accurate and provides a more comprehensive assessment of the contribution of the IBS sector to the national economy, while the former only evaluates foreign trade activities.
For more accurate analysis, it is permissible to compare the growth rate of the average value of the IBSPIS index during several periods over 1995–2014 in two groups of countries as well. Based on the data, five periods can be distinguished for comparison: 1995–2000, 2000–2002, 2002–2008, 2008–2009, 2009–2014. In assessing the evolution of the average value of the analyzed index, the following trends can be observed.
Over a period of 1995–2000, the average value of IBSPIS index increased by 10,7% in OECD countries and by 27,4% in top non-OECD countries, i.e. to a much greater extent. For a period of 2000–2002 (economic crisis), the average value declined by 1,8% in OECD countries, while in top non-OECD countries it grew by 1,6%. For the period from 2002 to 2008, the average value went up again, but the nature of the growth differed from that of a period between 1995 and 2000: in OECD countries, such a growth became more significant (by 12,4%) than in top non-OECD countries (by 3,3%). Over a period of 2008–2009 (the global financial and economic crisis), there was an overall decline in the average value: OECD countries experienced a smaller decline (by 6,1%) than top non-OECD countries (by 12,6%), although a deeper one than in the previous period of the crisis (2000–2002). For the period from 2009 to 2014, growth of the average value of IBS in OECD countries (by 8,6%) became less dynamic than in the 2002–2008 period, but significantly outpaced top non-OECD countries’ index, where it was negative (−2,3%).
When the basic growth rate of the IBSPIS index in two groups of countries is being assessed, as well as the basic growth rate of its average value, one may observe the following tendencies (see, Figure Figure ). In Figure Figure , the year of 1995 is taken as a unit. Until 1999, the basic growth rates of the total value of the IBSPIS index within OECD countries outstripped top non-OECD countries. In 1999–2008 the trend changed dramatically: the growth rate in top non-OECD countries exceeded the values of OECD countries. In 2009, there was an expected downward trend due to the crisis. Within the period of 2011–2014, the trend changed again: OECD countries renewed growth (however, it did not reach the values of 2007–2008), while in top non-OECD countries the IBS indicator declined.
Figure 3. IBSPIS growth rate, OECD, top non-OECD countries, India and Germany, total and average, 1995 is a base year.Source: Authors’ drawing based on OECD statistics and the World Bank database.
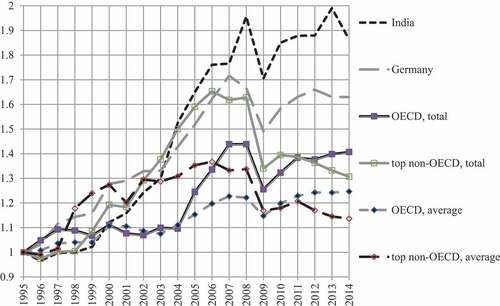
The basic growth rates of the average value of the IBSPIS index in two groups of countries show similar dynamics. Thus, in 1997–2008 the growth rates of the average value in top non-OECD countries exceeded OECD values; then it was followed by a general drop in 2009; and since 2009, OECD countries have been reviving growth, while top non-OECD countries have been demonstrating a decline in the IBS value.
In general terms, the compound annual growth rate of the IBS share in primary income within OECD countries over a period of 1995–2014 was equal to 1,1% per year, while in top non-OECD countries it was equal to 0,6% per year. Nevertheless, the IBS development within the period under consideration was uneven. In the first decade (1995–2004) the compound annual growth rate in OECD countries amounted to 12,3% per year; in top non-OECD countries it amounted to 34,8%. However, in the second decade, the compound annual growth rate decreased dramatically. In OECD countries it was equal to 0.6% per year; in top non-OECD countries it was negative and equal to −0.7% per year.
In addition to a more accurate representation of the IBS value, the IBSPIS index makes it possible to analyze the IBS structure, which consists of factors of production used within the country but actualized abroad, and factors of production used abroad, the income from which directly entered the country. They are shown by the index of primary income from abroad (received) share in the IBS and the complementary index of the value added export share in the IBS, respectively.
where PIFAS—primary income from abroad (received) share;
VAE S—value added export share;
IBS—the size of International Business Sector by primary income;
PIFA—primary income from abroad (received);
VAE—value added export.
The analysis performed shows that on average for OECD countries, the first index changed over a period of 20 years from 13.6% to 20.6% (see, Figure Figure ), with OECD countries maximum value being even higher and amounting to 25.8% in pre-crisis 2007.
Figure 4. Structure of IBS: (a) average for OECD countries;(b) average for top non-OECD countries.Source: Authors’ drawing based on OECD statistics and the World Bank database.
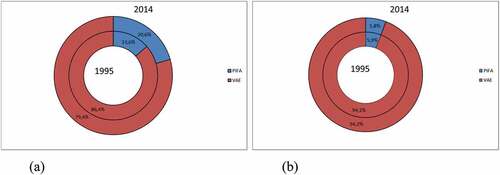
The most significant values at the end of the period were reached by Luxembourg (84,5%), the Netherlands (55,9%), Ireland (38,1%), Switzerland (37,6%), the United States (30,3%), Belgium (29,2%), Japan (27,9%), the United Kingdom (27,6%), Sweden (27,0%), France (26,7%), Denmark (25,3%), Finland (24,9%), Norway (24,6%) (for all OECD countries see, Figure Figure ).
Figure 5. Primary income from abroad (received) share in the IBS, in OECD countries.Source: Authors’ drawing based on OECD statistics and the World Bank database.
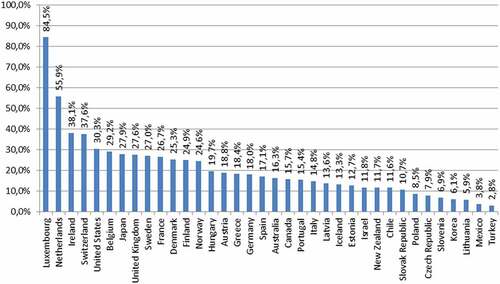
At the same time, several countries demonstrated the highest growth of the index, namely Iceland with 4,83 times growth, Finland (3,29), Estonia (3,23), Slovak Republic (3,05), Hungary (3,01). As a result, Hungary came ever closer to the leaders in terms of primary income from abroad (received) share in the IBS, with this index reaching 19.7%. In 2014, the decline in the index was recorded in Slovenia, the United Kingdom, Turkey, Denmark, Mexico, though in pre-crisis 2007 it was observed only in Mexico.
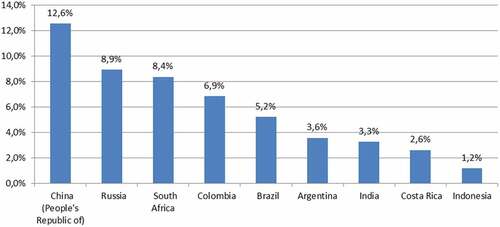
By contrast, the first index remained almost unchanged among top non-OECD countries (5.8% against 5.9% at the end of the period). In 2014, it was above average in the People’s Republic of China (12.6%), Russia (8.9%), South Africa (8.4%), Colombia (6.9%) (for all non-OECD countries see, Figure Figure ). Over the period under consideration it increased only in the People’s Republic of China (2.52 times), in South Africa (2.27 times); in Russia (1.75 times); in Colombia (1.16 times). As to the rest of the countries, it declined most dramatically in Argentina where it was only 0.22 of the original value towards the end of the period. By the way, Argentina was the only country where the above-named index decreased in pre-crisis 2007.
Figure 6. Primary income from abroad (received) share in the IBS, in top non-OECD countries.Source: Authors’ drawing based on OECD statistics and the World Bank database.
The upward trend in PIFAS has been quite clearly observed. However, even six years after the crisis its negative impact was felt in the world economy. In general, OECD countries were predictably more successful, although China in terms of the growth rate of this index could enter top 10 OECD countries. What is more, this growth was sustainably observed only in the 2nd decade of the analyzed period, namely since 2005, despite the overall decrease in IBS in China after the crisis. This demonstrates an important regularity of the IBS growth: it initially occurs due to exports as foreign exchange reserves are accumulated, then it leads to an increase in primary income from abroad. For example, this aspect had, although incomplete, but still some compensating effect on China.
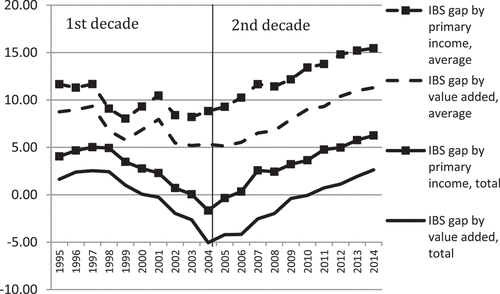
However, despite the success of individual top non-OECD countries the main conclusion that can be drawn based on a comparison of two groups of countries analyzed is the following. A trend of reducing the gap in the levels of development of IBS in OECD and top non-OECD countries dominating in 1995–2003 and interrupting only during crises changed in 2004–2005 (see, Figure On the contrary, in the period 2004–2014, for more than 10 years, there has been a steady increase in the gap in the levels of development of IBS in OECD and top non-OECD countries.
Figure 7. IBS gap between OECD and top non-OECD countries (%).Source: Authors’ drawing based on OECD statistics and the World Bank database.
where GIBSPIS- is IBS gap between OECD and top non-OECD countries
This trend is the main empirical finding of the article. There is all the more reason for this as the additional analysis carried out in Appendix 2 showed that the mentioned trend had been continuing in the period 2015–2018 both in terms of contribution of IBS to GDP index and in terms of contribution of IBS to PITR index
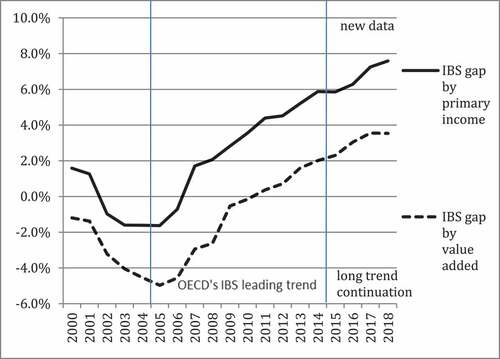
Thus, in the light of TiVA-2021 data the trend of an increase in the gap in the levels of development of IBS in OECD and top non-OECD countries identified in the analysis of previous databases turned out to be valid for a period of at least 15 years in 2004–2018. This makes it the most stable and noticeable among all the revealed trends in the development of IBS.
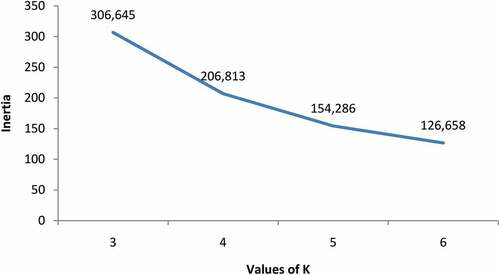
The use of averages offers significant advantages, but there are certain disadvantages. Therefore, for an in-depth assessment of the trends taking place in OECD countries, we’ll assess the changes in IBSPIS values corresponding to the maximum Kernel Density Estimation in the given organization. The table shows estimates when using various kernel functions (see, Table ). In all cases, an increase in the IBSPIS values corresponding to the maximum Kernel Density Estimation is seen from decade to decade.
Table 1. IBS values corresponding to the maximum density of functions
These changes allow us to conclude that the basic model of IBS in OECD countries is undergoing changes. However, it is not possible to answer the question of whether changes occur within the framework of one model or there is a change in models, and when exactly it occurs, without additional research. To answer this question, it is necessary to classify the models.
To prevent the classification from being arbitrary, we will accept partitioning into clusters as a basis. The K-means clustering method will be used. That allows us to set the number of clusters to be partitioned in order to check which number of them is optimal for creating an appropriate classification.
Since the changes in IBS in terms of primary income from abroad (received) share and value added export share do not always occur evenly, a combination of both indicators should be used to estimate the final state of its development.
The theoretical boundary for determining the scale of IBS dominance in the national economy is clear and equals to 50%.
In our opinion, given the importance of both primary income from abroad (received) share and the value added export share for evaluating the IBS value, this boundary should apply to both indicators, i.e. MAX {IBSPIS}>50. Thus, let’s assume that it is enough only for one of the indicators to exceed the given above parameter. It is apparent that only Luxembourg and Ireland met the condition (with MIN {IBSPIS} = 52.2 > 50). The Netherlands follows them with MAX {IBSPIS} = 49.1 < 50.
Using the K-means clustering allows us to check the validity of this boundary.
Therefore, the algorithm aims to minimize an objective function:
where under summation symbol there is a distance between data points (х) and the cluster midpoint (с).
Let’s use the data available for 2014. The division into two clusters shows that the mentioned Luxembourg and Ireland appear in one of them, the Netherlands together with all of the rest countries forming the second cluster. The boundary between clusters corresponds to an IBS value of 50%. Thus, in the case of two clusters theoretical and empirical boundaries coincide.
Since the majority of the countries form the second cluster, this requires more detail, with a larger number of clusters being used. Moreover, other degrees of the IBS development level are not so obvious. The Elbow optimum test for selecting 3–6 clusters showed that it is impossible to accurately determine the exact number of clusters by this method in our case. Figure Figure illustrates this fact based on the calculation of inertia indicator.
Figure 8. The elbow method using inertia for clustering of OECD countries.Source: Authors’ drawing based on authors’ computations in reliance on OECD statistics and the World Bank database.
As long as the dynamics of change in groups of countries over two decades is of the greatest interest for the purpose of our study, it would be most valuable to outline the boundaries of such groups that may not actually match clusters.
Let’s also use the data available for 2014 in order to outline these boundaries empirically. It is advisable that they should be equal or close to a value that is relatively easy to use. In our opinion, among the number of clusters from 3 to 6 checked during the research, the partitioning of OECD countries array into exactly 5 clusters using the K-means clustering meets this requirement quite well.
At the same time, for the first and second clusters, the cluster boundary of 50% remains unchanged, which fact indicates its stability.
For the second group MIN2 {IBSPIS} = 41,0 > 40, while for the third one MAX3{IBSPIS} = 38,8 < 40. Thereby, at least at this stage, it is advisable to use the boundary of 40%, which complies with empirically obtained limits.
For the third cluster MIN3 {IBSPIS} = 28,496, while MAX4 {IBSPIS} = 28,490. The boundary lying within these limits, such as 28.495, is quite difficult to use. Therefore, in this case, it is proposed to diverge from the empirical data and to set it at the level of 30%. At the same time, there is a slight discrepancy between the cluster and the obtained group adjusted for Chile and Finland. This is generally the only discrepancy between the clusters and proposed groups.
Finally, MIN4 {IBSPIS} = 20,2 > 20, while MAX5 {IBSPIS} = 19,1 < 20. In this respect, it is natural to set the last boundary at the level of 20%.
Thus, the advantage of dividing the countries into 5 clusters makes it possible to build a grouping with the natural 10-fold boundaries for 3 of 4 boundaries, while the remaining one shifts slightly, approximately by 1.5 points, with only 2 countries in the corresponding cluster not following it but falling within another group according to the proposed classification.
Thus, the Netherlands and Switzerland meet a requirement of 40< MAX{IBSPIS}<50 and that’s why enter the second group quite predictably. What’s interesting is that the Czech Republic, Estonia, Hungary, the Slovak Republic, Slovenia, which made great progress after their accession to the EU, are also included into the mentioned group. Their economies are of pre-international nature, with IBS forming although less than a half but yet a huge part of primary incomes into GDP.
The third group includes the old EU members meeting the requirement of 30< MAX{IBSPIS} <40: Germany (it is quite difficult for such a large country), Austria, Belgium, Denmark, Portugal, Latvia and Lithuania (which have relatively recently entered the EU), Poland (which is honorable for its size), Iceland and Norway (EFTA members) and Korea. In our opinion, their economies can be described as the dual ones being characterized by the critically important role of IBS and equally important contribution of domestic business.
Other European countries with large national economies, namely France, Italy, the United Kingdom and Spain meet a condition of 20< MAX {IBSPIS} <30 and form the fourth group. However, they did not show such considerable achievements in the development of IBS as Canada, Finland, Greece, Israel, New Zealand, Chile and Mexico. In our opinion, these countries are more dependent on domestic business success, despite the significant role of IBS in their development.
The fifth group includes national economies of the USA and Japan essentially differing in size as well as Australia and Turkey marked by a little more developed IBS. Regardless of the fact that all these countries are large recipients of primary income from abroad and demonstrate outstanding success in exports, their IBS continues playing an important but not a primary role in their economies, which is still fulfilled by domestic business. On the other hand, domestic business is more likely to be behind the scenes, against the backdrop of widely discussed success of international business in the USA and Japan. In other words, the “iceberg phenomenon” (when a large percentage of a real value is hidden from view) takes place in this group.
Division of individual countries into groups is shown in Table .
Table 2. Comparison between clustering and grouping of OECD countries in 2014
In our opinion, the fact that the selected groups coincide with empirically identified clusters provides a basis for discussing five models of national economy according to the role of IBS by transaction as of 2014. The first one is the Segmental IBS model where IBS may be rather highly developed (as in the USA) but it still plays a subordinate role in comparison with the domestic business sector. The reason is that IBS is limited to particular segments, with its level being compliant to values below 1:5. The second one is the Partial IBS model where the above-mentioned ratio rises to 1:3. The third one is the Dual IBS model where international business sectors coexist on an equal footing to domestic sectors, with the ratio being about 1:2. Finally, the internationalized IBS model assumes absolute predominance of IBS, while the pre-internationalized IBS model supposes approximation to the parity boundary with a slight predominance of domestic business sector.
The fact that the countries are of different sizes allows us to assert that aggregating all countries into one model is highly improbable. However, this fact does not prevent us from identifying the model that is the basic one at a definite stage. If we compare the observed situation with 1995, it is easy to see how the distribution of countries by groups has changed (if we assume their boundaries as of 2014). OECD countries as of 2014 made significant progress in developing the IBS role, their IBS models changing as well. While only one country weakened its position in IBS development, 20 countries out of 36 strengthened their hand, including all the 8 post-socialist countries that entered the EU (Poland did it even by two points). To assess the overall dynamics see, Figure .Figure .
Figure 9. Dynamics of groups of OECD countries on the base of adjusted results of clustering.Source: Authors’ drawing based on OECD statistics and the World Bank database.
Although OECD countries usually represent a set of models, we can determine the main one, for example, using mode as a statistical index. In 1995 and even in 2004 one can observe that the Partial IBS model was the basic for OECD countries (Figure Figure ). However, by 2014 the situation had changed and the Dual IBS model became the main one to a greater extent, although the Partial IBS model did not lose its significance.
Figure 10. Two-decade dynamics (internationalization wave) of OECD countries’ IBS models.Source: Authors’ drawing based on OECD statistics and the World Bank database.
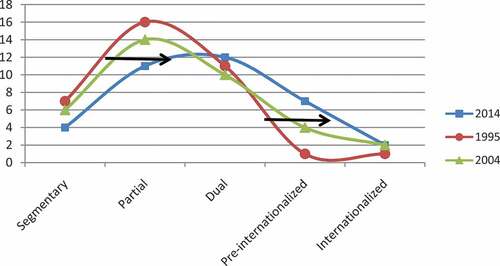
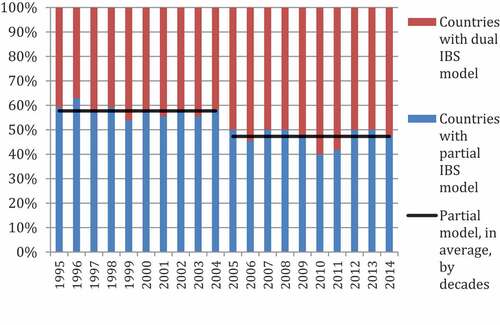
Let us analyze how the new basic model spread over the course of the second decade of 2005–2014. Figure Figure shows that over the first decade there was a constant quantitative excess of the countries with a Partial IBS model while over the second decade the dual IBS model got the advantage showing short-term returns to the state of parity.
Figure 11. Difference in the balance of number of countries with partial and dual IBS models, in the first and second decades of the analyzed period.Source: Authors’ drawing based on OECD statistics and the World Bank database.
It can be foreseen that in the future the Dual IBS model will become the basic one for even more OECD countries, while internationalized and pre-internationalized IBS models will spread even more widely. At the same time, top non-OECD countries, if evaluated according to the proposed criteria for identifying groups, retained the prevalence of the Segmental IBS model by the end of the second decade. This fact allows us to foresee widening the gap between them and OECD countries, the latter having changed their base model to a more progressive one.
In our opinion, it is the change in the basic model of IBS in OECD countries that accounts for the long-term trend of increasing gap in the development level of IBS in OECD and top non-OECD countries which was identified for the years 2004–2018.
Thus, more and more national economies are emerging in the world to become an integral part of the international economy.
Conclusion and Recommendations. In the presented article the definition of international business sector has been given. It is based on criterion of transactions as the result achieved by functioning of domestic business entities, both resident and non-resident, engaged in the international business. Regarding the latter, the methodology for calculating and evaluating the IBS contribution to primary income has been proposed. The analysis carried out showed the applicability of the developed methodology to assess the development of IBS as well as its contribution to the national economy and the relevance of the data obtained.
Unlike other authors, we defined and measured IBS not as a ratio to an abstract, albeit significant, indicator, but in relation to an aggregated indicator that reflects the performance results of only the analyzed IBS (by character? of transactions) and the complementary domestic business sector (by character? of transactions). Thus, the proposed indicator gives an idea of the relative development of these sectors and reflects the reality more accurately than the existing ones.
The proposed indicator demonstrated an upward trend, especially in OECD countries, where by the middle of the second decade of the analyzed period (1995–2014), IBS had generated one-third of all primary income. In top non-OECD countries, the upward trend was less pronounced and the corresponding value fluctuated around a fifth of primary income. Thus, while using the new indicator IBSPIS, more accurate data on the IBS value were obtained compared to other common indices, such as “value added export to GDP ratio”. As applied to IBS, assessing the share of GDP represents an underestimate. This allows for a more precise assessment of the role of IBS within the current environment, and, due to the analysis of OECD countries, to determine the guidelines for the development of this sector in other countries.
There has been observed IBS grow over the period 1995–2014 in OECD countries. Only two or three countries had experienced a decline in the IBSPIS index by 2014. Top non-OECD countries had seen, on average, a decline in IBS, and only a few countries had faced an increase in IBSPIS by 2014. The downturn was especially evident after the financial and economic crisis of 2008, when top non-OECD countries underwent the unfavorable period regarding the growth of IBS.
It can also be noted that recurrent economic crises have a devastating effect on the share of IBS. Its growth rates over the period under consideration have been gradually declining. Nevertheless, even during periods of positive dynamics the growth of IBS was neither progressive nor smooth, but depended on the market environment. In the first decade of the period (1995–2004) this growth was much more significant than in the second decade (2005–2014). The share of IBS in the entire period under review in OECD economies increased by 40%, approaching the pre-crisis maximum, and in top non-OECD countries it increased by 30%, i.e. half of their maximum, which indicated rather a high growth potential.
Overall, the share of IBS has been growing; however, the past decade has not deemed to be quite successful for the international business sector. The growth of IBSPIS as the core indicator has slowed down significantly. At the same time, it would be desirable to implement such a public policy to support the IBS that would strengthen its impact and accelerate its growth and relevance in the national economy. In this respect, the experience of India, whose growth in IBS has taken place despite all the changes in the global environment, by means of increasing the share of high value-added industries in exports, is noteworthy and should be replicated. This growth reached twice the volume, surpassing even the growth of IBS in Germany during the period under consideration, surpassing the growth of its similar indicator in the most controversial decade for top non-OECD countries, i.e. it occurred contrary to the general trends.
Despite the success of certain top non-OECD countries, such as India, the major conclusion and the main empirical finding of this article lies in the fact that in the period of 2004–2018, i.e. through 15 years, a stable increase in the gap in the levels of development of IBS in OECD and top non-OECD countries could be observed. This makes it the most consistent and visible among all the discovered trends in the development of IBS.
IBS growth not only had quantitative nature, but also has led to profound qualitative shifts in the past two decades. This is especially significant in view of the fact that these two decades were the first ones of the WTO’s existence. As a matter of fact, taking into account the rhetoric of the WTO formation, these changes did not always have the expected nature, because they primarily affected the developed OECD member countries, but not the less developed economies. However, it would be untenable to deny the role of the WTO formation in these processes.
To analyze these changes in terms of cluster analysis performed for 2014, OECD countries have been grouped according to the prevailing IBS models in 1995, 2004 and 2014. The results showed that OECD countries changed their basic IBS model moving from the Partial model to the Dual one, where IBS is not yet playing a primary role, but it is already becoming comparable to the role of the domestic sector.
In addition, other important changes concerning the structure of IBS occurred within OECD countries, the role of primary income from abroad having significantly increased from 13,6% to 20,6% on average for OECD countries. We have not observed similar changes in average values among top non-OECD countries, although some changes in separate countries, namely China, South Africa, Russia were quite significant during the two decades under review.
The fundamental findings of the research could be represented as follows:
1. The main theoretical finding is the algebraic model of IBS, which gives a clear assessment of the IBS contribution to the national economy and is expressed as a ratio of the amount of “value added export” and “primary income from abroad (received)” to primary income total resources.
2. The main empirical finding is the long-term trend of increasing gap in the level of development of IBS in OECD and top non-OECD countries.
3. The main explanatory finding is the change in the basic model of IBS in OECD countries.
5. Geographic information
Kharkiv, Ukraine
Latitude 49.988358
Longitude 36.232845
DMS Latitude 49° 59’ 18.0888” N
DMS Longitude 36° 13’ 58.2420” E
UTM Easting 301,651.51
UTM Northing 5,541,006.11
Disclosure statement
No potential conflict of interest was reported by the author(s).
Additional information
Funding
Notes on contributors
Sergii Arkhiiereiev
Sergii Arkhiiereiev is currently Professor of International Business and Economic Theory Department at the V. N. Karazin Kharkiv National University, Kharkiv, Ukraine. Prof. Arkhiiereiev has published in many international revues. He has presented papers in conferences in many countries; he is a reviewer and editor of international journals. Prof. Arkhiiereiev was awarded the DAAD grants for Research Stay in Germany for University Academics in 2012, 2015, 2017 and V. N. Karazin Medal (2021). He performed Lectures and Research Stay at the Miskolc University, Hungary, in 2010. His research interests cover international trade, transaction costs economics, international business. His main academic courses are international business, international business management, economics.
Anastasiia Mytrofanova
Anastasiia Mytrofanova, PhD, is currently an Associate Professor of General Economic Theory Department at the National Technical University “Kharkiv Polytechnic Institute”, Kharkiv, Ukraine. Her research interests focus on economic theory, public finance, international economics. Her main academic courses are economics, macroeconomics.
Notes
1. When the article had already been submitted to the journal, on 17.11 2021 a new version of TiVA-2021 appeared, containing data for the years 1995–2018. It was based 9on the indicators derived from the 2018 version of OECD’s Inter-Country Input-Output (ICIO) Database. Consequently, TiVA-2021 data are not strictly comparable with those obtained by the authors. Therefore we took a quick look at the data lying outside the scope of the selected time period in the Appendix 2.
References
- Alhayat, A. P. (2013). The impact of final demand of Indonesia’s exported products on domestic income and employment. Buletin Ilmiah Litbang Perdagangan, 7(2), 149–28 doi:https://doi.org/10.30908/bilp.v7i2.111.
- Arkhiiereiev, S., Maksymenko, I., & Diachenko, T. (2021). Factors of export incomes formation and ways to increase currency incomes of Ukraine. Financial and Credit Activity: Problems of Theory and Practice, 2(37), 406–413. https://doi.org/10.18371/fcaptp.v2i37.230325
- Arora, V. B., & Cardarelli, R. (2010). Rebalancing growth in Asia: Economic dimensions for China. IMF.
- Athukorala, P., Patunru, A. A., & Resosudarmo, B. P. (2014). Trade, Development . In and Political Economy in East Asia: Essays in Honour of Hal Hill. ISEAS–YusofIshak Institute 278 .
- Banga, R. (2013). Measuring value in global value chains. Unit of economic cooperation and integration amongst developing countries (ECIDC) (UNCTAD) , RVC-8, 1–34.
- Barbados international business companies: A Guide for business executives involved in International Business and Investment Activities: PricewaterhouseCoopers Report. https://www.pwc.com/bb/en/publications/assets/barbados-international-businesses-brochure.pdf
- Barbados: Selected issues: IMF Country Report No. 18/134 (2018). IMF.
- Bohn, T., Brakman, S., & Dietzenbacher, E. (2021). From exports to value added to income: Accounting for bilateral income transfers. Journal of International Economics, 131, 1–16. https://doi.org/10.1016/j.jinteco.2021.103496
- Bonsu, N. O. (2015). Towards an integrated conceptual framework of international business theory – a literature review perspective: any convergence? Archives of Business Research, 3(3), 99–114 doi:https://doi.org/10.14738/abr.33.1296.
- Breslin, S. (2012). East Asia and the global crisis (1st ed.). Routledge; Taylor & Francis. https://doi.org/10.4324/9780203718711
- Butkiewicz, J. L., & Gordon, L. C. (2013). The economic growth effect of offshore banking in host territories: Evidence from the Caribbean. World Development, 44, 165–179. https://doi.org/10.1016/j.worlddev.2012.09.017
- Castellani, D., Narula, R., Nguyen, Q. T. K., Surdu, I., & Walker, J. T. (2018). No longer at ease in the old dispensation: Reappraising the role of international business in the world economy. In D. Castellani, R. Narula, Q. Nguyen, I. Surdu, & J. Walker (Eds.), Contemporary Issues in International Business. The Academy of International Business; Palgrave Macmillan. https://doi.org/10.1007/978-3-319-70220-9_1
- Ceglowski J. (2019). Does the distinction between gross and value-added exports matter? An empirical investigation of export elasticities. Rev Int Econ, 27(1), 184–200. 10.1111/roie.12371
- Choi, M. S. (2021). Major exchange rates and value-added exports. PSL Quarterly Review, 74(298). https://doi.org/10.13133/2037-3643/17573
- Doing Business in Bermuda: Country Commercial Guide for U.S. Companies (2016). Foreign commercial service and U.S. Department of State. https://photos.state.gov/libraries/hamilton/662225/pdfs/Bermuda%20CCG%202016.pdf
- Durović, D. (2018). Tretman internacionalnog biznisa u Srbiji. Časopis za ekonomiju i tržišne komunikacije, VIII(I), 150–166. https://doi.org/10.7251/EMC1801150DJ
- Eichengreen, B., Gupta, P., & Kumar, R. (2010). Emerging Giants: China and India in the World Economy. Oxford University Press, Oxford. https://doi.org/10.1093/acprof:oso/9780199575077.001.0001
- Foster, N., Stehrer, R., Timmer, M., & Vries, G. (2012). Global production sharing: Trends and patterns (University of Groningen). http://www.wiod.org/conferences/groningen/slides/Foster_slides.pdf
- González-Miranda, M., Khosa, U., Liu, P., Schipke, A., & Thacker, N. (2013). Offshore financial centers: To be or not to be? inSchipke. In A. Cebotari & N. Thacker (Eds.), Eastern Caribbean Economic and Currency Union – Macroeconomics and Financial Systems (pp. 349–378). IMF.
- Hagemejer, J., & Mućk, J. (2019). Export-led growth and its determinants: Evidence from Central and Eastern European countries. World Econ, 42(7), 1994–2025. doi.10.1111/twec.12790
- Jackson, G., & Deeg, R. (2008). Comparing capitalisms: Understanding institutional diversity and its implications for international business. Journal of International Business Studies, 39(4), 540–561. https://doi.org/10.1057/palgrave.jibs.8400375
- Jangam B Praveen and Rath B Narayan. (2021). Does global value chain participation enhance domestic value‐added in exports? Evidence from emerging market economies. Int J Fin Econ, 26(2), 1681–1694. 10.1002/ijfe.1871
- Johnson, R. 2014. Five Facts about Value-Added Exports and Implications for Macroeconomics and trade research. Journal of Economic Perspectives. Volume 28, Number 2 — Spring 2014 2, 119–142. 10.1257/jep.28.2.119
- Johnson, R. C., & Noguera, G. (2017). A portrait of trade in value-added over four decades. The Review of Economics and Statistics, 99(5), 896–911 doi:10.1162/REST_a_00665.
- Kim, S., Lee, J.-W., & McKibbin, W. J. (2017). Asia’s Rebalancing and Growth. Centre for Applied Macroeconomic Analysis (CAMA) Working Paper, 66, 1–56 https://cama.crawford.anu.edu.au/sites/default/files/publication/cama_crawford_anu_edu_au/2017-11/66_2017_kim_lee_mckibbin.pdf.
- Koch, P. (2021). Economic complexity and growth: Can value-added exports better explain the link?, Economics Letters, 198(2021), 109682. 0165-1765. https://www.sciencedirect.com/science/article/pii/S0165176520304420.
- Nyuur, R., Wanjiru, R., Amankwah-Amoah, J., & Ifere, S. (2018). Critical perspectives on international business in Africa: An overview and proposed new research agenda. Critical Perspectives on International Business, 14(2/3), 102–110. https://doi.org/10.1108/cpoib-05-2018-073
- OECD Statistical information. https://stats.oecd.org/
- Pearce, R. (2017). The development of international business: A narrative of theory and practice. Edward Elgar Publishing Ltd.
- Pieters, J., Timmer, M., & Vries, G. (2012). Trade and earnings inequality in middle-income countries (University of Groningen). http://www.wiod.org/conferences/groningen/slides/Pieters_slides.pdf
- Reich, U.-P. (2018). Accounting for international trade in value added: A comment on the OECD–WTO project. Economic Systems Research, 30(4), 462–477. https://doi.org/10.1080/09535314.2018.1434486
- Republic of Korea: Selected issues: IMF country report no. 10/271 (2010). IMF.
- Shaikh, A. (2007). Globalization and the Myths of Free Trade: History, theory, and empirical evidence (1st ed.). Routledge. https://doi.org/10.4324/9780203966389
- Warner-Søderholm, G., Bertsch, A., Saeed, M., & Abdullah, A. B. M. (2014). Doing business in Norway: An international perspective. Asian Journal of Research in Business Economics and Management, 4(11), 32–45. https://doi.org/10.5958/2249-7307.2014.00971.2
- Wessa, P. (2015), Kernel Density Estimation (v1.0.12) in Free Statistics Software (v1.2.1), Office for Research Development and Education, URL http://www.wessa.net/rwasp_density.wasp/
- World Bank Open Data. https://data.worldbank.org/
- Worrell, D. (2017) Meeting the challenges facing the international business and financial services centre. Proceedings from: International Business Week Conference. Lloyd Erskine Sandiford Centre, Barbados (Lloyd Erskine Sandiford Centre).
Appendix 1
Example of political implications of International Business Sector (IBS) concept
Among the important indicators of development, ratios regarding exports or the amount of exports of goods, services and primary income are often used.
Among the indices implemented by the World Bank one can distinguish the following:
Total debt service (% Of Exports Of Goods, Services And Primary Income)
Interest Payments On External Debt (% Of Exports Of Goods, Services And Primary Income)
External Debt Stocks (% Of Exports Of Goods, Services And Primary Income)
Public And Publicly Guaranteed Debt Service (% Of Exports Of Goods, Services And Primary Income)
Present Value Of External Debt (% Of Exports Of Goods, Services And Primary Income)
Short-Term Debt (% Of Exports Of Goods, Services And Primary Income)
Debt service (PPG and IMF only, % of exports of goods, services and primary income)
Let’s consider the example of the first index, which is a featured indicator for non-OECD countries (see, Table A1). The size and value of International Business Sector reflects primary income from IBS activities of a country more accurately by summing up the amount of value added export and primary income from abroad (received). Now the question is how the use of the IBS concept can change assessment of debt service.
First, the data presented in the table confirm that traditional indicator (Total debt service, % of exports of goods, services and primary income) underestimate the ratio of total debt service in comparison with actual foreign exchange earnings (calculated as amount of value added export and primary income from abroad (received)).
Furthermore, this understatement varies in different countries. Real indicators based on accounting the IBS value in the national economy for countries under consideration exceed indices calculated using the traditional method by 1.6 up to 65.6%. Accordingly, this fact may affect important decisions of policy makers on further granting credits to certain countries.
Naturally, the same thing is observed with regard to the rest of the above-mentioned indicators and associated political decisions. All the aforesaid considerations confirm the advantage of using the IBS value for calculating similar ratios in comparison with traditional indicators.
Table A1. Comparison of traditional and IBS-based total debt service estimations
Appendix 2
Third decade is beginning: the gap is growing
As was already mentioned, when the article had already been submitted to the journal on 17.11 2021 a new version of TiVA-2021 appeared. It contained data for the years 1995–2018 and was based on the indicators derived from the 2018 version of OECD’s Inter-Country Input-Output (ICIO) Database. Consequently, TiVA-2021 data are not strictly comparable with those obtained by the authors. Therefore, this appendix contains a quick look at the data lying outside the scope of the selected time period, namely it covers the period of 2015–2018.
First of all, we’ll pay attention to the main finding of the research, namely deepening the gap between levels of development of IBS in OECD and top non-OECD countries in the years 2004–2014. A brief analysis shows that this trend had been continuing also in the years 2015–2018, either according to contribution of IBS to GDP index or according to contribution of IBS to PITR index. Figure shows these trends..
Figure A1. Continuation of OECD’s IBS leading trend in 2015-2018. IBS gap between OECD an top non-OECD countries (%). Source: Authors’ drawing based on OECD statistics and the World Bank database.
Thus, in the light of TiVA-2021 data, the growth of the gap between the levels of development of IBS in OECD and top non-OECD countries recorded in the analysis of previous TiVA databases for a period of more than 10 years turns out to be validл for a period of at least 15 years. This makes it the most stable and noticeable among all the identified trends in the development of IBS.