
 ?Mathematical formulae have been encoded as MathML and are displayed in this HTML version using MathJax in order to improve their display. Uncheck the box to turn MathJax off. This feature requires Javascript. Click on a formula to zoom.
Abstract
Based on the Structural Vector Auto regression (SVAR) model, we study the impact of oil shocks on the volatility of the BRICS and G7 markets. We decompose oil shocks into three types: oil supply shocks, aggregate demand shocks and oil-specific demand shocks. The results indicate that there is a significant impact of oil shocks on both markets but this impact differs according to the nature of the shock and according to the studied market. We find that the reaction of all the considered market volatilities is more intensive for a demand shock especially for a specific demand shock than for a supply shock. BRICS and G7 markets volatilities react very similarly on impact to oil-specific demand shocks, while their responses present some differences to aggregate demand shocks and oil supply shocks. Our results reflect the changes experienced by the BRICS and G7 economies in recent years.
PUBLIC INTEREST STATEMENT
In this paper, we have examined the response of daily stock market volatility for BRICS and G7 member countries to daily oil shocks over the entire study period from February 11, 2000 to February 12, 2021. A GJR-GARCH model is used to detect market volatility, a Structural VAR model is applied to separate global oil shocks into oil supply shocks, aggregate demand shocks, and oil specific demand shocks and to study their impacts on market volatility, and we have examined the variance decomposition in order to analyze the contribution of each shock to the variability of volatility. We found a significant asymmetric response of market volatility to structural oil price shocks for all markets. We have showed a convergence between BRICS and G7 markets behavior to oil shocks; is that the reaction of most stock market volatilities is more intensive for a specific demand shock than for an aggregate demand shock and a supply shock impact that should not be overlooked.
1. Introduction
Recently, the oil market has experienced different events, which makes oil prices one of the most volatile variables. That is why the study of oil prices evolution and their impact on the whole economy has been a matter of great concern to economists and researchers. Oil prices affect different asset markets such as commodity markets (Balcilar et al., Citation2021; Naeem et al., Citation2020; Umar et al., Citation2021a), exchange rates (Ji et al., Citation2019; Malik & Umar, Citation2019), metal markets and agricultural raw material markets (Jiang et al., Citation2018; Umar et al., Citation2021b), and stock markets (Alqahtani et al., Citation2020; Aloui et al., Citation2012; Antonakakis et al., Citation2017; Bastianin et al., Citation2016; Bastianin & Manera, Citation2017; Ferrer et al., Citation2018; Kilian, Citation2009; Kilian & Park, Citation2009; Salisu & Gupta, Citation2021; Tchatoka et al., Citation2018; Wang et al., Citation2013a; Wen et al., Citation2019; Zhu et al., Citation2020).
The risk of the stock markets is associated with increased risk of oil prices. Theoretically, if oil prices increase costs will increase such as rising transportation, production, and heating costs; resulting in the delay of investment decisions (Bernanke, Citation1983; Pindyck, Citation1990), hence generating uncertainty for firms. Another explanation can be offered is that high oil prices lead to strong economic growth; by increasing oil demand; hence lower uncertainty about future cash flows. Empirically, the study of oil prices-stock market dependence leads to different results and different explanations giving this subject more interest and novelty. Some studies showed a significant and positive dependence. However, other found a significant and negative relationship between oil prices and market volatility or an insignificant relationship. Different explanations have been provided depending on the research methodology followed that is detecting the source of oil shock and distinguishing between oil supply shock and oil demand shock (Kilian, Citation2009; Kilian & Park, Citation2009; Bastianin et al., Citation2016; Antonakakis et al., Citation2017) or by distinguishing between oil importers and exporters countries (Tchatoka et al., Citation2018; Wang et al., Citation2013a) or by considering different market circumstances (Aloui et al., Citation2012; Ferrer et al., Citation2018; Salisu & Gupta, Citation2021; Wen et al., Citation2019), or by comparing the impact of oil prices on the stock market to other impact (Alqahtani et al., Citation2020; Zhu et al., Citation2020). It should be noted that all the results confirm the need to detect the source of oil price variation in order to understand and analyze variations in the stock markets, and while some of these studies chose to examine the impact of oil prices on developed markets (Wang et al., Citation2013a; Bastianin et al., Citation2016; Bastianin & Manera, Citation2017; Ferrer et al., Citation2018; Wen et al., Citation2019), others chose emerging markets (Aloui et al., Citation2012; Tchatoka et al., Citation2018; Salisu & Gupta, Citation2021). But to our knowledge there is no study collecting and exposing the behavior of the two types of markets as the case of our study which examines the reactions of the BRICS and G7 markets both following the oil shocks. Motivated by the challenge of the BRICS economies and their convergence with those of the G7 (Golam & Monowar, Citation2015; Gyedu et al., Citation2021; Mensi et al., Citation2014; Naik et al., Citation2018; O’Neill & Stupnytska, Citation2009; Plakandaras et al., Citation2019; Ruzima & Boachie, Citation2018) we have chosen to study the behavior of the BRICS and G7 markets following the oil shocks.
This paper attempts to show the extent to which oil price shocks explain the volatility of BRICS and G7 market returns by decomposing oil price shocks into three shocks: supply shock, aggregate demand shock, and specific demand shock through the SVAR analysis, impulse response functions and variance decomposition.
Our objective is motivated by: First, the difference noticed in the results of previous studies making the relationship between oil shocks and stock markets a living relationship. Second, the volatility problem is persistent over time and in several markets around the world. Third, the BRICS and G7 markets have not collected in such a study despite the fact that it has recently been noticed that these two economies are converging over time. The BRICS economy has grown rapidly over the past two decades; which increases its importance in the global economy. Such as, the contribution of BRICS group to global economic growth increased from 16% during the 1990s to around 30% during the period that spans from 2000 to 2008, while in the same period, the corresponding contribution of the G7 declined from over 70% to around 40% (O’Neill & Stupnytska, Citation2009). Over the past decade, BRICS have contributed to about 50% to the global economic growth, which makes them an important engine in the world economy. Furthermore, the BRICS economies have experienced strong performance linked to the high level of foreign direct investment in the private sector, which increases their trade with the rest of the world (Mensi et al., Citation2014; Ruzima & Boachie, Citation2018).The same, since the oil market is globally integrated, domestic policies by each G7 country are very likely to have spillover effects on other economies. More recently, Gyedu et al. (Citation2021), in order to study the impact of innovation on economic growth among G7 and BRICS countries, found that the innovation contribution of BRICS and G7 countries effectively improves economic growth. But the G7 countries are much stronger than the BRICS countries because most of the innovations of the G7 countries are more invested than the BRICS. Finally, we choose to apply the methodology detecting the source of oil shocks by breaking them down into supply shocks, global demand shocks, and specific demand shocks through the SVAR model according to Kilian (Citation2009) because on the one hand it is the methodology that shows similar results compared to the results of the other methodologies and on the other hand, it is obvious that to analyze a problem like the stock market volatility it is necessary to seek the source of the problem.
Some studies such as Golam and Monowar (Citation2015) found that the BRICS have the potential to challenge the G7 in the coming decades and is expected to surpass that of the G7 countries by 2050 (Naik et al., Citation2018; Plakandaras et al., Citation2019). By collecting the BRICS and G7 markets in a study of volatility and the role of oil shocks in explaining this volatility, our paper is the first that offers the opportunity to examine whether this challenge manifests itself on the behavior of the BRICS markets in comparison with the behavior of the G7 markets and if so how? Therefore, modeling and forecasting the volatility of the BRICS and G7 markets in particular, due to the oil shocks, are of great importance for the analysis, and the comparison of the behavior of these markets, for the stability of the global financial system, for expected future of these economies and for the world economy. In addition, volatility problem remains a central theme in the financial literature; hence it is worth noting that the study of oil shocks-market returns volatility has crucial implications for earnings and cash flows; hence for investment decisions, risk management, financial and monetary policymaking, and investor sentiment.
The rest of the paper is organized as follows. Section 2 describes the literature review. Section 3 explains the methodology. Section 4 presents data and descriptive statistics. Section 5 discusses the results and robustness check. Section 6 concludes.
2. Literature review
Today, the dependence between the oil market and the stock market is obvious. This dependence has been detected in both developed and emerging economies. Different methodologies are used, different results are found and different explanations are given.
In light of the different results related to the relationship between oil prices and stock markets, Kilian (Citation2009) and Kilian and Park (Citation2009) brought an explanation. Through the structural VAR model, they showed that the response of stock markets to oil prices can be either positive or negative depending on the nature of the shock. Since the seminal work of Kilian and Park (Citation2009), researchers have studied the relationship between oil price and stock market by differentiating structural oil price shocks. Such as, Bastianin et al. (Citation2016) studied the effects of crude oil price shocks on the stock market volatility of the G7 countries. They found that, in all countries, shocks to the supply of crude oil do not affect volatility. However, demand side shocks, especially aggregate demand shocks, do influence volatility and, in the long run, they explain at least 10% of its total variability. Antonakakis et al. (Citation2017) found that aggregate demand shocks appear to be the main transmitters of shocks to stock markets during periods characterized by economic events; while oil-specific supply and demand shocks act as the main ones transmitters of shocks during times of geopolitical turmoil. In the same way, Bastianin and Manera (Citation2017) studied the impact of oil price shocks on the U.S. stock market volatility. They analyzed three different structural oil market shocks (i.e., aggregate demand, oil supply, and oil-specific demand shocks) on stock market volatility using a structural vector autoregressive model. They showed that volatility responds significantly to oil price shocks caused by unexpected changes in aggregate and oil-specific demand, whereas the impact of supply-side shocks is negligible.
Other researchers have examined the relationship between oil and stock markets by distinguishing oil-importing countries from oil-exporting countries. Such as, Wang et al. (Citation2013a), using a structural VAR analysis, explained that the impact of oil shocks on stock prices depends on the net position of a country, on the cause of oil price change, and on the importance of oil to the economy. Wang et al. (Citation2013a) found that the effects of oil price uncertainty are stronger for oil exporting countries. Whereas, through the quantile-on-quantile (QQ) regression model for the US stock market, Tchatoka et al. (Citation2018) found that the nature of the country importing or exporting oil cannot explain the dependence between oil price and stock market returns. Indeed, India and China; importing countries, Russia; exporting country, and even the Philippines, Thailand, and Malaysia; countries moderately dependent on oil, their financial markets react in the same way.
By considering different market circumstances, some studies reconsider the relationship between oil price and stock market such as Aloui et al. (Citation2012), using an analysis of long-term correlation and a conditional multifactor pricing model, they studied the emerging markets and found a positive and significant relationship between the oil-related beta and stock returns during bull of market, as the scenario reverses during the market downturn. The results of Antonakakis et al. (Citation2017) and Ferrer et al. (Citation2018) confirmed the importance of market circumstances as a factor explaining the relationship between oil shocks and stock market. Ferrer et al. (Citation2018) found that the high crude oil-US stock market dependence is detected during periods of financial turmoil. In the same way, studying the emerging market by copula functions, Wen et al. (Citation2019) showed that oil return volatility, country-specific variables (i.e., stock market volatility, petroleum production growth), and US economic policy uncertainty have positive effects on the oil–stock dependence. Recently Salisu and Gupta (Citation2021) investigated the response of stock market volatility of the BRICS group to oil shocks (oil supply shocks, economic activity shocks, oil consumption shocks, and oil inventory shocks) by employing GARCH-MIDAS model. They showed heterogeneous responses of stock market volatility of the BRICS countries to the alternative oil shocks, including positive and negative ones. They attributed the results to the differences in the economic size, oil production, and consumption profile of the countries, market share distribution across firms, financial system and regulation efficiency. Moreover, they found that the BRICS stock markets have a common characteristic; which is the fact that shocks to stock volatility in these markets tend to disappear over time, indicating their emerging nature.
To understand to what extent the financial markets are dependent on the oil market; hence confirm this strong dependence, other studies have followed a different approach; it is the fact of comparing the impact of oil prices in relation to the impact of other factors influencing the financial markets. For example, Zhu et al. (Citation2020), using structural VAR model, comparatively examined the role of oil shocks and investor sentiment in the explanation of certain market anomalies from various firm characteristics in the oil and gas industry. They found that the number of anomalies explained by oil shocks is higher than that explained by investor sentiment. Investor sentiment has significantly positive impact on four anomalies: composite equity issues, investment to assets, net stock issues, and value effect. However, aggregate demand shocks have significantly impact on 6 anomalies: composite equity issues, financial distress, net stock issues, O-SCORE, return on assets, and idiosyncratic volatility. In the same year, Alqahtani et al. (Citation2020) also comparatively examined the role of crude oil prices and geopolitical risk indices in Stock return predictability for GCC markets by employing the feasible generalized least square (FGLS) estimator and they show that crude oil prices are the best predictor in most cases.
Certainly and undoubtedly, all these studies provide a solid foundation to understand the correlation between oil market and the stock market. However, by observing all these results, it can be noticed that research using the methodology that distinguishes supply shocks from demand shocks has found similar results showing the importance of understanding the source of oil shocks to correctly understand the behavior of stock markets and predict their future. On the other hand, the results of other research methodologies such as distinguishing exporting countries from importing countries or studying market conditions to understand the relationship between oil and stock markets, show differences and even contradictions.
For the purpose of studying and explaining volatility in the stock market, which represents a central objective in finance, working with a global variable of the oil market is not relevant; this is what is confirmed by the different and even contradictory results of some research. Therefore, there is a strong need to detect the source of oil shocks to detect the source of market volatility (Kilian, Citation2009; Kilian & Park, Citation2009). Furthermore, we have noticed that these studies have examined the oil market-stock market dependence on either emerging or developed markets and to the best of our knowledge there is no study linking developed and emerging markets to the same time; that is the most important contribution of this work.
3. Methodology
To examine the effect of different oil shocks on the volatility of BRICS and G7 stock markets, we implement a three-stage approach. The first stage applies GJR-GARCH model to detect market volatility. In the second stage, we apply a structural VAR model in order to separate and identify the impact of different structural shocks on BRICS and G7 markets volatility. Finally, we use the variance decomposition from the structural VAR in order to analyze the contribution of each shock to the variability of BRICS and G7 stock market’s volatility.
3.1. GJR-GARCH model
The GJR-GARCH model developed by Glosten et al. (Citation1993) is constructed to capture the asymmetric leverage volatility effect. The conditional variance from the GJR-GARCH (1, 1) model is presented as follows..
,
and
are restricted to be positive. The indicator function
equals 1 if εt−j <0, and 0 otherwise. Thus, the leverage coefficients are applied to negative innovations, giving negative changes more weight. The leverage effect is captured by the coefficient
.We suppose that the errors
follow a standard Student’s t distribution.
3.2. Structural VAR Model (SVAR)
The SVAR developed by Kilian and Park (Citation2009) allows to identify the structural shocks from a specific variable and to analyse its impact on others. The use of structural-VAR (SVAR) model allows us to identify and disintegrate oil price shocks into oil supply shocks, aggregate demand shocks and oil specific demand shocks. We then include the volatility of daily returns of BRICS and G7 markets to capture their sensitivity to these constructed oil shocks. The standard structural VAR representation can be given by..
Where;
represents [Nx1] vector of endogenous variables including the two following blocks..
Global Oil Market Block that includes the global crude oil production that is a proxy for world oil-supply shocks, global real economic activity that is a proxy for global aggregate-demand shocks, and real crude oil prices that is a proxy for oil-specific demand shocks.
BRICS and G7 markets Returns Volatility Block.
is the expression for [N ×N] autoregressive coefficient matrix;
is the [N ×N] contemporaneous matrix;
represents [N ×1] vector with structural innovations assuming no serial correlation with zero covariance;
The expression of covariance matrix with structural disturbances is represented below.
We have to multiply at first with on both sides of the latter equation in the purpose to reduce the form of the structural VAR model (EquationEq.2
(2)
(2) ), to obtain the following expression:
In the above equation,,
=
,
, and
=
.
represents the reduced form of linear combinations of structural errors
with covariance matrix in the formE[
] =
.
EquationEquation (4)(4)
(4) has the aspect of the moving average representation given by
=
Where;
with
According to Kilian and Park (Citation2009), the following short-term restrictions were imposed on to determine the structural disturbances in the model and to further detect oil price shocks within the framework of Kilian and Park (Citation2009) to achieve model identification.
The hypothesis that characterizes the error structural behaviour comes from Kilian (Citation2009) including the following:
For Global Oil Market Block: The three exclusion restrictions in the first block of (EquationEq 5)(5)
(5) are consistent with the short-term global supply curve of crude oil and the downwardly sloping demand curve. A change in the demand curve driven by one of the two oil demand shocks can cause instantaneous changes in the actual price of oil, and unexpected oil supply shocks can also cause changes in the vertical supply curve. According to Kilian (Citation2009), the following may motivate these deterministic restrictions:
First, crude oil supply will not be able to cope with the impact of oil demand within a month due to the adjustment of the cost of oil production and the uncertainty of the crude oil market conditions.
Second, the increase in the actual price of oil driven by specific demand shocks in the oil market will not reduce the real global economic activity due to the weakening of the global actual activities. The last raw in the first block capture that variability in the real price of oil instantly reflect supply shocks and both aggregate and oil-specific demand shocks.
For BRICS and G7 markets Returns Volatility Block: The second block consists of only one equation. The block-recursive structure of the model implies that global crude oil production, global real activity, and the real price of oil are treated as predetermined with respect to BRICS and G7 markets returns volatility. Whereas BRICS and G7 markets returns volatility are allowed to respond to all three oil demand and oil supply shocks on impact, the maintained assumption is that ε4 t does not affect global crude oil production, global real activity, and the real price of oil within a given month, but only with a delay of at least one month. Our identification scheme is based on the assumption that innovation compared with the domestic stock market, the variables describing the global oil market are predetermined, which means that fluctuations in stock prices will not have an immediate impact on the actual price of oil. This assumption has been used and supported by multiple authors see for example, Kilian and Vega (Citation2011), Degiannakis et al. (Citation2014), Bastianin et al. (Citation2016), and Bastianin and Manera (Citation2017).
The presence of zero in Equationequation 5(5)
(5) is explained by the following:
Crude oil production is only driven by exogenous shocks of oil supply that responded to volatility in production due to external events (such as conflicts in the Middle East).
Global real economic activity responds immediately to aggregate demand shock, which reflects variations in the demand of all commodities including oil.
The zeros’ restriction in the third row indicates that real crude oil price reflects immediately oil supply shocks and both aggregate demand shock and oil specific demand shocks.
Finally, BRICS and G7 markets Returns Volatility responds immediately to all structural shocks and to other innovations.
4. Data and descriptive statistics
4.1. Data
The data encompasses daily prices of G7 Market indices (France, Italy, UK, Germany, USA, Canada, and Japan) and BRICS Market indices (Brazil, Russia, India, China, South Africa) which are collected from DATASTREAM. Our data covers the period that spans from 11 February 2000 to February 12, 2021. The three oil shocks are dailyFootnote1 series which are: the Oil supply shocks (OSS), the Economic Activity Shocks (EAS) and the Oil Consumption Demand Shocks (OCDS). The oil supply shock is measured by the global crude oil production (in millions of barrels per day) taken from the website of the US EIA (http://www.eia.gov/totalenergy/data/monthly/index.cfm). The Economic Activity Shocks (EAS) is detected by the actual Kilian’s index that it is sourced from Lutz Kilian’s website (http://www.personal.umich.edu/~lkilian/paperlinks. html). The oil prices represent a proxy for Oil Consumption Demand Shocks (OCDS) and it sourced from the US Energy website (http://www.eia.gov/petroleum/data.cfm#prices).
4.2. Descriptive statistics
Table contains the descriptive statistics of the returns series and oil shocks proxies. The results show that the mean returns are positive for all considered markets except for Italy (−0.000132), which indicates that in all considered stock markets, the investment activity is beneficial and attractive but it is not the case of Italy. The highest level of risk is observed for the three oil shocks, which is naturally expected. Whereas the lowest one is found for the UK. The Jarque-Bera test rejects the hypothesis of normality for all returns. The value of skewness and kurtosis confirms the non normality of series (non zero skewness and high kurtosis). The unit root and PP tests indicate that all return series are stationary. Nevertheless, oil supply shock is not stationary according to ADF and PP tests but oil aggregate demand shock and oil-specific demand shock series are not stationary according to PP. Hence, we use for the three shocks series the first difference to get stationary series according to ADF and PP tests.
Table 1. Descriptive statistics and preliminary tests of the data and oil market structural shocks
5. Results discussion
5.1. The conditional volatility model
Table presents GJR-GARCH model estimates of the G7 and BRICS returns. First, for all the time series, the coefficients of lagged conditional variance, , are positive and statistically significant at the 1% level, indicating the presence of volatility clustering. Second, there is a significant leverage effect, captured by coefficient
in all G7 and BRICS markets except Russia
, meaning bad news has large effect on the volatility of series than good news. But, in Russia this scenario is reversed. Third, for France, Germany, and USA
coefficient is negative and statistically significant at 1%, 5%, and 10% level respectively, indicating that good news have a negative effect on the volatility, unlike the all BRICS, Canada, and Japan markets where the good news have a positive effect on the volatility. However, in Italy, and UK markets, positive shocks do not affect conditional volatility, captured by a not statistically significant
coefficient. Last,
is satisfied for all series that indicates that the process GJR-GARCH (1, 1) is defined as stationary.
Table 2. GJR-GARCH model estimates
5.2. Impulsions responses functions
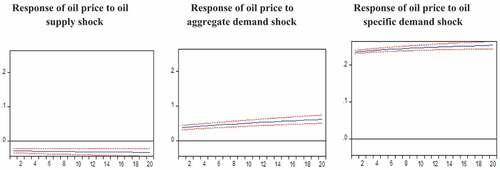
figure shows the response of global oil price to structural oil shocks. The shocks presented are expected to generate an increase in the price of crude oil. Thus, we consider a negative oil supply shock, which represents an unpredictable decrease of oil production, and positive shocks to aggregate and oil-specific demand.
Figure 1. The impulse response of global oil price to structural oil shocks (11 February 2000 to 12 February 2021).Note: Figure shows the impulse response of global oil price to structural oil shocks for 20 periods.
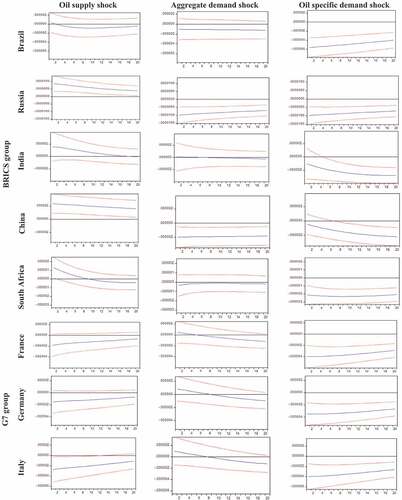
shows the responses of returns volatility to different oil price shocks in each of the BRICS and G7 countries. The first column shows that following a negative oil supply shock a rapid decrease in the first days then a cancellation of the impact is detected in all BRICS markets and in USA, Canada, and Japan markets but France, Germany, Italy, and UK returns volatilities increases in the first days then a cancellation of the impact is detected also. The second column shows that following unexpected increase in oil aggregate demand, an increase in the returns volatility of Russia market, but a decrease of Brazil and China, and a no impact of India and South Africa markets are detected. However, we note a decrease of volatilities of all G7 markets returns. The third column presents a decrease of volatility for India, China, and South Africa but an increase of volatility of Brazil and Russia. For G7 countries, an increase of France, Germany, Italy, UK, and USA markets volatilities to a positive specific demand shocks, but a volatility decrease of Japan market and a no impact on Canada market.
Figure 2. Responses of returns volatility to structural shocks (11 February 2000 to 12 February 2021).Notes: shows the estimated response of the daily conditional volatility of BRICS and G7 markets returns to daily structural shocks between 11 February 2000 and 12 February 2021. They are based on a recursive-design wild bootstrap with 2000 replications (Gonc¸ & Kilian, Citation2004).
Our results show that the impact of oil price shocks on volatility differs with the difference in the source of this shock, so it is necessary to decompose oil price shocks into supply shocks and demand shocks which is confirmed in Kilian (Citation2009), Kilian and Park (Citation2009) who showed that the response of stock markets to oil prices can be either positive or negative depending on the nature of the shock. We note that the impact of oil supply shocks on market returns volatility is weak in BRICS and G7 markets as found as Kilian (Citation2009), Bastianin et al. (Citation2016), and Bastianin and Manera (Citation2017). However, different results of a positive aggregate demand shocks are detected. We explain these results as follow: an unexpected increase in oil aggregate demand leads to increase oil prices; hence increase costs such as rising transportation, production, and heating costs; resulting in the delay of investment decisions (Bernanke, Citation1983; Pindyck, Citation1990); hence generate uncertainty for firms that is the case of Russia market. Another explanation can be offered; is that high oil prices leads to strong economic growth; by increasing in oil demand; hence lower uncertainty about future cash flows that is the case of Brazil, China and all G7 markets. Also, different results are observed following an unexpected increase in oil specific demand. Knowing that, specific demand shock is designed to capture shifts in the price of oil driven by higher precautionary demand associated with market concerns about the availability of future oil supplies (Kilian, Citation2009); hence the market uncertainty and the fear of investors occur that is the case of Brazil, Russia, France, Germany, Italy, UK and USA markets while for other BRICS and G7 markets, investors are not sure or don’t know in the early days if it is caused by aggregate demand shock or by demand specific shock.
Moreover, our results show that BRICS markets including importing countries (such as India and China) and exporting countries (such as Russia) behave differently following oil shocks that is confirms the results of Wang et al. (Citation2013a) and Salisu and Gupta (Citation2021) but against Tchatoka et al. (Citation2018) who found that oil importing countries and oil exporting countries behave identical and that the nature of the country importing or exporting oil cannot explain the dependence between oil price and stock market. The same for G7 markets, they react differently to oil shocks; this is against Bastianin et al. (Citation2016). Between BRICS and G7 markets, we detect a convergence in their behavior following each oil shock. We need the study of variance decomposition of returns volatilities to clarify this convergence.
5.3. Variance decomposition
Table shows the percentage contributions of each oil market shock to the overall variability of stock market volatility, based on the forecast error variance decomposition of the structural VAR models presented earlier.
Table 3. Variance decomposition- returns volatility
The results show that the returns volatilities of all BRICS and G7 markets are explained mainly by the oil specific demand shocks except China. Such as a 0.2% to 0.5% the contribution of oil specific demand shock in variance decomposition of returns volatility in BRICS and G7 markets. However, for oil supply shock and oil aggregate demand shock different results are observed. For BRICS markets, returns volatilities of Brazil and Russia are weakly explained by oil supply shocks relative to aggregate oil demand shocks, while this scenario reverses for returns volatilities of India, China, and South Africa. For G7 markets, France, Italy, and Germany returns volatilities are more explained by oil supply shocks relative to aggregate oil demand shocks, while this scenario reverses for UK, USA, Canada, and Japan markets.
Overall, the volatility of most BRICS and G7 countries is mainly influenced by innovations to the demand side, especially to oil specific demand. Despite this, it should be noted that the contribution of oil supply shocks in explaining the returns volatility is weakly more than aggregate demand shock for certain BRICS and G7 markets that are India, South Africa, France, Germany, Italy, and UK.
Therefore, between BRICS and G7 markets behavior, we note a convergence. The returns volatility of BRICS and G7 markets is more explained by oil specific demand shock and not by aggregate demand shock such as Bastianin et al. (Citation2016). These markets are more vulnerable to oil specific demand shock than other oil shock and their investors are more influenced in precautionary demand associated with market concerns about the availability of future oil supplies; hence they are more vulnerable to investor sentiment and a high uncertainty characterize these markets.
Furthermore, when we observe the contribution of volatility to explain followed returns volatilities, we note that this contribution is not important for all BRICS and G7 markets. This result shows that there are other factors affecting and explaining the returns volatility of BRICS and G7 markets. Among these factors, business cycles is an explicative factor detected in BRICS market by Bouri et al. (Citation2020), geopolitical risk (as Alqahtani et al., Citation2020), and investor sentiment (as Zhu et al., Citation2020).
5.4. Robustness checks
To verify the robustness of our results, we have estimated the same model using different lags in Table . We notice that although the impact of oil supply shocks is small, it increases over time and this is for most BRICS and G7 markets. This result confirms the non-absolute negligence of the impact of oil supply shocks. The impact of aggregate demand shocks almost did not change for all markets. However, the contribution of oil-specific demand shock in variance decomposition of returns volatility increases over time; that is a confirmation of our results.
Table 4. Variance decomposition- returns volatility for different lags
Volatility problem remains a central theme in the financial literature. Oil shocks play a very important role in explaining this risk. Consequently, it is worth noting that the study of oil shocks-market returns volatility has crucial implications. Furthermore, some studies such as Golam and Monowar (Citation2015) found that the BRICS have the potential to challenge the G7 in the coming decades and is expected to surpass that of the G7 countries by 2050 (Naik et al., Citation2018; Plakandaras et al., Citation2019). Therefore, modeling and forecasting the volatility of the BRICS and G7 markets in particular, due to the oil shocks, is of great importance. In this paper, we have examined the response of daily stock market volatility for BRICS and G7 member countries to daily oil shocks over the entire study period from 11 February 2000 to February 12, 2021. We have implemented a three-stage approach. The first stage have applied GJR-GARCH model to detect market volatility. In the second stage, we have applied a structural VAR model in order to separate and identify the impact of different structural shocks on BRICS and G7 markets volatility. Finally, we have used the variance decomposition from the structural VAR in order to analyze the contribution of each shock to the variability of stock market’s volatility. Employing three different measures of the disentangled global oil shocks; oil supply shocks, aggregate demand shocks, and oil specific demand shocks which extends the demand and supply decomposition of oil shocks by Kilian (Citation2009) and Kilian and Park (Citation2009), we found a convergence between BRICS and G7 markets behavior to oil shocks; is that the reaction of most stock market volatilities is more intensive for a specific demand shock than for an aggregate demand shock and a supply shock. This result represents a manifestation of the BRICS countries challenge those of the G7 countries. Furthermore, a significant asymmetric response of market volatility to structural oil price shocks is detected for all markets. The intense reaction of volatility to oil specific demand shocks, compared to supply shocks and aggregate demand shocks, and the asymmetric reaction to different oil price shocks require authorities to treat the sources of oil price shocks differently. They should also be more cautious regarding demand shocks but the impact of oil supply shocks should not be overlooked for India, South Africa, France, Germany, Italy, and UK. These findings have several important policy implications.
First, investors in global financial markets, global risk managers, and local policymakers should put too much emphasis on the impact of oil specific demand shock on stock market volatility but not overlook the effect of oil supply shocks. Our study has shown that the effect of oil supply shocks is weak, but for some markets it is greater than the effect of global demand shocks. Moreover, the study of the same model for several lags shows that the effect of oil supply shocks increases over time; which shows that our results are robust.
Second, for investor sentiment and markets efficiency, BRICS and G7 markets are more vulnerable to oil specific demand shock than other oil shock and their investors are more influenced in precautionary demand associated with market concerns about the availability of future oil supplies; hence they are more vulnerable to investor sentiment and a high uncertainty characterize these markets.
Third, policymakers play an important role for investors in certain BRICS (India, China, and South Africa) and G7 markets (Japan) in clarifying whether the oil price increase is a consequence of an increase in aggregate demand or in specific demand.
Fourth, our results show convergences and divergences in reactions of different BRICS and G7 markets. These behaviors can be explained by the challenge of the BRICS economies to the G7 economies (Golam & Monowar, Citation2015; Gyedu et al., Citation2021; Mensi et al., Citation2014; Naik et al., Citation2018; O’Neill & Stupnytska, Citation2009; Plakandaras et al., Citation2019; Ruzima & Boachie, Citation2018). This result points out that BRICS markets are an opportunity for investors and for futures investments and it is underscored by the findings in this study is the need to devise strategies for portfolio construction and diversification across BRICS and G7 and to anticipate the source of stock volatility related to different oil shocks.
For a future research, it would be interesting to extend our study by comparing the impact of oil shocks on stock market to other impact such as business cycles (as Bouri et al., Citation2020), geopolitical risk (as Alqahtani et al., Citation2020) and investor sentiment (as Zhu et al., Citation2020).
Disclosure statement
No potential conflict of interest was reported by the author(s).
Additional information
Funding
Notes on contributors
Houda BenMabrouk
Houda BenMabrouk was born in 1983. Lecturer in Finance at the Institute of Higher Commercial Studies of Sousse Tunisia with a thesis defended in 2011 from the Faculty of Economics and Management of Sfax, she has done most of her work in research in the field of behavioral finance, asset pricing and econometrics applied to finance. She has published her work in several international journals such as North American Journal of Economics and Finance, International Journal of Finance and Economics, Managerial Finance, Cogent Economics and Finance, etc.
Wafa HadjMohamed
Wafa HadjMohamed was born in 1982. Assistant in Finance at the Institute of Higher Commercial Studies of Sousse Tunisia with a thesis defended in 2017 from the Faculty of Economics and Management of Sfax, she has done most of her work in research in the field of behavioral finance, asset pricing and econometrics applied to finance.
Notes
1. In order to obtain a daily frequency of the three oil shocks, we converted the monthly series by applying a linear mathematical transformation of the series.
References
- Aloui, C., Nguyen, D. K., & Njeh, H. (2012). Assessing the impacts of oil price fluctuations on stock returns in emerging markets. Economic Modelling, 29(6), 2686–17. https://doi.org/10.1016/j.econmod.2012.08.010
- Alqahtani, A., Bouri, E., & Vo, X. V. (2020). Predictability of GCC stock returns: The role of geopolitical risk and crude oil returns. Journal Pre-proof, 68(C), 239–249. https://doi.org/10.1016/j.eap.2020.09.017
- Antonakakis, N., Gupta, R., Kollias, C., & Papadamou, S. (2017). Geopolitical risks and the oil-stock nexus over 1899-2016. Finance Research Letters, 23(C), 165–173. https://doi.org/10.1016/j.frl.2017.07.017
- Balcilar, M., Gabauer, D., & Umar, Z. (2021). Crude Oil futures contracts and commodity markets: New evidence from a TVP-VAR extended joint connectedness approach. Resources Policy, 73(C), 102219. https://doi.org/10.1016/j.resourpol.2021.102219
- Bastianin, A., Francesca Conti, F., & Manera, M. (2016). The impacts of oil price shocks on stock market volatility: Evidence from the G7 countries. Energy Policy, 98(C), 160–169. https://doi.org/10.1016/j.enpol.2016.08.020
- Bastianin, A., & Manera, M. (2017). How does stock market volatility react to oil price shocks? Macroeconomic Dynamics, 22(3), 1–17. Printed in the United States of America. https://doi.org/10.1017/S1365100516000353
- Bernanke, B. S. (1983). Irreversibility, uncertainty, and cyclical investment. Quarterly Journal of Economics, 98(1), 85–106. https://doi.org/10.2307/1885568
- Bouri, E., Demirer, R., Gupta, R., & Sun, X. (2020). The predictability of stock market volatility in emerging economies: relative roles of local. Regional and Global Business Cycles. Economics. Journal of Forecasting, 39(6), 957–965. https://doi.org/10.1002/FOR.2672
- David, A., Dickey, W., & Fuller, A. (1981). Likelihood ratio statistics for autoregressive time series with a unit root. Econometrica, 49(4), 1057–1072. https://doi.org/10.2307/1912517
- Degiannakis, S., Filis, G., & Kizys, R. (2014). The effects of oil price shocks on stock market volatility: evidence from European data. The Energy Journal, 35(1), 35–56. (22 pages) https://doi.org/10.5547/01956574.35.1.3
- Ferrer, R., Shahzad, S., J, H., López, R., & Jareño, F. (2018). Time and frequency dynamics of connectedness between renewable energy stocks and crude oil prices. Energy Economics, 76(C), 1–20. https://doi.org/10.1016/j.eneco.2018.09.022
- Glosten, L. R., Jagannathan, R., & Runkle, D. E. (1993). On the relation between the expected value and the volatility of the nominal excess return on stocks. The Journal of Finance, 48(5), 1779–1801. https://doi.org/10.1111/j.1540-6261.1993.tb05128.x
- Golam, M. M., & Monowar, M. (2015). The rise of the BRICS and their challenge to the G7. International Journal of Emerging Markets, 10(1), 156–170. https://doi.org/10.1108/IJOEM-07-2012-0063
- Gonc¸, S., & Kilian, L. (2004). Bootstrapping autoregressions with conditional heteroskedasticity of unknown form. Journal of Econometrics, 123(1), 89–120. https://doi.org/10.1016/j.jeconom.2003.10.030
- Gyedu, S., Heng, T., Ntarmah, A. H., He, Y., & Frimppong, E. (2021). Technological Forecasting and Social Change. https://doi.org/10.1016/j.techfore.2021.121169
- Ji, Q., Liu, B. Y., & Fan, Y. (2019). Risk dependence of CoVaR and structural change between oil prices and exchange rates: A time-varying copula model. Energy Economics, 77(C), 80–92. https://doi.org/10.1016/j.eneco.2018.07.012
- Jiang, Y., Lao, J., Mo, B., & Nie, H. (2018). Dynamic linkages among global oil market, agricultural raw material markets and metal markets: An application of wavelet and copula approaches. Physica A: Statistical Mechanics and Its Applications, 508(C), 265–279. https://doi.org/10.1016/j.physa.2018.05.092
- Kilian, L. (2009). Not all oil price shocks are alike: Disentangling demand and supply shocks in the crude oil market. American Economic Review, 99(3), 1053–1069. https://doi.org/10.1257/aer.99.3.1053
- Kilian, L., & Park, C. (2009). The impact of oil price shocks on the U.S. stock market. International Economic Review, 50(4), 1267–1287. https://doi.org/10.1111/j.1468-2354.2009.00568.x
- Kilian, L., & Vega, C. (2011, May). Do energy prices respond to u.s. macroeconomic news? A test of the hypothesis of predetermined energy prices. The Review of Economics and Statistics, MIT Press, 93(2), 660–671. https://doi.org/10.1162/REST_a_00086
- Malik, F., & Umar, Z. (2019). Dynamic connectedness of oil price shocks and exchange rates. Energy Economics, 84(C), 104501. https://doi.org/10.1016/j.eneco.2019.104501
- Mensi, W., Hammoudeh, S., Reboredo, J. C., & Nguyen, D. K. (2014). Do global factors impact BRICS stock markets? A quantile regression approach. Emerging Markets Review, 19(C), 1–17. https://doi.org/10.1016/j.ememar.2014.04.002
- Naeem, M., Umar, Z., Ahmed, S., & Ferrouhi, E. M. (2020). Dynamic dependence between ETFs and crude oil prices by using EGARCH-Copula approach. Physica A: Statistical Mechanics and Its Applications, 557, 124885. https://doi.org/10.1016/j.physa.2020.124885
- Naik, P. K., Gupta, R., & Padhi, P. (2018). The relationship between stock market volatility and trading volume: Evidence from South Africa. Journal of Developing Areas, 52(1), 99–114. https://doi.org/10.1353/jda.2018.0007
- O’Neill, J., & Stupnytska, A. 2009. The long term outlook for the BRICs and N-11 post crisis, Goldman Sachs Global Economic Paper No. 192, Goldman Sachs, New York, NY, December 4.
- Peter, C., B, P., & Pierre, P. (1988). Testing for a unit root in time series regression. Biometrika, 75(2), 335–346. https://doi.org/10.2307/2336182
- Pindyck, R. H. 1990. Irreversibility, uncertainty, and investment. WORKING PAPER 3307. National Bureau of Economic Research. https://doi.org/10.3386/w3307
- Plakandaras, V., Gupta, R., Gil-Alana, L., Wohar, A., & M, E. (2019). Are brics exchange rates chaotic? Applied Economics Letters, 26(13), 1104–1110. https://doi.org/10.1080/13504851.2018.1537473
- Ruzima, M., & Boachie, M. K. (2018). Exchange rate uncertainty and private investment in brics economies. Asia-Pacific Journal of Regional Science, 2(1), 65–77. https://doi.org/10.1007/s41685-017-0062-0
- Salisu, A. A., & Gupta, R. (2021). Oil shocks and stock market volatility of the BRICS: A GARCHMIDAS approach. Global Finance Journal, Elsevier, 48(C). https://doi.org/10.1016/j.gfj.2020.100546
- Tchatoka, F. D., Masson, V., & Parry, S. (2018). Linkage between oil price shocks and stock returns revisited. Energy Economics, 82(C), 42–61. https://doi.org/10.1016/j.eneco.2018.02.016
- Umar, Z., Jareño, F., & Escribano, A. (2021a). Oil price shocks and the return and volatility spillover between industrial and precious metals. Energy Economics, 99(C), 105291. https://doi.org/10.1016/j.eneco.2021.105291
- Umar, Z., Jareño, F., & Escribano, A. (2021b). Agricultural commodity markets and oil prices: An analysis of the dynamic return and volatility connectedness. Resources Policy, 73(C), 102147. https://doi.org/10.1016/j.resourpol.2021.102147
- Wang, Y., Wu, C., & Yang, L. (2013a). Oil price shocks and stock market activities: Evidence from oil-importing and oil exporting countries. Journal of Comparative Economics, 41(4), 1220–1239. https://doi.org/10.1016/j.jce.2012.12.004
- Wen, X., Bouri, E., & Cheng, H. (2019). The crude oil–stock market dependence and its determinants: evidence from emerging economies. Emerging Markets Finance and Trade, 55(10), 2254–2274. https://doi.org/10.1080/1540496X.2018.1522247
- Zhu, Z., Ji, Q., Sun, L., & Zhai, P. (2020). Oil price shocks, investor sentiment, and asset pricing anomalies in the oil and gas industry. International Review of Financial Analysis, Elsevier, 70(C), 101516. https://doi.org/10.1016/j.irfa.2020.101516