
 ?Mathematical formulae have been encoded as MathML and are displayed in this HTML version using MathJax in order to improve their display. Uncheck the box to turn MathJax off. This feature requires Javascript. Click on a formula to zoom.
Abstract
The main objective of this paper is to examine the drivers, barriers of financial inclusion, and saving and credit behaviour in Ethiopia. We used the World Bank 2017 Findex database to carry out logit estimations. We found that being educated, richer, a man, and older associated with greater level of financial inclusion with a strong influence of income and education. We found that the existing gender gaps in the financial inclusion is mainly due to women exclusion from the non-financial sector. While younger and poor adults do not access formal accounts due to involuntary exclusion (distance to the nearest financial access point, affordability, and lack of documentation), older and richer individuals are constrained by voluntary barriers (lack of money, family member has account). Women are less likely to save for farm or business and old age security purposes, while educated individuals in the wealthiest 20% quintile save for old age security purposes. The rich and the poor seek formal credit primarily for farm/business and asset purchase. Our work confirms that the determinants, barriers, saving, and credit behaviour are different across individual characteristics. We strongly recommend that policies that aim to foster financial inclusion should target the vulnerable (the poor, young, less educated, and women) population groups. Authorities and policymakers should strive to improve women participation in the formal real sector of the economy, financial institutions should adopt technologies such as mobile banking and mobile money to ensure the accessibility of financial services.
Public Interest Statement
Financial inclusion is an important factor in achieving the World Bank’s 2030 Sustainable Development Goals. Empirical evidences suggested that financial inclusion plays a prominent role in reducing poverty and inequality while boosting growth and maintaining financial stability. Against this background, people in developing countries are largely unbanked and therefore access and use of formal financial services is very low. Therefore, the paper attempted to understand financial inclusion in Ethiopia by using formal account ownership, savings, and credit as indicators of financial inclusion, and explored whether inclusion differs with individuals’ socio-economic behavior. The results of the study showed that the extent of use of formal financial services is low, financial inclusion varies with individuals’ socio-demographic characteristics, and both voluntary and involuntary barriers hamper access to financial services. The study calls on policymakers and financial institutions to deploy digital financial systems to break down the barriers, thereby increasing financial outreach for the poor, women and underprivileged groups in society. .
1. Introduction
Since the 2010 G20 summit in Seoul, financial inclusion, where financial services are leveraged by formal financial institutions, has been recognized as one pillar of development for the global economy (Zins & Weill, Citation2016). Financially included individuals can invest in education, open, or extend businesses thus, playing a crucial role in reducing poverty and sustaining inclusive growth (Bruhn & Love, Citation2014).
In the literature, financial inclusion is commonly defined as having an account in a formal financial institution (banks, microfinance, and payment instruments). Beck and Demirguc-Kunt (Citation2006) described financial inclusion as “the ease of accessibility and availability of the formal financial services, such as bank deposit, credits, insurance, etc., for all participants in an economy.” A society included in the financial system benefits from accessing financial services by creating opportunities to maintain its capital stability. Being financially included. i.e., having an account at formal financial institutions allows people to save, quickly get credit, have insurance contracts, or reduce transaction costs through using easy payment systems (i.e., online transfers). Access to financial services will significantly benefit lower-income groups by lifting financial constraints and financing small business projects. It also allows people to increase their income and create employment opportunities(Demirguc-Kunt et al., Citation2013).
Financial inclusion is critical in reducing poverty, inequality and promotes business startups (Bruhn & Love, Citation2014; Ajide, (Citation2020b). They argued that finance would spur economic development by fostering business developments through reducing financial constraints in creating new business firms and maintaining the existing firms to survive and increasing employment. Access to the different facets of financial inclusion such as mobile money would help to efficiently allocate consumption, and promote people out of the poverty trap. A better financial inclusion also increases the per capita consumption of households and enhance the capacity of people to live a worthwhile lives (Abor et al., Citation2018). Financial development through financial inclusion allows to reduce income inequality and boost the income growth of the poor(Beck et al., Citation2007). An inclusive financial system helps to trigger change and eliminate poverty traps(Li, Citation2018). Financial inclusion plays a pivotal role to economic growth directly through reducing poverty and inequality, and indirectly through improving the financial sector development. According to a study by Anarfo et al. (Citation2019) financial inclusion and financial sector development reinforce each other. A developed financial sector reduces the credit constraint to businesses, smooth consumption and provides opportunities to allocate resources on the productive investment. A society with access to financial instruments invests in their education, finance projects and promotes their entrepreneurial skills and entrepreneurship development (Demirguc-Kunt, Citation2017). Economies with weak financial intermediation or access will grow slower (Beck et al., Citation2007). Financial inclusion could also improve growth through improving institutions i.e., reducing corruption. Financial inclusion such as mobile banking help to reduce corruption mainly because transactions are easily traceable. Financial intermediaries such as banks are also highly regulated to document and detect illegal transactions through recording customer transactions(Ajide, Citation2020a). The contribution of financial inclusion through women empowerment and creating a stable financial system is also immense(Swamy, Citation2014).
Despite the implication to economic growth, poverty reduction, reduction in inequality and entrepreneurial growth among others, financial inclusion is at its lowest level in Africa, and financial deepening measured in private credit, as a percentage of GDP is the shallowest in sub-Saharan Africa compared to other regions of Africa. As of 2014, domestic credit to the private sector (%GDP), Liquid Liabilities as % of GDP, and Bank deposit as % of GDP were 24.4, 35.3, and 29.7% in sub-Saharan Africa (SSA), which is lower than the average of low-income group countries of the World (Nyantakyi & Sy, Citation2015). The study by Beck and Cull (Citation2015) also confirmed the shallowness of the financial system in Africa. Their study demonstrated that only 21% of firms have a line of credit, and 16% of households have an account in a formal financial institution. It implies that in Africa, firms are credit constrained, barriers to financial services are enormous, and the economic outreach is yet very low.
Ethiopia, which is in SSA, is not the exception. Financial institutions like micro-finance, banks, and insurance companies are expanding their outreach and package of services. Recently, financial inclusion has gained strong momentum globally, and Ethiopia has adopted it as one pillar of its financial system development. Despite the progress in the financial sector development by increasing access to financial technologies (mobile banking, e-money, or electronic payment systems) and establishing financial institutions across the country, the financial system is shallow and concentrated in the urban areas (Desalegn & Yemataw, Citation2017; National Bank of Ethiopia, Citationn.d.). Better financial system development contributes to the growth in the business condition. In Ethiopia, doing business is exceptionally uneasy, in which access to credit by firms is the primarily difficult. In a report by the European Development Bank on the recent developments in the African banking sector, Kappeler et al. (Citation2018) stated that 70% of micro-firms and 40% of SMEs face difficulties in accessing credit in Ethiopia. Only nearly 35% of the population older than 15 years has accounts at formal financial institutions. The use of digital banking/payment systems is negligible, with less than 5% of the population having mobile accounts. This is by far lower than the neighboring east African countries like Kenya, Uganda, and Tanzania; in Kenya, 80%, in Uganda and Tanzania, half of the population aged over 15 years have mobile accounts or digital payment systems. Recently, associated with the efforts to bring structural transformation and digitize the economy, the Ethiopian government enacted policies on digital payment systems.
Empirical studies on the financial inclusion are not well found and the existing studies varied in the use of data and units of analysis. A study by Desalegn and Yemataw (Citation2017) attempted to investigate the determinants and barriers of financial inclusion using the Ethiopian Socio-economic survey data (ESS 2015). Their finding revealed that better education, gender, and age are associated with greater level of financial inclusion. They also found that both involuntary (distance to the financial center), and voluntary barriers (lack of money and lack of trust) are common barriers to access financial accounts in Ethiopia. Similarly, Abdu and Adem (Citation2021) studied the determinants of financial inclusion in Afar region Ethiopia using a cross-sectional data collected from households in Afar region. The findings of their study revealed that about 68% of households are excluded from the financial sector, and while age positively associated with financial inclusion, income negatively affects financial inclusion. Besides, lack of trust on the financial institutions, lack of money, and lack of access to bank branches and ATM machines were reported as the major barriers to household financial inclusion. Alemu (Citation2014) explored the link among financial inclusion, regulation, and growth. His study witnessed that financial inclusion is very low in Ethiopia, albeit progresses seen in the last 10 years. Alemu (Citation2014) discovered that lack of physical access to financial institutions is the main obstacle in the effort to increase financial inclusion in Ethiopia.
Desalegn and Yemataw (Citation2017) analyzed financial inclusion and the barriers to financial inclusion at individual level. However, they did not investigate the behavior of individuals on financial inclusion (saving and credit motives of individuals) and the factors that influence such motivations. Abdu and Adem (Citation2021) also investigated financial inclusion at household level and regional level. Besides this, their study did not account for the different saving and credit motivations of households and overlooked how the different barriers to financial inclusion are associated with the various socio-demographic characteristics of individuals. Alemu (Citation2014) also did not analyze the determinants of financial inclusion, instead; he was interested in identifying the barriers to financial inclusion. Besides these studies in Ethiopia, individual country studies such as (Chakravarty & Pal, Citation2013) in India and (Fungáčová & Weill, Citation2015) in China also did not investigate the saving and loan taking motivations of individuals and the factors influencing such motivations. Furthermore, those studies in Ethiopia did not adopt similar indicators and recent data.
Having the above background, our study is unique from the above-mentioned studies conducted in Ethiopia. On the one hand, our study is an addition to the literature with up-to-date and globally administered data and appropriate financial inclusion indicators. On the other hand, unlike to previous studies in Ethiopia, our study is a comprehensive study of the financial inclusion. We studied the barriers to financial inclusion, the motivations to saving and loan taking by individuals, and how these barriers and motivation are associated with individual characteristics. Therefore, our work contains findings to design policies on influencing individual behaviours to extend financial inclusion.
In this study, we addressed the following objectives: First, we investigated the determinants of each financial inclusion indicator (ownership of account, formal saving, and use of credit at formal financial institutions). Second, we examined the barriers to financial inclusion and how these barriers relate to each sample characteristic. This is crucial in the way forward to devise policies and strategies to mitigate financial inclusion. Third, we analyzed the common motivations to get credit/loan, and to save by individuals and how individual characteristics have associated with these motivations. In general, the main purpose of this study is to provide insights on the determinants, the barriers to financial inclusion, and the motivations to use financial services in Ethiopia.
Based on the empirical literature we have made the following hypothesis:
Hypothesis 1: Financial inclusion is significantly correlated with individual characteristics. We expect female, young, less educated and poor individuals financially excluded. Women are predisposed to discriminations in both the financial and non-financial sector, youths lack the necessary documentations to access financial services and likely to lack experiences to join the labor market. We also hypothesized that less educated and poor individuals are also likely to exclude from the formal financial sector because they may not have the necessary information to open accounts, manage transactions, and make financial transactions.
Hypothesis 2: The barriers to financial inclusion are both voluntary and involuntary. Lack of documentation, lack of money, and physical barriers to access financial services are expected to be more common than other barriers. However, gender gaps in the financial inclusion are likely due to differences in the non-financial sector of the economy. This is because in developing countries with low level of financial development, women are financially constrained thereby work on the informal and undervalued jobs.
Hypothesis 3: saving and credit motives vary with individuals socio-demographic characteristics. While being older, educated and rich positively associated with saving for the old age security purpose, the major motives of seeking loans are to start business and to own assets.
The rest of our paper is organized as follows. Section 2 is devoted to the literature review; section 3 presents the methodology of the study; section 4 dedicates to the econometric estimation and discussion of the findings. Section 5 remarks the main conclusions; and section 6 presents recommendations and policy implications.
2. Review of related literature
This section provides an overview of the literature on financial inclusion. Then, we present the findings on financial inclusion, factors influencing financial access, the saving and credit motivations.
2.1. Assessment of levels of financial inclusion
According to new global data by the 2017 World Bank Findex database, 69% of adults own accounts from financial institutions (banks, microfinance institutions, and regulated institutions like insurance companies and saving and credit associations) over the globe. This figure shows increasing adult access to financial instruments by 7% since 2014 and 18% since 2011. The progress in financial inclusion is mainly associated with introducing new financial services and payment systems through internet access and mobile phone developments. However, the gap in adult accounts ownership is paramount between the higher income group economies (94%) and the lower-income group economies (63%). Over 1.7 billion adults lack access to financial services, and nearly all are from developing countries. 41% of adults in developing countries save money, while the figure is 71% in high-income countries. However, only 21% of adults save at formal financial institutions in developing countries, compared to 55% of adults who commit the same method in developed countries. Using accounts to save for old age is more common in advanced economies (more than half of adults).
In contrast, in developing countries, saving is mainly for business purposes, particularly in sub-Saharan Africa. For example, in Ethiopia, over 29% of adults save to start, operate or expand a business. As of 2017, 48% of adults worldwide saved money in the past 12 months. In emerging economies, 43% of adults use their accounts for saving, far below their high-income counterparts, i.e., 71% (Demirguc-Kunt, Citation2017). Sixty-four per cent of adults in the world accessed credits during the past 12 months. While 90% of adults in high-income economies get credit from formal financial institutions, only 44% of adults get new credit in developing economies through informal methods from families and friends and informal lending clubs.
2.2. Financial inclusion in Ethiopia
Financial inclusion is relatively low in Ethiopia. Only 35% of the adult population has accounts at banks or other formal financial institutions, and below 5% of the adult population has a mobile bank account (Kappeler et al., Citation2018). Seventy per cent of micro-enterprises and 40% of medium enterprises are financially constrained (European Investment Bank [EIB], Citation2020). Wealthier adults have accounts twice as high as those poor counterparts. Besides this, the gap in account ownership is also manifested between men and women. Men are 9% ahead in accessing financial services than women (Demirguc-Kunt et al., 2018). The financial institutions’ outreach is also very low, and concentrations are high. The bank branch to population ratio is 1:15,702Footnote1, and 34.1% of banks are in Addis Ababa. Thirty per cent of bank branches and 51% of banking capital are shared by public banks (National Bank of Ethiopia, n.d).
2.3. Factors influencing financial inclusion
Financial inclusion has been considered as an engine of economic growth and reduces poverty. Bounds of studies in the literature confirmed the positive impacts of financial inclusion on economic growth and employment creation (Bruhn & Love, Citation2014), poverty alleviation (Erlando et al., Citation2020), improving saving behaviour (Morgan & Long, Citation2020) and financial stability (Kappeler et al., Citation2018).
Allen et al. (Citation2016) studied the impact of individual characteristics on financial inclusion. According to their finding, formal account ownership is significantly related to income, level of education, age, living in urban areas, and individuals’ marital status. Individuals’ saving behaviour is also strongly associated with these individual characteristics. Besides the impact on account ownership and saving behaviours, individuals’ likelihood to access formal credit increases when they are older, educated, wealthier, and married. Desalegn and Yemataw (Citation2017) studied financial inclusion in Ethiopia using the Ethiopian Socio-economic survey and the World Bank living standard measure survey (LSMS). Their study finds that age has a non-linear impact on formal financial account ownership; i.e., older individuals are less likely to own and use financial accounts. Besides this, married individuals and those who completed tertiary education are more likely to open and use financial tools.
Using the 2011 world bank Findex database, Fungáčová and Weill (Citation2015) studied financial inclusion in China. The result posited that individuals with higher income, more educated, men and older are more likely to have formal accounts and access to formal credits. Women are less likely to have and use legal accounts or access formal credits because they lack documentation and/or anybody else in the household has an account. Abdu and Adem (Citation2021) studied the determinants of financial inclusion in the Afar region, Ethiopia using cross-sectional household data collected through administered questionnaire. Their finding showed that age, use, financial literacy, and having mobile banking have a positive and significant relationship with financial inclusion in the region. Strikingly their study shows the negative and significant effect of income on financial inclusion. Demirguc-Kunt et al. (Citation2013) also confirmed the existence of gender gap in formal account ownership, formal saving and access to formal credit. Women are more likely to be excluded from using financial tools because of lack of enough collateral, low level of financial literacy, bad credit history of husbands, and low or lack of business experience.
Andrés et al. (Citation2020) used a sample of over 80,000 companies commenced by a sole entrepreneur and examine the entrepreneur’s financial inclusion using three indicators,’ i.e., demand for credit, credit approval ratio, and credit performance. Their study finds that female entrepreneurs are less likely to apply for a loan and if they use it, their likelihood of obtaining the loan is by far lower than male entrepreneurs who apply for a loan. However, those who get the credit are less likely to default.
In India, compared to male-headed households, female-headed households are 8% less likely to access formal finance and 6% less likely to access informal finance. In addition, households run by female heads are 20% lower in terms of using formal loans than their male counterparts. The main mechanisms that constrain the use and access to females’ financial services are education level and the prevailing wage rate (Ghosh & Vinod, Citation2017).
Zins and Weill (Citation2016) studied the determinants of financial inclusion in Africa using the World Bank 2014 Findex database. The finding revealed that gender, age, income, and education are strongly associated with financial inclusion. While being female is negatively and significantly associated with access to formal financial accounts, formal savings, and credit use, being educated and wealthier increases the probability of being financially included. Age has a non-linear effect on financial inclusion. Financial inclusion is higher among adults and it is lower among the old age groups. Looking at the marginal effect of their probit estimation, the main factors that affect financial inclusion are education and income.
Oji (Citation2015) identified the supply- and demand-side challenges of financial inclusion in Africa. Accordingly, low levels of financial literacy, underdevelopment of existing financial systems, lack of credit-reporting institutions, limited capacity of businesses and inadequate infrastructure are constraints for financial inclusion.
Motivated by the lower levels of financial inclusion and the apparent financial inclusion gaps in Africa (Chinoda & Kwenda, Citation2019) investigated whether mobile phones, economic growth, bank competition and stability play roles for financial inclusion. Using the data for 49 countries from 2004 to 2016 and applying a panel structural VAR model, they have found that financial inclusion has a positive response to shocks in mobile phones, economic growth, bank competition and stability.
Asuming et al. (Citation2019) conducted a comparative analysis of financial inclusion in 31 sub-Saharan African countries. Their finding contended that age, education, gender, wealth and presence of financial institutions and GDP growth rate predict financial inclusion in Africa. Their finding posited that females are 4% less likely to have accounts and 2% less likely to have accounts with financial institutions compared to their counterparts. The existing gender gap in financial account ownership is because females are excluded from the formal job market. Consistent with other researchers, their study result also identified that younger groups of individuals are less likely to own and use financial accounts because it is harder to find jobs for these groups in SSA.
From the literature mentioned above, we inferred that there is only little study about the determinants of financial inclusion. Moreover, those available studies vary by geography, temporal span, financial inclusion indicators, and data sources.
3. Methodology of the Study
3.1. Data
In this study, we use the World Bank’s 2017 Global Findex database. The database contains survey data of 143 countries and 150,000 individuals. One thousand randomly selected national representative samples were drawn and surveyed using a structured questionnaire in each country. The unit of analysis comprises adult individuals aged 15 and above, all civilians, and non-institutionalized groups of the entire population.
The World Bank Global Findex Footnote2 database consists of a set of financial inclusion indicators: account penetration, use of financial tools and services (e.g., number of times of bank withdrawal in a month), saving at formal financial institutions, and the motivations to saving and loan taking. Besides this, the database has information on the self-reported barriers of financial inclusion (lack of money, lack of documentation, distance to financial services, affordability, trust, and religious reasons). Thus, the database allows us to examine financial inclusion from different perspectives. Moreover, since it provides information about the individual characteristics of the sample like age, education, income, and gender, carrying out econometric and descriptive analysis is possible. Therefore, we use these micro datasets to analyze the financial inclusion for a single country case, Ethiopia.
3.2. Econometric model specification
Our study uses three indicators of financial inclusion: formal account ownership, formal saving, and credit use. Account ownership indicates that an individual has an account at a financial institution (banks, microfinance, saving and credit associations, etc., legally regulated) or using any online payment systems like mobile banking. Formal saving refers to the individual who has an account at a formal financial institution and saved money using the account within the past 12 months. The third indicator, credit, refers to the fact that individuals obtained loans from formal financial institutions in the last 12 months to the date of data collection. These three indicators are yes/no questions, and each is coded as one when the response is yes and zero otherwise. We also explain the different barriers to financial inclusion, saving and loan taking motives of individuals.
In the empirical literature, it is common to find the use of both logit and probit models to estimate financial inclusion determinants, because of the dichotomous nature of the indicators of financial inclusion. While some authors employed the probit model (Allen et al., Citation2016; Desalegn & Yemataw, Citation2017; Fungáčová & Weill, Citation2015; Zins & Weill, Citation2016), some others applied the logit model (Koker & Jentzsch, 2013; Potrich et al., Citation2015; Abel et al., 2018; Abdu & Adem, Citation2021).
To examine each objective of the study, we carried out logit modelFootnote3 estimations following the literature. To this end, we estimated the following model equation:
Pi=(Y=1|Xi)=
Where Pi is the probability that an individual is financially included, Xi refers to a set of individual characteristics for individual i. Since equation (1) is non-linear in both parameter and variable, we estimated the linearized form of eq (1), which takes the following equation form.
y* = βo+ β1Xi +εi (2)
Y =, the dependent variable Y takes one when the individual is financially included and zero, otherwise. The general model we used to estimate the determinants of financial inclusion is as follows:
Financial inclusioni = ά + β1Agei + β2Age2i + β3Genderi + β4Educationi + β5Incomei +εi (3)
The financial inclusion of individual i, measured by formal account ownership, formal saving and formal credit.
Formal account refers to an adult having accounts with financial institutions within the last 12 months. Formal saving refers to the respondent having saved at a financial institution in the past 12 months. Similarly, formal credit refers to the fact that the person has borrowed from a financial institution in the past 12 months. All of these variables are binary variables that take on one if the person answered “yes” and zero otherwise. Consistent with the recent financial inclusion literature (Allen et al., Citation2016; Amari & Anis, Citation2021; Fungáčová & Weill, Citation2015; Soumaré et al., Citation2016; Zins & Weill, Citation2016) we used individual level socio-demographic variables as explanatory variables.
The right-hand side variables in eq (3) are the individual characteristics, which are covariates used in the estimation of the model. Whereas β1, β2, …, β5 are coefficient parameters, εi is the error term, ά constant term and i represents a given person.
After investigating the determinants of financial inclusion, we also applied the same methodology to analyze the impact of individual characteristics on the behaviour of individuals about barriers to financial inclusion. Barriers are a set of reasons for an individual not to own, save or use accounts from formal financial institutions (such as banks, MFIs, etc). Thus, the model for barriers of financial inclusion can be specified as follows:
Barriersi = ά + β1Agei + β2Age2i + β3Genderi + β4Educationi + β5Incomei +εi (4)
The dependent variable barriers Footnote4 refers to lack of money, lack of trust, lack of documentation, distance, too expensive, religious reasons, family member has account, and no need for financial services. Each barrier takes on the value one if the respondent responded “yes”, zero otherwise.
Once we delved into the barriers to financial inclusion and its relation to individual characteristics, we also estimated the individuals’ motive for saving and credit using the same methodology. The estimated model for saving motivation and credit motivation is as follows in equation (5) and (6), respectively.
Saving motivei = ά + β1Agei + β2Age2i + β3Genderi + β4Educationi + β5Incomei +εi (5)
Saving motive is the dependent variable measured by saved from financial institutions in the past 12 months for business purpose, and for old age security purpose, where each takes on one, if the respondent answered “yes” and zero otherwise.
Credit motivei = ά + β1Agei + β2Age2i + β3Genderi + β4Educationi + β5Incomei +εi (6)
Credit motivei refers to the fact that the individual may be borrowed from financial institutions in the past 12 months for home/apartment/or land, for medical purpose, or for farm/business purpose.
3.2.1. Variables, definitions, and expected signs
Age: age refers to the age of the individuals measured in the number of years at birth. To account for the possible non-linear relationship between the age of individuals and financial inclusion, we use both age and age squared in our model. If the coefficient of age and the coefficient of age square are significant, but the signs are opposite, we confirm the non-linear relationship. Financial inclusion is likely to increase with the increase in age, but beyond a certain threshold, it drops.
Education: A dummy variable that takes one if the individual completed secondary education, zero if primary completed. We postulated that individuals that are more educated have more probability of adopting financial instruments or using financial services; hence, financial inclusion will improve. Furthermore, education allows people to understand how to open accounts, interpret information on financial services. Thus, it finally induces individuals to adopt the new financial tool. Therefore, education may have a favourable implication to promote financial inclusion.
Gender: this variable is a dummy variable, which takes one if the individual is female, zero otherwise. Female individuals are more likely to be discriminated against or financially excluded. It might be either due to a low level of financial literacy, participation in informal sectors, or exclusion from formal employment. Hence, being female is associated with a lower chance of having an account from a financial institution, using their account to save or get credit from financial sources.
Income: income is also a categorical variable based on the income quintile, classified into five quintile groups (poorest 20%, second 20%, third 20%, fourth 20%, and the wealthiest 20%), and we take the most deficient 20% as a reference group. We use four dummy variables, which takes one if the individual’s income falls in the income quintile, zero otherwise. We present the description of the explanatory variables in above.
Table 1. Variables, Definitions, and their expected Sign
4. Estimation and Discussion of Results
In this section, we presented the main empirical findings. First, we discussed the summary statistics of both the dependent and independent variables, and then next, we showed the results of the estimated model (the determinants of financial inclusion as measured by three indicators discussed above). Likewise, we presented the determinants of financial inclusion barriers; lastly, we discussed the determinants of saving and loan-taking motivations using individual characteristics, i.e., age, education, income, and gender, as model covariates.
presents the descriptive statistics of financial inclusion indicators, financial inclusion barriers, and saving and credit motivations. 43.2% of adults have accounts in formal financial institutions, 35.3% of adults saved using accounts at formal financial institutions during the past 12 months, and 10% of the adult population borrowed from financial institutions in the past 12 months. The question of saving and credit is forwarded to those who already have an account at formal institutions. Only 43.2% of the population aged 15 and above have accounts either in a bank or in other alternative formal financial institutions. This figure is far behind the World, which is 69%.
Table 2. Summary Statistics of the dependent variables
The first most significant barrier to financial inclusion is the lack of money to open financial accounts. Eighty-five point three (85.3) percent of individuals do not have accounts because they do not have enough money. In addition, 78% of adults in Africa and 59% of adults worldwide are also reported a lack of finance as the primary reason for not having a financial account. Other barriers are “too far away” 19.1%, “lack of documentation” 9.5%, “ family member already has one” 7.7%, “ no need for financial service” 6.4%, “ too expensive” 4.8%, “ lack of trust,” and “religious reasons” account for 2.1% each.
The data shows that people save for farm/business purposes and security against old age. 29.8% of individuals save for starting a new business, operating, or expanding the existing farm/business, and only 11.1% save for old-age consumption. The business motivation to save is twice of the developing countries (14%). According to Demirguc-Kunt (Citation2017), the main reason for saving in Africa is business purposes. However, these saving methods are mainly through non-formal ways, through assets like livestock and precious goods (jewelry) and saving clubs. Thus, it shows that own saving is an essential source of starting a new or expanding existing business in Ethiopia and Africa.
Ten per cent of adults borrow from financial institutions during the last 12 months. The reason for borrowing is for farm/business purposes (12.7% of adults), for medical purposes (8.4% of adults), and home, land, or apartment (4.9% of adults). As a developing economy, the primary source of borrowing is not the formal financial institution in Ethiopia. Figure , presents the different sources of borrowing for individuals, which shows that 30.06% of adults reported they borrowed from families and friends, 16.87% borrowed from an informal saving club, and only 10% borrow from a formal financial institution.
Figure 1. Sources of Borrowing.
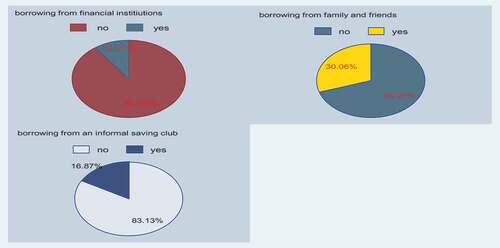
Table explains the definitions and descriptive statistics of the individual characteristics we use to estimate our model. For example, Table explains that 60.2% of the samples are female, the mean age is 33 years, 28.7% of individuals completed secondary education, and 30.4% are in the wealthiest 20% income quintile.
Table 3. Summary statistics of explanatory variables
4.1. The determinants of financial inclusion
Table depicts the marginal effects of the logit estimations for the three indicators of financial inclusion. individual adult characteristics have a different impact on financial inclusion.
Table 4. Results of the Logit model estimation (Marginal Effect)
Table displays the logit estimations of determinants of financial inclusion in Ethiopia. The dependent variables are formal saving; formal account, formal credit, and explanatory variables are gender, age, education, and income. The coefficients are marginal effects, and standard errors are in parenthesis.
Being female is negatively and significantly associated with formal account ownership. It implies females are more likely to be excluded in account penetration. Female individuals are 11.5% less likely to open accounts in formal financial institutions than their male counterparts (column 2). The main argument for the exclusion of females from financial access is that they are out of economic inclusion for several reasons. According to a study by the UN women and the World Bank, between the age of 20 and 34 women are more predisposed to poverty than men are, and the cost of marital breakups is more severe on women than men. Divorced women between the age of 18 and 49 are more than twice poorer than men counterparts Footnote5 . Besides this, women constitute the largest share of the informal economy, while commercial banks and microfinance institutes focus on the formal economy. Another explanation is that women tend to contribute the largest share of their income for household consumption than men, work in low paid and/or undervalued jobs. In the same vein, women are likely to make high-frequency transactions and are often manage daily expenses and smooth household financial risk. Women face events such as childbirth and divorce that disrupt their saving patterns and decrease their propensity to save, thereby their accounts become inactive (Lewis & Messy, Citation2012). However, once they open formal accounts, females are more likely to save and access credits using their financial account, as indicated by the positive coefficient of gender for the first and third columns of . Female individuals have a 12.7% and 3.8% chance of saving and getting credit from formal financial institutions than male individuals, respectively. This is in line with the mission of micro finances (MFIs) and other saving and credit cooperatives in the sense that in the face of credit, women are given priority over men. Mndolwa and Alhassan (Citation2020) also finds that women are 2% more likely to access credit than men are. The effect of gender on account ownership and saving is consistent with the findings of (Fungáčová & Weill, Citation2015; Zins & Weill, Citation2016; Asuming et al., Citation2019).
Age is another significant variable that influences financial inclusion. We found a positive and negative coefficient of age and age square for a formal account, whereas for the saving and credit, age is negative, and age square is positive. Therefore, we detected a non-linear impact of age on financial inclusion. An increase in the age of individuals increases the probability of formal account ownership by 3.2% but only to some extent. Later on, after some age limit, being older significantly reduces formal account ownership. It might be because at old ages, individuals will be out of the labour force or engage only in a few lines of income-generating activities or may prefer to hold cash to reduce the frequency of travel to withdraw money from financial institutions at retirement. Fungáčová and Weill (Citation2015) explain this effect as a “generation effect,” derived from either the demand or the supply side of the financial system. The fall in account ownership at old age is because banks may not attract older clients. An increase in age significantly reduces formal saving and formal credit, but saving and credit from formal institutions bounced back beyond a certain threshold. The youngest is less likely to be financially included because they have less money to save and get loans or do not have enough income to save and no collateral or guarantee to secure credit. Assuming et al. (2018) justified that younger individuals are less included in the formal financial sector because they are less likely to be in the formal job market. However, eventually, as age increases, individuals will be interested in keeping money at formal financial institutions and having assets or other collateral forms to secure credit. Hence, beyond a specific limit being old increases the likelihood of financial inclusion through using institutions for saving and accessing credit. This result is consistent with the findings of Abdu and Adem (Citation2021) for the Afar region, Allen et al. (Citation2016) worldwide and Zins and Weill (Citation2016) for China. However, Desalegn and Yemataw (Citation2017) for Ethiopia did not confirm a significant relationship between age and the use of accounts for credit.
Education influences financial inclusion through access to financial information, financial decision-making and financial literacy. Hence, theoretically, we expected a positive and significant effect of education on financial inclusion indicators. Consistent with the literature, the result shows that being more educated significantly increases the probability of having formal accounts but significantly reduces savings. The second is a striking result against empirical findings. Similar to our study result Mndolwa and Alhassan (Citation2020) also found that education reduces the likelihood of individuals exclusion from the financial sector, particularly for women. Financial education increases individuals awareness on how to open accounts, manage transaction and make transfers/payments. A study by Desalegn and Yemataw (Citation2017) also found that financially literate individuals are more likely to own accounts in the formal financial institutions. However, we are not able to deduce any significant relationship between education and using financial accounts to get credit, which may be because credit is conditional on the borrower’s ability to provide collaterals rather than being educated. Many studies in the literature have confirmed the positive impact of education on formal account ownership (Fungáčová & Weill, Citation2015; Allen et al., Citation2016; Zins & Weill, Citation2016; Desalegn & Yemataw, Citation2017; ing et al., Citation2019).
Income also has a significant and positive relationship with financial inclusion. The likelihood of owning an account is higher among individuals in the wealthiest income group. A person in the top 20% income group has 36% more likely to hold a financial account than a person in the lowest 20% poorest/the reference income group (column 2). Thus, individuals with a high-income level have enough income to open accounts and fewer barriers to access financial inclusion. The main reason not to have accounts has been reported as lack of enough money in the literature. Therefore, the richest have less financial constraint, with many business activities requiring them to open accounts for transactions. Our result is not an exception, rather Demirgüç-Kunt and Klapper (Citation2013) also found a positive relationship between income and account ownership. Allen et al. (Citation2016) and Zins and Weill (Citation2016) also found a positive relationship between income and formal account ownership. Our result shows that individuals in the higher income quintile are less likely to use accounts for saving than our prior expectation. This result is consistent with the findings of (Abdu & Adem, Citation2021) for the Afar region, Ethiopia. The result shows that lower-income individuals are more likely to use accounts to save. Those lower-income groups are more financially constrained. When they need any loan from any formal financial institutions such as saving and credit associations, and MFIs, they are required by law to open accounts and save some proportion of the loan in their financial account. Besides this, individuals that are more affluent may keep their money in non-formal methods like lending it to borrowers to get a higher curve market interest rate, precious goods like gold, and in terms of livestock or purchase of fixed assets (house). Resorting to such informal saving is because these methods allow people to transform cash into fixed assets and safeguard themselves against loss of purchasing power of money in the future. Demirgüç-Kunt and Klapper (Citation2013) argue that saving behaviour is subjective and influenced by culture. We did not find any significant link between income and the use of accounts for credit.
4.2. Determinants of barriers to financial inclusion
Here, we analyze whether individual characteristics have impacts on barriers of having a formal account. The different barriers we used as a dependent variable are self-reported barriers to financial inclusion collected in the survey. Using these constraints (column headings of Table ) to access financial accounts as an outcome variable, we examine how individual characteristics affect these barriers.
Table 5. Determinants of Barriers to Financial Inclusion in Ethiopia
From the estimation result, we observe that gender has no strong link with the barriers to financial inclusion, as the estimated coefficients are not statistically significant. The implications seem that these barriers do not hinder both males and females from accessing financial accounts or services. However, we argue that the economic implication is significant. Being a female is associated differently to the different barriers. Being female is negatively associated with distance, affordability of financial services, religious reasons, and lack of money. On the other hand, lack of documentation, lack of trust and family members have an account are barriers that hinder females from owning and using financial accounts, albeit the relations are weak. From this, we can conclude that the gender gap in financial inclusion is mainly due to differences in participation in non-financial sectors of the economy like education and employment that eventually hung them not to access financial services. Other reasons, such as culture, legal discriminations and gender norms might play a role in women’s exclusion from financial inclusion (Demirguc-Kunt et al. (Citation2013). According to Zins and Weill (Citation2016), in Africa, market failures such as documentation, and lack of trust does not account for women’s exclusion from the formal financial sector; instead, cultural reasons are responsible for their exclusion to access finacial services. Aterido et al. (Citation2013) discussed that substantial discriminations against social (education) and participation in non-financial (formal employment), differences in income levels and household responsibilities (heading household) are the main drivers of the observed gender gap in sub-Saharan Africa. Likewise, Ghosh and Vinod (Citation2017) studied the constraints of financial inclusion for women using Indian microdata and their finding confirmed that women are less likely to be financially included where; education and wage are the major factors explaining the gender gap in access to finance. Morsy (Citation2020) also pointed out that women financial access are correlated with the accessibility and quality of financial information.
Concerning age, distance, expensiveness, and lack of documentation are problems solved over time. They put less and less problem to access financial accounts to some age limit. Beyond a certain age, these barriers significantly hinder individuals from accessing financial accounts (the sign of age square is positive). As an individual’s age goes up from a certain threshold, involuntary exclusions such as distance and cost of financial services impede individuals from accessing and using financial accounts. Unlike the non-linear relationship between age and other barriers discussed, lack of money is one major barrier to access financial accounts for all age groups. The result is consistent with the findings of (Soumaré et al., Citation2016; Zins & Weill, Citation2016). One important solution to reduce the impact of distance as a barrier to financial inclusion rests on adopting appropriate and less costly digital financial technologies such as mobile banking and internet banking. The use of mobile money is a critical element of financial inclusion that could break distance barriers through making payments, transfers, and saving possible from a distance. Besides this, digital technologies are less expensive for banks to install compared to establishing new branches(Senou et al., Citation2019). Chinoda and Kwenda (Citation2019) also argued that mobile money is a tool meant to reduce socio-economic and geographic barriers for the poor and clients in remote areas. It reduces the travel cost to make payments and purchases to customers and improve the profitability of banks. Therefore, we advise policymakers to aggressively work on increasing the penetration of accessible, affordable digital financial systems. However, the extension of a strong telecommunication system is at the heart of digital systems.
Income is associated with distance, religious reasons, lack of money, and lack of documentation. While religious reasons are less problematic for the poor, lack of money and distance are major barriers in accessing financial accounts. One major reason for the richest adults’ choice not to have a formal account is that they perceive a family member have an account. Our finding revealed that those individuals are 12.9% more likely not to have formal accounts because their family member has an account. No individual characteristics are associated with the barrier “No need for financial service”
To sum up, from the significant drivers of financial inclusion in Ethiopia, gender, education, and income are associated with different barriers. This result is also similar to the findings of (Allen et al., Citation2016; Fungáčová & Weill, Citation2015;; Zins & Weill, Citation2016).
4.3. Understanding the saving and credit behaviour in Ethiopia
Here, we examine the determinants of saving behaviour using two saving motivations “for farm or business,” and for “old age,” and credit motivations, “for farm/business purpose,” and “for medical purpose.”
4.3.1. Understanding saving behaviour
Table displays that saving behaviour is significantly related to gender, age, and income characteristics. Females are less likely to save for farm or business, or old age purposes. Being female substantially reduces the likelihood of saving for farm or business and old age purposes by 13.7% and 6.1%, respectively. The finding contends that females and males have different savings behaviour. Our result is consistent with the findings of (Zins & Weill, Citation2016). Being older is associated with both types of saving motivations. Up to certain age, being older increases the likelihood of saving. Education increase the probability of saving for old age purpose by 6.8%, and the rich are motivated to keep for business and old age security. Being rich induces saving for old age by 7.5% to 14.5%, and the top 20% richest individuals are 11.8% more likely to save for farm/business purposes than the poorest individuals. The result is in line with the argument that poor individuals are more likely to save for daily expenses while the high-income groups are more likely to save for retirements and growth. Our findings are consistent with the theoretical expectations and with the empirical findings of (Zins & Weill, Citation2016).
Table 6. Determinants of Saving Motivation
4.3.2. Understanding credit behaviour
We discussed how the different credit motives are associated with individual characteristics of the sample using three loan-taking motivations, which are for medical purposes, for farm or business purposes, and home, apartment, or land purpose as dependent variables. Table explains such relationship between the credit motivations and individual covariates. The first column shows that only education has a significant relationship with taking a loan for medical purposes.
Table 7. Determinants of Loan Taking Motivation
Being female reduces the likelihood of borrowing for farm or business by 5.1%, while it has no significant effect on the other two credit motivations. The result shows that more males than females are requesting loans aimed at easing financial constraints to start or expand businesses. However, we did not found significant gender gaps to loans for medical purposes, and for the purchase of home, apartment or land. Our finding is consistent with the study by (Zins & Weill, Citation2016)
Being educated significantly reduce the likelihood of loan taken for the medical purpose and for farms or businesses by 3.6% and 7.5%, respectively. Being female, older, educated, and poor reduces the likelihood of taking credit for farm or business purposes. Age and income have a significant impact on the probability of taking a loan to purchase a home, apartment, or land. Age is positive and age square is negative for saving motivations of for farm/business purpose and for the purchase of home, apartments or land. The result is appealing because with age, people tend to save more and when too old people become less motivated to save. The wealthiest individuals are more likely to borrow for having assets such as homes, apartments, or land by 4.5%. Age has a non-linear association with all credit motivations, but all other variables have no consistent impact across different motivations. Our findings are consistent with the findings of (Zins & Weill, Citation2016; Dar & Ahmed, Citation2020).
5. Conclusion
In Ethiopia, financial inclusion is at its lowest level compared to sub-Saharan Africa and the World. Since financial inclusion is one pillar of development, through spurring economic growth and reducing poverty, understanding the status and its determinants is paramount. Therefore, this paper examines the relationship between different individual characteristic variables and financial inclusion for 1000 randomly selected individual representative samples from Ethiopia using the new database of the 2017 World Bank Findex database. We summarized the main findings of our study as follows.
First, financial inclusion as measured by formal account ownership, formal saving and formal credit, is low. Only 43.2% of individuals have accounts in the formal accounts and formal credit is less common i.e., only 10% of individuals able to access credit from formal financial institutions, thus people may resort to informal credit sources whenever the need arises. Second, the decision of adults for not having a formal account is mainly voluntary (lack of money and family member has one), albeit involuntary exclusions such as distance and lack of documentations are substantial barriers. We also found that barriers to financial inclusion differ across individual characteristics. For example, while income and age are significantly associated with different obstacles, gender and education have no evidence of association with any of the barriers. While younger adults do not access formal accounts due to involuntary exclusion (distance to the nearest financial access point, affordability, and lack of documentation), older individuals are constrained by voluntary barriers (lack of money). In the same vein, barriers for the richer individuals not to have formal accounts is voluntary, while the poor are mainly constrained by the distance and religious reasons. Our finding revealed that the existing gender gaps in financial inclusion are due to differences in the real sector of the economy such as education and employment than differences in the financial sector. Furthermore, older to a certain extent, richer, educated, and male individuals are more likely to access the financial sector.
Third, our analysis on saving motivations supports a negative association between gender and the two reasons for saving. On the other hand, age to a certain extent, education, and income are positively associated with the motivations for saving. Educated and affluent individuals are likely to save for old age security. When it comes to credit, we observe that only education is associated with loan taking for medical purposes while gender associated with loan taking for for farm/business purposes. Women are less likely to access credit for farm/business purposes. Education and income are strongly associated with loan taking for businesses and homes, apartments, or land. While the more educated individuals are less likely to take loans for farms or businesses purposes, the richest individuals tend to take credit , to construct or purchase fixed assets, respectively. On the other ground, the poor are more motivated to take loans for farm or business purposes.
6. Recommendations and policy implications
Generally, our study attempts to bring public interest to devise policies that could mitigate financial inclusion. In addition, the study identifies financially excluded groups of the population and related barriers for their exclusion.
Based on the finding of the study, we strongly recommend that policies that aim to foster financial inclusion should target the poor, young, less educated, and women population groups because they are the most excluded groups from the financial sector. In Ethiopia, the proportion of youth groups of the population is huge but they are not yet financially included for several reasons. However, with the specialization, and advancement in technologies, the demand for accessible and affordable financial products and payments systems are inevitable. Besides this, distance to financial service points is a significant challenge to the poor, old, and less educated portions of the population. Therefore, policymakers and other stakeholders should design a convenient and less expensive financial products and payment systems to increase the inclusion of the poor and youths particularly those in remote areas. One such means is improving the role of digital financial systems such as mobile and internet banking. Policies should also focus on mitigating the distance, cost, and documentation barriers to financial inclusion. We also recommend the authorities to design policies and programs that improve the participation of females in formal employment, education and income-generating activities because most barriers for gender gaps in financial inclusion rests on differences in the non-financial sector.
Finally, our study is not free from limitations such as the lack of most recent data, and we analyzed only the demand side of financial inclusion. Therefore, we suggest further research to study financial inclusion based on a comprehensive set of indicators i.e., both the demand and supply sides. Since we did not look into the role of informal financial sources whether it complements or substitutes the formal financial system, it would be great if other researchers study on the area.
Disclosure statement
No potential conflict of interest was reported by the author(s).
Additional information
Funding
Notes on contributors
Workineh Ayenew Mossie
Workineh Ayenew Mossie has published many internationally recognized journals and presented his research at both local and international conferences. In addition, he acts as a reviewer for many credible journals. His research interests are financial economics, development economics and microeconometrics. He holds a bachelor’s degree in economics from Haramaya University and an advanced master’s degree in development and international economics from the University of Namur and the University of Catholic Louvain, Belgium.
Notes
1. Based on 1997 CSA, population statistics
2. It is because the database consists a rich set of financial inclusion measures, motivations and barriers that we opted to use the Findex database. Besides this, the data we use are nationally representative and the data collected are through a structured questionnaire homogeneously administered to more than 140 countries worldwide. Thus, the results from the use of this data helps to make international comparisons. Besides, recent financial inclusion literatures (Fungáčová & Weill, Citation2015; Allen et al., Citation2016; Soumaré et al., Citation2016; Zins & Weill, Citation2016; Xu, Citation2020; Amari & Anis, Citation2021) all used this database.
3. Allen et al. (Citation2016) estimated the logit model as a robustness check for the results from the probit model estimation and found a similar estimation coefficients and standard errors from the estimation of both type of models. Asuming et al. (Citation2018) also run Logit regressions as robustness check to the Probit regression and a comparison of the Probit and Logit regressions show that the Marginal effects or goodness-of-fit are similar for both models.
4. Only the un banked Individuals i.e., those who did not have formal accounts were asked about their perceived barriers to financial inclusion. Thus, the sample size is smaller since data on each obstacles are missing for those who already have accounts at financial institutions. As a result, we dropped observations with missing information from the estimation.
References
- Abdu, E., & Adem, M. (2021). Determinants of financial inclusion in Afar Region: evidence from selected woredas. Cogent Economics & Finance, 9(1), 1920149. https://doi.org/10.1080/23322039.2021.1920149
- Abor, J. Y., Amidu, M., & Issahaku, H. (2018). Mobile Telephony, Financial Inclusion and Inclusive Growth. Journal of African Business, 19(3), 430–23. https://doi.org/10.1080/15228916.2017.1419332
- Ajide, F. M. (2020a). Can financial inclusion reduce the presence of corruption? Evidence from selected countries in Africa. International Journal of Social Economics, 47(11), 1345–1362. https://doi.org/10.1108/IJSE-03-2020-0145
- Ajide, F. M. (2020b). Financial inclusion in Africa: Does it promote entrepreneurship? Journal of Financial Economic Policy, 12(4), 687–706. https://doi.org/10.1108/JFEP-08-2019-0159
- Alemu Zewdu, G. (2014). Financial inclusion, regulation and inclusive growth in Ethiopia. In Working paper; Working Paper, Issue November). https://doi.org/10.4324/9781315648668
- Allen, F., Demirguc-Kunt, A., Klapper, L., & Martinez Peria, M. S. (2016). The foundations of financial inclusion: understanding ownership and use of formal accounts. Journal of Financial Intermediation, 27, 1–30. https://doi.org/10.1016/j.jfi.2015.12.003
- Amari, M., & Anis, J. (2021). Exploring the impact of socio-demographic characteristics on financial inclusion: Empirical evidence from Tunisia. International Journal of Social Economics, 48(9), 1331–1346. https://doi.org/10.1108/IJSE-08-2020-0527
- Anarfo, E. B., Abor, J. Y., Osei, K. A., & Gyeke-Dako, A. (2019). Financial inclusion and financial sector development in Sub-Saharan Africa: A panel VAR approach. International Journal of Managerial Finance, 15(4), 444–463. https://doi.org/10.1108/IJMF-07-2018-0205
- Andrés, P., Gimeno, R., & Mateos de Cabo, R. (2020). The gender gap in bank credit access. Journal of Corporate Finance, 101782. https://doi.org/10.1016/j.jcorpfin.2020.101782
- Asuming, P. O., Osei-Agyei, L. G., & Mohammed, J. I. (2019). Financial inclusion in sub-Saharan Africa: Recent trends and determinants. Journal of African Business, 20(1), 112–134. https://doi.org/10.1080/15228916.2018.1484209
- Aterido, R., Beck, T., & Iacovone, L. (2013). Access to Finance in Sub-Saharan Africa: Is There a Gender Gap? World Development, 47, 102–120. https://doi.org/10.1016/j.worlddev.2013.02.013
- Beck, T., & Cull, R. (2015). Banking in Africa. The Oxford Handbook of Banking, 2nd Ed, (October), 913–937. http://www.oxfordhandbooks.com/view/10.1093/oxfordhb/9780199688500.001.0001/oxfordhb-9780199688500-e-037
- Beck, T., & Demirguc-Kunt, A. (2006). Small and medium-size enterprises: Access to finance as a growth constraint.journal of banking and finance. 30(11), 2931–2943 https://doi.org/10.1016/j.jbankfin.2006.05.009
- Beck, T., Demirgüç-Kunt, A., & Levine, R. (2007). Finance, inequality and the poor. Journal of Economic Growth, 12(1), 27–49. https://doi.org/10.1007/s10887-007-9010-6
- Bruhn, M., & Love, I. (2014). The real impact of improved access to finance: evidence from Mexico. Journal of Finance, 69(3), 1347–1376 https://doi.org/10.1111/jofi.12091.
- Chakravarty, S. R., & Pal, R. (2013). Financial inclusion in India: An axiomatic approach. Journal of Policy Modeling, 35(5), 813–837. https://doi.org/10.1016/j.jpolmod.2012.12.007
- Chinoda, T., & Kwenda, F. (2019). Do mobile phones, economic growth, bank competition and stability matter for financial inclusion in Africa? Cogent Economics and Finance, 7(1). https://doi.org/10.1080/23322039.2019.1622180
- Dar, A. B., & Ahmed, F. (2020). Financial inclusion determinants and impediments in India: Insights from the global financial inclusion index. Journal of Financial Economic Policy, 13(3), 391–408. https://doi.org/10.1108/JFEP-11-2019-0227
- Demirguc-Kunt, E. A. (2017). measuring financial inclusion and the fintech revolution. The Global Findex Database. https://doi.org/10.1596/978-1-4648-1259-0
- Demirgüç-Kunt, A., & Klapper, L. (2013). Measuring financial inclusion: Explaining variation in use of financial services across and within countries. Brookings Papers on Economic Activity, 2013(1), 279–321. https://doi.org/10.1353/eca.2013.0002
- Demirguc-Kunt, A., Klapper, L., & Singer, D. (2013). Financial Inclusion and Legal Discrimination Against Women: evidence from developing countries. In Policy research working paper (Vol. 6416).
- Desalegn, G., & Yemataw, G. (2017). Financial Inclusion in Ethiopia: Using LSMS (Ethiopia Socioeconomic Survey) Data. Ethiopian Journal of Economics, 26(2), 31–58.
- Erlando, A., Riyanto, F. D., & Masakazu, S. (2020). Financial inclusion, economic growth, and poverty alleviation: Evidence from eastern Indonesia. Heliyon, 6(10), e05235. https://doi.org/10.1016/j.heliyon.2020.e05235
- European Investment Bank [EIB]. (2020). Banking in Africa: Financing transformation amid uncertainity. In The Oxford Handbook of Banking, 2nd Ed. www.eib.org/economics
- Fungáčová, Z., & Weill, L. (2015). Understanding financial inclusion in China. China Economic Review, 34, 196–206. https://doi.org/10.1016/j.chieco.2014.12.004
- Ghosh, S., & Vinod, D. (2017). What constrains financial inclusion for women? evidence from Indian Micro data. World Development, 92, 60–81. https://doi.org/10.1016/j.worlddev.2016.11.011
- Kappeler, A., Ashiagbor, D., Minsat, A., Deiana, R., & Nguyen-Quoc, T. (2018). Banking in Africa: Delivering on Financial Inclusion, Supporting Financial Stability 2018 (European Investment Bank), https://www.eib.org/attachments/efs/economic_report_banking_africa_2018_en.pdf
- Lewis, S., & Messy, F. (2012). “Financial Education, Savings and Investments: An Overview”, oecd working papers on finance, insurance and private pensions 22 (OECD Publishing) . http://dx.doi.org/10.1787/5k94gxrw760v-en
- Li, L. (2018). Financial inclusion and poverty: The role of relative income. China Economic Review, 52(1), 165–191. https://doi.org/10.1016/j.chieco.2018.07.006
- Mndolwa, F. D., & Alhassan, A. L. (2020). Gender disparities in financial inclusion: Insights from Tanzania. African Development Review, 32(4), 578–590 https://doi.org/10.1111/1467-8268.12462.
- Morgan, P. J., & Long, T. Q. (2020). Financial literacy, financial inclusion, and savings behavior in Laos. Journal of Asian Economics, 68, 101197. https://doi.org/10.1016/j.asieco.2020.101197
- Morsy, H. (2020). Access to finance – Mind the gender gap. Quarterly Review of Economics and Finance, 78 (2020), 12–21 https://doi.org/10.1016/j.qref.2020.02.005.
- National Bank of Ethiopia. (n.d.). Ethiopia: Macroeconomic and Social Indicators.
- Nyantakyi, E., & Sy, M. (2015). The Banking System in Africa: Main Facts and Challenges. African Developement Bank, 6(5), 1–16.
- Oji, C.K. (2015). Promoting Financial Inclusion for Inclusive Growth in Africa, South African Institute of International Affair Occasional Paper, No.210, pp. 1–18.
- Potrich, A. C. G., Vieira, K. M., & Kirch, G. (2015). Determinants of financial literacy: Analysis of the influence of socioeconomic and demographic variables. Revista Contabilidade e Financas, 26(69), 362–377. https://doi.org/10.1590/1808-057x201501040
- Senou, M. M., Ouattara, W., & Acclassato Houensou, D. (2019). Financial inclusion dynamics in WAEMU: Was digital technology the missing piece? Cogent Economics and Finance, 7(1). https://doi.org/10.1080/23322039.2019.1665432
- Soumaré, I., Tchana Tchana, F., & Kengne, T. M. (2016). Analysis of the determinants of financial inclusion in Central and West Africa. Transnational Corporations Review, 8(4), 231–249. https://doi.org/10.1080/19186444.2016.1265763
- Swamy, V. (2014). Financial Inclusion, Gender Dimension, and Economic Impact on Poor Households. World Development, 56, 1–15. https://doi.org/10.1016/j.worlddev.2013.10.019
- Xu, X. (2020). Trust and financial inclusion: A cross-country study. Finance Research Letters, 35, 101310. https://doi.org/10.1016/j.frl.2019.101310
- Zins, A., & Weill, L. (2016). The determinants of financial inclusion in Africa. Review of Development Finance, 6(1), 46–57. https://doi.org/10.1016/j.rdf.2016.05.001
- Zins, A., & Weill, L. (2016). The determinants of financial inclusion in Africa. Review of Development Finance, 6(1), 46–57. https://doi.org/10.1016/j.rdf.2016.05.001
