?Mathematical formulae have been encoded as MathML and are displayed in this HTML version using MathJax in order to improve their display. Uncheck the box to turn MathJax off. This feature requires Javascript. Click on a formula to zoom.
Abstract
The study examines the relationship between the stock market and exchange rate in South Africa for the period from 1980 to 2020. Quarterly data was used employing the Autoregressive Distributed Lag (ARDL) model given the order of integration of the variables. The empirical results revealed that there is a long-term relationship between the variables of interest. The results also revealed that there is a negative relationship between the stock market and exchange rate movement. The results also show that there is a negative relationship between the stock market and the interest rate as well as inflation as measured by CPI. These results imply that innovations in the exchange rate do have an impact on what happens to the stock market. The impact of exchange rates on stock market can be positive in the short run and negative in the long run and so policymakers can use our findings to avoid making unnecessary monetary or fiscal policy decisions. Policy makers may be able to know when to intervene in influencing the markets using monetary or fiscal policies. Investors and portfolio managers can apply the findings of this study to hedge against exchange rate risk, efficiently diversify their portfolios and predict future stock market movements by observing the exchange rate market.
PUBLIC INTEREST STATEMENT
The study focused on looking at how the stock market prices relate to changes in exchange rates. Assets sold on the stock market are generally affected by exchange rates because some buyers and sellers use foreign currency, international investors buy local assets and policy makers use exchange rate to make decisions. We investigated how a unit change in exchange rates cause stock prices to change. Stock prices are used to measure if the market is performing good or bad thus rise or fall, respectively. The Autoregressive Distributed Lag (ARDL) regression model was applied which assumes that the relationship of exchange rates and stock market prices is linear meaning in statistics there is a straight-line relationship between the two variables. Our results found this relationship to be negative and exist after a long time thus when exchange rates rice stock prices fall. Our advice to policy makers is to take caution in policy making on exchange rates as this will affect the stock market.
1. Introduction
The relationship between stock market and the exchange rate is an area which has received attention both at the academic and policy discourse. The available studies on the subject include Odhiambo and Tsaurai (Citation2012), Iscan (Citation2015), Singh et al. (Citation2015), and Sichoongwe (Citation2016) though conclusions are varied. The interest in the stock market has taken center stage due to its importance in enhancing savings in the domestic economy, given their importance when it comes to investment and growth of the economy. The performance of the stock market is measured in various ways. Iscan (Citation2015) and Singh et al. (Citation2015) shows that one of the approaches is to look at the stock prices. Iscan (Citation2015) defines the stock prices as “the present value of firms’ future cash flows which create a link between decisions related to current investment or consumption and future income or interest rate innovations”. On the other hand, the exchange rate is defined as the price of the currency in relation to other countries’ currencies. Ali Raza et al. (Citation2021) stressed that exchange rate policies affect the commodities market and so portfolio managers and investors should monitor exchange rates.
Analysing the relationship between the two variables is of great importance for an open economy such as South Africa, given that any innovations in the world market does influence the exchange rate and this does also impact the performance of the stock market. Given this, the study seeks therefore to analyse the relationship between exchange rate movement and the stock market development in South Africa. Examining the relationship between the stock market and exchange rates is of importance as it affects several important variables in the domestic economy. Dimitrova (Citation2005) suggested that the link between exchange rates and stock prices is of great importance for a number of reasons. This relationship may affect the effectiveness of monetary and fiscal policy. The author suggests that when the stock market is booming a relaxed monetary policy move or a restrictive fiscal policy that target interest rates and the exchange rate may be neutralized. According to Gokmenoglu et al. (Citation2021) previous studies that analysed the relationship between exchange rates markets and the stock market were focused on developed countries but in this study, we are looking at South Africa which is still developing.
In the case of South Africa given that this is an open economy, it is important to note that the rand has been volatile against other currencies. A cursory look at the domestic currency shows that in the early 2000 it stood at 1 US dollar to R7.00. However, in 2020 June it was in the range of R18.00 to one US dollar. This shows the volatility of the currency. Looking at the stock market performance, in the early 2000 the FGTSE/JSE All Share index stood at 9156.64. As of 2008 May the index was 31,796.52, and as of 2009 April it stood at 18,884.74. This trend has continued, and it shows that what is happening to the stock market index somehow does mirror the events taking place in the stock market.
Investors would benefit highly from the knowledge on the level of dependence between exchange rates and stock markets allowing them to efficiently diversify international portfolios. Analysing the relationship between the stock market and exchange rates can assist investors in predicting future stock market movements through analysing the exchange rates market. This may further assist investors in hedging against exchange rate risk and identifying proper hedging tools for their portfolio after understanding the level of exposure on their investments (Gokmenoglu et al., Citation2021; Yousuf & Nilsson, Citation2013). The objective is to provide trends of the development of the stock market and the development in the South African exchange rate system. We aim to use econometric methods to analyse the interaction between the stock market, exchange rate, interest rates and inflation. The current study differs in that it looks at the relationship of these variables and attempts to capture the short and long-run interactions. The hypothesis to be tested is as follows
Ho: Movements in the exchange rate do not influence stock market development in South Africa.
1.1. History of the South African stock market
The Johannesburg Stock exchange (JSE) was established in 1887 following the discovery of gold with the aim of enabling miners and their financiers to raise funds for the development of the mining industry. The market has developed and is at the level of being compared to stock markets of developed countries. As of now there are many non-mining firms listed on the JSE as compared to the mining firms. As illustrated in , the JSE market has developed enormously as measured by market capitalization.
Figure 1. Stock market capitalization as a percentage of GDP (2009 to 2018).Source: Ceicdata (Citation2021)
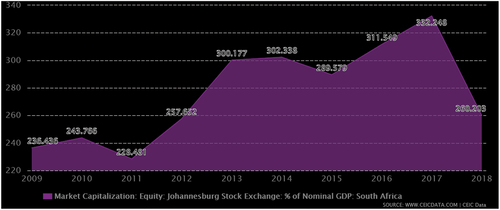
Ceicdata (Citation2021) indicates that “South Africa Market Capitalization accounted for 358.9% of its nominal GDP in Dec 2020, compared with a percentage of 343.5% in the previous year. The data reached an all-time high of 358.9% in Dec 2020 and a record low of 59.2% in Dec 1976”. De Beer et al. (Citation2015) provide a concise description of the development of the Johannesburg stock exchange. They highlight that the development of the JSE can be looked at from the early years which can be categorized into three sub-periods. These are, 1887–1910, 1911–1932 and from 1933 to 1945. Then the period of rapid industrialization and general economic prosperity, which is from 1945 to the 1960s. Then there are the isolation years from 1960 to 1994 and a return to the international arena from 1994 to date.
For the first period, from 1887 to 1910, it was gold mining which dominated the JSE. As indicated earlier, the discovery of gold is what led to the establishment of the stock market in 1887 (De Beer et al., Citation2015). The market was essential to the development of the gold market, which led to the transformation of the South African economy from being an agriculture-based economy into an industrialized economy. De Beer et al. (Citation2015) also point out that the major participants at the time were foreign investors as 60% of the funds invested were from foreign sources. The period from 1911 to 1932 was marked with economic stagnation. This was generally attributed to the World War I (1914 to 1918) and the Great Depression (1929 to 1932). During this period, advances in technology which include the discovery of the electric motor and internal combustion engine resulted in favourable macroeconomic development in countries in Europe and America. These events had a negative effect on the development of the JSE as investors focused on the US and other European countries. During the same period, there were major strikes which also had serious repercussions for the mining industry.
The period from 1933 to 1945 witnessed a gold boom, which resulted in general economic boom. De Beer et al. (Citation2015) point out that towards the end of 1932, there was a decision to abandon the gold standard and also a move towards devaluing the domestic currency. This saw an increase of nearly 50% in the Sterling price of gold, resulting in the gold boom which dominated the JSE at the time (Fourie & Van Zanden, Citation2012). De Beer et al. (Citation2015) highlights that during this period, “Gold production increased as new gold mines were established and the increase in the value of gold exports pulled the economy out of depression with extraordinary speed, starting in 1933. The strong supply of foreign exchange enabled South Africa to accumulate substantial gold reserves and to repay government and private debt.” It is also important to observe that during this period “market capitalization of gold and financial shares rose from 125 million to 350 million due to the rising share prices and the flooding in of foreign investors into the market”.
The period from 1945 to 1960 is regarded as the era of rapid industrialization and economic prosperity. It is during this period that there was discovery of the Orange Free State (OFS) gold fields. It is also important to highlight that during this period South Africa benefited from a huge increase in capital inflow from the developed countries such as Britain. During this period, “the average real economic growth rate between 1945 and 1959 averaged 4.27%.” This trajectory only changed in 1960 after the Sharpeville massacre (De Beer et al., Citation2015). From 1960 to 1994 the country was on international isolation. This began after the Sharpeville shootings in 1960. This has serious effects on the development of the JSE. This was further compounded by the government policy on the exchange rate regime, which further strengthened the isolation. The country was placed on sanctions, which reduced the number of investors who were willing to come and invest on the stock market. This therefore significantly reduced the returns on the market.
De Beer et al. (Citation2015) showed that the period from 1994 saw a massive transformation in the country as a whole. The authors show that “after 1994, the uncertainty of economic policies implemented by a new ANC-led government led to nervousness in the markets. Fear of a new government nationalizing the mines, banks and monopolies was eased when the then president moderated his stance on the political reforms which the country was to implement. The relaxation of exchange controls and the inclusion of the JSE in the International Finance Corporation’s Investable (IFCI) emerging market index paved the way for a dramatic increase in foreign participation on the JSE. The period is also characterized by an increase in the exchange rate and stock market volatility.” This in a way suggest that changes which took place in the exchange rate had an impact as well on the functioning of the stock market. The period from 1997 to 1998 also witnessed an emergency of market crises where there was a massive depreciation of the South African rand against major currencies. This was also accompanied with a massive decrease in prices of shares.
1.2. Performance of the JSE Market
It is also important to observe that the JSE performance mirrors that of other developed countries as indicated in .
Figure 2. SA equity vs US equity and the rest of the World.Source: Businesstech (Citation2019)
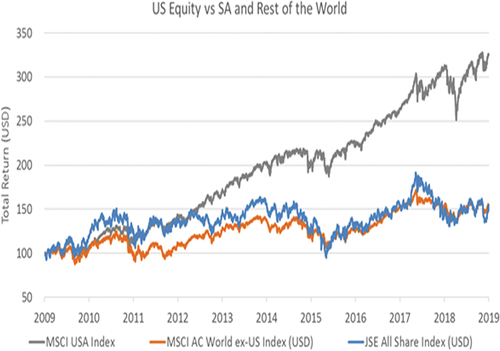
As illustrated in , the US has outperformed the performance of the JSE for the period from 2009 to 2019. However, a closer look shows that the performance of the domestic stock market is in line with those of other countries in the European countries. Singh (Citation2019) shows that “measured in dollar terms, the JSE’s performance over the past decade is virtually indistinguishable from emerging markets and Europe, even though many of those regions experienced a positive economic growth. It is also important to observe that many international companies are still listed on the JSE.
2. Literature review
2.1. Mundell Fleming model
The first theory, which explain the effect of the stock prices on exchange rate, is the Mundell Fleming Model. Mishkin (Citation2001) provides an explanation on the extent to which an increase in stock prices influences exchange rate movement. Mishkin argues that there are different channels through which the two variables are related. A rise in stock prices result in an increase in investment by companies. In this regard, the stock price is regarded as a function of the investment function. Thus:
Thus, an increase in the share price influences investment positively as it results in capital gains. On the other hand, interest rate is negatively related to investment given that it is a cost of borrowing and increases the costs to the company. How stock prices affect the economy is illustrated in Figure .
Figure 3. Effect of an increase in the stock price on the Mundell-Fleming model.Source: Dimitrova (Citation2005)
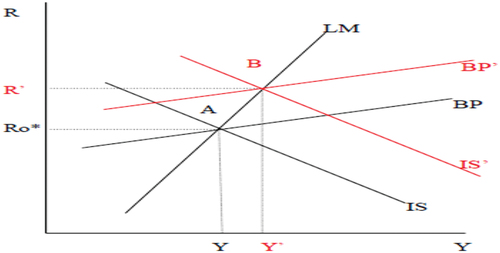
The BP schedule captures equilibrium in the foreign exchange market. The IS captures equilibrium in the goods market and the LM equilibrium in the money market. Figure shows that when stock prices go up, this will result in investment and consumption increasing as illustrated earlier. This will result in the IS curve shifting upwards since consumption and investment falls in the goods market. The shift of the IS curve results in the BP schedule shifting upwards and the new equilibrium will be at point B. At point B income (Y) is at a higher level as well as the interest rate. The higher level of interest rate will attract more capital flows which will result in the domestic currency appreciating. This therefore shows that the effect runs from stock prices to exchange rate. Also, the theory suggests that the link between the exchange rate and the stock prices is dependent on the interest rate.
2.2. Portfolio balance theory
The second theory, which suggests that the effect runs from the stock prices to the exchange rate, is the Portfolio Balance theory. According to Phylaktis and Ravazzolo (Citation2005), the Portfolio balance theories indicate that activities in the capital account determine the exchange rate. The theory indicates that when stock prices increase, this will attract foreign investors into the domestic market. The arrival of foreign investors will result in huge influx of capital inflows. Given that foreign investors change their foreign currency into the domestic currency, there will be a huge demand for money. The huge demand for money might be inflationary, which can prompt the intervention of monetary authorities through increasing the interest rate, which can further result in more funds flowing into the country. On the other hand, when stock prices decrease, this may diminish corporate wealth and hence the country’s wealth Phylaktis and Ravazzolo (Citation2005). The theory therefore emphasise that the effect runs from stock prices to exchange rate. Again, the theory highlights that the link between the variables is dependent on what happens to the interest rate.
2.3. The traditional economic theory
The Traditional economic theory suggests that either a depreciation or appreciation of the currency may cause a company to have a profit or loss in its books of accounts, which ultimately affects its share price. According to this theory, currency depreciation result in higher exports and hence an increase in company profits which will ultimately attract investors resulting in the share price increasing.
2.4. Arbitrage pricing theory
Ross (Citation1978) proposed the Arbitrage Pricing Theory (APT). According to this theory, the performance of a share price is dependent on a number of economic variables, which influences the discount rate and future dividends. The theory suggests that individuals prefer portfolios of investment with specific systemic risk, which are different. So according to this theory, events which affect the exchange rate have a potential of affecting the stock prices.
2.5. Flow-Oriented model
One of the theories which is popularized to explain the link between the exchange rate and the stock price is the Dornbusch and Fisher (Citation1980)’ Flow-Oriented model. The model suggests that it is the exchange rate that affects the stock prices. In line with the APT model discussed earlier, the Flow-Oriented model indicates that factors that reduce the cash-flow of the firm, holding everything constant, will result in a decrease in the stock prices of the company, or vice-versa.
2.6. Empirical literature review
The available literature on the link between the two variables includes studies, which have been carried out at cross-country level and country-specific. The study by Luqman and Koser (Citation2018) suggests that how the two variables relate can be influenced by the nature of the methodology used. The studies, which have employed the Johansen cointegration test, Engle and Granger cointegration test and Granger causality test, assumed a linear relationship between the variables. The studies which fall in this category include Yau and Nieh (Citation2006), Alagidede et al. (Citation2011), Tsai (Citation2012), and Lin (Citation2012). The results from these studies present mixed findings.
The studies which have assumed a linear relationship includes Granger et al. (Citation2000), these studies include Bahmani-Oskooee and Sohrabian (Citation1992), Nieh and Lee (Citation2001), Smyth and Nandha (Citation2003), Lean et al. (Citation2005), Pan et al. (Citation2007), Richards et al. (Citation2007), Rahman and Uddin (Citation2009), and Kutty (Citation2010), Zhao (Citation2010), Tian and Ma (Citation2010), Parsva and Lean (Citation2011), Basher et al. (Citation2012), and Nieh and Lee (Citation2001) also carried out another study utilising daily data for the G-7 countries from 1 October 1993 to 15 February 1996. The authors utilised both the Engle-Granger method and the Johnsen cointegration technique. The empirical results revealed that there was no evidence of cointegration between the exchange rate and the stock prices. However, short-run relationships were established. This suggests that the relationship between the two variables may exist in the short run.
On another study on the East Asian countries, Lean et al. (Citation2005) examined the relationship between the exchange rate and the stock market utilising weekly data from January 1991 to December 2002. The authors examined the relationship between two variables, before, during and after the Asian Financial crisis and the impact of the 9/11 terrorist attacks. Cointegration and Granger causality tests were employed again. With the exception of the Philippines and Thailand, the results revealed that there was no evidence of cointegration. However, during the crisis, a weaker evidence of cointegration was found. These results suggest that the relationship between the variables maybe influenced by other factors apart from the two variables. The results of Lean et al. (Citation2005) were found to be similar to Pan et al. (Citation2007).
Employing monthly data, Rahman and Uddin (Citation2009) explored the relationship between the two variables for the period from January 2003 to June 2008 for three Asian countries. The authors utilised the Johansen cointegration technique and the Granger causality tests. The empirical results revealed that for all the three countries, Bangladesh, India and Pakistan, there was no evidence of any relationship between the variables be it in the short-run or long-run. These results imply that economic agents cannot utilise the link between these variables to forecast the performance of the stock market.
It is interesting to note that the majority of the studies reviewed have largely employed the measures of stock market and exchange rate variables only. There are a host of other studies which have utilised more than two variables. These include Tian and Ma (Citation2010). These authors analysed the relationship between the two variables and included several macroeconomic variables in their analysis employing the ARDL model and Granger causality. The empirical results revealed that prior to liberalising the financial sector, there was no relationship between the two variables. However, after liberalisation there was a long-term relationship between the two variables. Several macroeconomic variables were also found to Granger cause the stock market.
The other study is that of Parsva and Lean (Citation2011). The authors analysed the link between the two variables and also included several macroeconomic variables. The results revealed that there was evidence of a one-way causal relationship between the variables in Kuwait. On the other hand, a bi-directional causal relationship was stabled for Egypt, Iran and Oman. Again, macroeconomic variables were found to influence the link between the two variables, suggesting that the extent to which the two variables interact is dependent on other macroeconomic variables. In the case of South Africa, the available country-specific studies (Ocran Citation2010; Mlambo et al. (Citation2013) Fowowe (Citation2015)) have assumed a linear relationship between the variables.
3. Methodology
3.1. Model specification
The literature section highlighted that the relationship between the stock market development and the exchange rate runs both ways. The portfolio balance model suggests that the effect runs from the stock market to exchange rate. In other words, innovations in the stock market affect the exchange rate. On the other hand, the Flow oriented model indicates that it is the exchange rate that affects the stock market. Thus, according to these two frameworks, the relationship runs in both ways. However, given studies such as Khalid and Khan (Citation2017) and Khan and Khan (Citation2018) as well as Luqman and Kouser (Citation2018) indicate that as much as the stock market may influence the exchange rate, it is the exchange rate which is more pronounced together with a host of other macroeconomic variables. Based on the three studies mentioned (Khalid and Khan Citation2017; Khan & Khan, Citation2018; Luqman & Kouser, Citation2018), the following model will be used to analyse the relationship between the variables of interest:
The empirical model to be estimated is as follows:
where LSP is the stock market index and LEX is the exchange rate, CPI is the Consumer Price Index, measuring inflation and IR is the interest rate.
3.2. Data
Quarterly data for a period of 20 years (1980 to 2020) from South Africa were collected from the SARB database, the JSE database and Quantec Easy database. The use of quarterly data is due to availability of data as the databases mostly publishes in this format. Quarterly data is a form of high-frequency information which helps in understanding trends and relationships more deeply. High-frequency data improve the accuracy of the estimation as it increases the sample data since in regression analysis having many observations reduces sample noise. The variables to be used in the study are the JSE All share Index representing the stock market index and the rand/dollar exchange rate. The JSE All share Index represents 150 companies listed on the JSE. Also, it is the largest when looking at value and size.
The exchange rate will be measured by the US dollar/rand exchange rate. The dollar is a hard currency which affects all economies. The variables have been used by several prior studies such as Adjasi and Yartey (Citation2007), Ocran (2011). The effect of the exchange rate on stock market performance according to Dimitrova (Citation2005) is mixed. There are several studies such as Muhammad and Rasheed (Citation2002), Hasan and Nasir (Citation2008), and Diamandis and Drakos (Citation2011) which suggest that the relationship between the stock market and exchange rate is positive. The positive relationship arises in that a depreciation of the exchange rate results in an increase in exports, which will thus result in stock prices increasing. This applies mostly to export oriented firms.
On the other hand, the relationship between the stock market and exchange rate maybe negative. This is supported by studies such as Erdem et al. (Citation2005), Pal and Mittal (Citation2011), and Bekhet and Mugableh (Citation2012). These studies argue that when there is a depreciation of the currency, the goods which are exported from the country will be more competitive, resulting in more cash inflow into the country. However, deprecation of the currency makes imports more expensive. Thus, if a country relies more on exports for its factors of production, the net effect of an exchange rate depreciation will be negative on the economy.
Regarding the effect of inflation on the stock market performance, studies such as Sohail and Hussain (Citation2009), Bekhet and Mugableh (Citation2012) indicate that high levels of inflation may negatively affect the stock market as it is a source of instability or uncertainty in the market. When there is uncertainty in the market, people may opt for the stock market as a safe haven, this may result in high demand of the minimum returns which may reduce the market valuation of the stock market. Khan and Khan (Citation2018) also indicate that the available studies have highlighted that the measure of inflation use is another determining factor. Tiwari et al. (Citation2015) argues that there is no significant relationship between inflation and the stock market. Rjoub et al. (Citation2009) on the other hand argues that the stock market being viewed as a safe haven in itself suggest that the relationship is positive. Thus, the relationship between the two variables will be empirically determined.
3.3. The Autoregressive Distributed Lag Model Cointegration test
The study utilised the Autoregressive Distributed Lag model (ARDL), however prior to run the tests, the data was subjected to both formal and informal tests so as to determine the time-series properties of the data. Studies such as Khan and Khan (Citation2018), Takawira and Motseta (Citation2021), Motseta and Takawira (Citation2021), Raza and Jawaid (Citation2014), Bouri et al. (Citation2018), and Luqman and Kouser (Citation2018) highlight that with the ARDL model, stationarity is not a necessary requirement. The tests were conducted so as to ensure that there is no I(2) variables.
The study utilised the Autoregressive Distributed Lag Model (ARDL) in the empirical investigation. This approach is also referred to as the bounds cointegration technique which was originally developed by Pesaran and Pesaran (Citation1997). There are several developments which were done to the model by Pesaran and Shin (Citation1999) and Pesaran et al., Citation2001. The test was utilised to analyse the long-term relationship between the stock market and exchange rate, in addition to other macroeconomic variables.
There are several advantages of this technique as compared to other techniques for cointegration test. Firstly, the technique best performs even in small samples. This is different from the Johansen cointegration which requires a larger sample (Khan & Khan, Citation2018). The technique is compatible with data which is integrated of different orders, unlike the Johansen cointegration test and the Engle Granger which requires that the data be integrated of order 1, I(1). The data used in the study are integrated of order 0 and 1, this makes the ARDL model relevant to check the long-term relationship between the variables. Nkoro and Uko (Citation2016) also indicate that this model is free from the problem of endogeneity given that each variable in the model appear as an individual equation. Khan and Khan (Citation2018) also highlight that one of the features of the ARDL technique is “its pure identification of the cointegration vectors among the multiple cointegrating vectors. Also, the technique supposes that only a single reduced-form equation relationship exists between the explained and the exogenous variable”.
The general form of the ARDL model as per Pesaran and Pesaran (Citation1997) is given as follows:
In model 4, has lags of both the dependent and independent variables. The conventional Error Correction Model (ECM) is given as follows:
In Equationequation 5(5)
(5) , Z is the error correction term which connects both the long-run and short-run model.
The unrestricted ARDL model of the study is given by Equationequation 6(6)
(6) as follows:
The null hypothesis to be tested in this case is:
The alternative hypothesis of cointegration is given by:
The test involves computing the F-statistic which is compared against the lower bound and upper bound to determine if there is cointegration. In the event that the calculated F-statistic is greater than the upper bound value that will be an indication of the presence of cointegration. However, if the F-statistic is below the lower bound, that will be an indication that there is no cointegration. Khan and Khan (Citation2018) state that if the values fall between the two bounds, lower and upper, the result will be inconclusive. The presence will be determined by the significance of the ECM term. The ECM term to be estimated in the model is of the form:
Masih and Masih (Citation1997) suggest that the presence of the ECM term in the model shows the variations in the explained variable in both the short-run and long-run model. Khan and Khan (Citation2018) further explain that this “demonstrates the magnitude to which any variability in the preceding time is being adjusted in dependent variable. Its positive coefficient points out a divergence whereas, a negative value of the coefficient signifies convergence”. The close the coefficient of the ECM to one it is, the higher the level of convergence in the face of disequilibrium. On the other hand, the lower or close to zero, the lower the level of convergence.
4. Empirical results
4.1. Descriptive statistics
The descriptive statistics are presented in Table .
Table 1. Descriptive statistics
Table shows that the mean value of the JSE is 9.270 and is positive, with a maximum value of 10.99 and a minimum point of 6.776. This shows that the JSE’s performance is generally on the positive territory. The variable is also normally distributed. The mean of the exchange rate is 4.7437 with a minimum value of 4.366 and a maximum value of 14.93. This in a way indicates that the rand dollar exchange rate for the period under study ranges between the two values. Also, the variable is normally distributed. The means of CPI and interest rate are positive with maximum values of 20 and 25.50, respectively. The variables are also normally distributed. The diagnostic tests and unit root tests results are shown in the appendix section.
4.2. Lag length selection criteria
Having established the order of integration of the data, the next step was to determine the lag length to be utilised in the study.
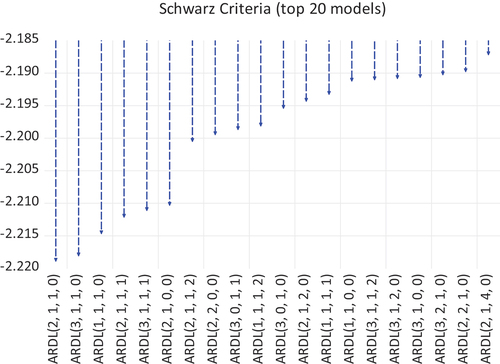
Figure shows that there are 20 models which were estimated based on the Schwarz information criterion. ARDL (2,1,1,0) was thus chosen as the ideal model. This was the lag utilised in estimating the long-run model.
Figure 4. Lag length selection criteria.Source: By Author
4.3. ARDL Bounds cointegration test results
The ARDL model was estimated based on the lag length chosen in the previous section. The results are presented in Table .
Table 2. ARDL bounds cointegration test results
Table shows that the calculated F-statistic and its associated critical values at 10%, 5% and 1%. The calculated F-statistic is 7.1202 which is above the upper bound, I(1) and is greater than the critical values at all levels of significance. Thus, the null hypothesis of no cointegration is rejected. This is a way suggest that there is a long-term relationship between the stock market, the exchange rate, inflation as measured by CPI and interest rate. These results are consistent with Fowowe (Citation2015). The findings are not consistent with Ocran (Citation2007) who did not find the presence of cointegration based on the Johansen cointegration for South Africa. The results thus confirm that there is a long-term relationship between the variables of interest. The long-term relationship between the variables is reported in Table .
Table 3. Long-run linear ARDL model estimates
The empirical results as presented in Table show that the coefficient of the rand/dollar exchange rate is negative and significant at 5% level of significance. This result is consistent with Erdem et al. (Citation2005), Olowe (Citation2007), Bekhet and Mugableh (Citation2012). According to these authors, the negative relationship is more prominent for countries which rely most on imports. Thus, currency depreciation makes imported goods to be costly. Thus, for a country such as South Africa, where exports play a crucial role in the production process, the next effect on the stock market is negative.
The results also show that there is a negative relationship between the stock market and the interest rate. Khan and Khan (Citation2018) suggest that “when interest rates increase, investors will opt for bonds which may result in the stock prices falling”. Hasan and Nasir (Citation2008) on the other hand highlights that “an interest rate increase result in the increase of the discount rate which means an ultimate decrease in present value of the future cash flows”. This in a way imply a negative relationship between the two variables. The results are consistent with the findings of Paul and Mallik (Citation2003), McMillan (Citation2005), and Peiro (Citation2015).
The empirical results also revealed that there is a negative relationship between the stock market and inflation as measured by CPI. In this regard, an increase in inflation indicates macroeconomic instability, which may send a wrong signal to potential investors, resulting in them exiting the market. The result is also supported by various authors such as Sohail and Hussain (Citation2009) and Khan and Khan (Citation2018). This result does not corroborate the finding of Rjoub et al. (Citation2009) who suggested that the stock market is used as a hedge against inflation.
The short-run results are presented on Table . The results show that in the short run, all variables have a positive effect on the stock market activities in South Africa though CPI is insignificant. This result may imply that in the short-run, higher inflation values may not affect the stock market negatively. However, in the long run the effect becomes different. The results also show that the ECT term is negative and highly significant. This therefore means in the event of disequilibrium, about 54% of the deviation is corrected within a month. This shows the volatility of the stock market in a way.
Table 4. Short-run model estimates
5. Conclusion
The long-run results indicate that there is a negative relationship between the stock market performance and the exchange rate. This result is found to be consistent with a number of empirical studies (Erdem et al., Citation2005, Olowe Citation2007; Bekhet & Mugableh, Citation2012). The empirical results also revealed that there is a negative relationship between the stock market and inflation and also the stock market and interest rate. In this regard, companies which rely more on imports tend to benefit more when there is a currency appreciation. At the same time, companies which are export oriented tend to benefit more when there is currency depreciation. It is also important to note that even those companies which are not so much involved in international activities they can still be affected by exchange rate movement given that raw materials such as oil are affected by the movement of the exchange rate. All these factors have a bearing on the profitability of companies as well as their stock prices, which ultimately influences the stock market performance.
It is difficult for policy makers to find the appropriate monetary or fiscal policy given the unique relationship between exchange rates and stock markets in the short and long run. As shown in this study that the impact of exchange rates on stock market can be positive in the short run and negative in the long run and so the results of this study can be utilised by policymakers to avoid making unnecessary monetary or fiscal policy decisions. Using the knowledge obtained from this study policy makers maybe able to know when to intervene in influencing the markets using monetary or fiscal policies. Investors and portfolio managers can apply the findings of this study to hedge against exchange rate risk, efficiently diversify their portfolios and predicting future stock market movements.
One of our limitations was time constraint as we could not have enough time to consider other macroeconomic variables in our study. Moreover, the analysis tested the relationship of the variables using stock market as the response variable and exchange rate as the explanatory variable showing the volatility effect being transmitted from the exchange rate market to the stock exchange market which can be vice versa. Future studies should analyse the relationship between exchange rates using models like the quantile ARDL (QARDL) and the non-linear ARDL (NARDL). Further studies can also incorporate variables like inflation targeting, growth targeting, global financial crisis and pandemics like Covid-19 to see if these affect the relationship between exchange rates and stock markets.
Disclosure statement
No potential conflict of interest was reported by the author(s).
Additional information
Funding
Notes on contributors

Oliver Takawira
Oliver Takawira is a Lecturer at the University of Johannesburg in the Department of Finance and Investment Management (DFIM) under SOM in the CBE.
Oliver has a master’s degree in Development Finance (MdevF) from Stellenbosch University Business School (USB), holds bachelor’s degree from the University of Zimbabwe and currently studying towards a PhD in Economics.
Mr Takawira is a Chartered Development Finance Analyst (CDFA – CIDEF) and is a Member of Chartered Institute for Securities & Investment (MCSI – UK). An external examiner of master’s degree dissertations for various universities.
He has published articles in accredited high impact journals, presented at various international conferences, secured funding from the South African Reserve bank (SARB) and the BANKSETA South Africa and reviewed articles in various journals. Oliver is an active academic researcher and interested in areas concerning Financial Economics.
Oliver Takawira enjoys reading financial, economic and business articles, journals, books and playing chess.
References
- Adjasi, C. K., & Yartey, C. A. (2007). Stock market development in Sub-Saharan Africa; critical issues and challenges, IMF Working Papers 07/209, International Monetary Fund.
- Alagidede, P., Panagiotidis, T., & Zhang, X. (2011). Causal relationship between stock prices and exchange rates. Journal of International Trade and Economic Development, 20(1), 67–20. https://doi.org/10.1080/09638199.2011.538186
- Ali Raza, S., Shah, N., Ali, M., & Shahbaz, M. (2021). Do exchange rates fluctuations influence gold price in G7 countries? New insights from a nonparametric causality-in-quantiles test. Zagreb International Review of Economics & Business, 24(2), 37–57. https://doi.org/10.2478/zireb-2021-0010
- Bahmani-Oskooee, M., & Sohrabian, A. (1992). Stock prices and the effective exchange rate of the dollar. Applied Economics, 24(4), 459–464. https://doi.org/10.1080/00036849200000020
- Basher, S. A., Haug, A. A., & Sadorsky, P. (2012). Oil prices, exchange rates and emerging stock markets. Energy Economics, 34(1), 227–240. https://doi.org/10.1016/j.eneco.2011.10.005
- Bekhet, H. A., & Mugableh, M. I. (2012). Investigating equilibrium relationship between macroeconomic variables and Malaysian stock market index through bounds tests approach. International Journal of Economics and Finance, 4(10), 69–81. https://doi.org/10.5539/ijef.v4n10p69
- Bouri, E., Gupta, R., Lahiani, A., & Shahbaz, M. (2018). Testing for asymmetric nonlinear short-and long-run relationships between bitcoin, aggregate commodity and gold prices. Resources Policy, 57(1), 224–235. https://doi.org/10.1016/j.resourpol.2018.03.008
- Businesstech. (2019). How South African stocks compare to the rest of the world, [online], Available on < Accessed 28 August 2021. https://businesstech.co.za/news/finance/345378/how-south-african-stocks-compare-to-the-rest-of-the-world/>
- Ceicdata. (2021). CEIC Economy < https://www.ceicdata.com/en/indicator/real-gdp-growth>, Accessed on 10 August 2021
- de Beer, J., Keyser, N., & van der Merwe, I. (2015). The Johannesburg stock exchange (JSE) returns, political development and economic forces: A Historical perspective. Journal for Contemporary History, 40(2), 1–24. https://hdl.handle.net/10520/EJC182090
- Diamandis, P. F., & Drakos, A. A. (2011). Financial liberalization, exchange rates and stock prices: Exogenous shocks in four Latin America countries. Journal of Policy Modeling, 33(3), 381–394. https://doi.org/10.1016/j.jpolmod.2010.11.004
- Dimitrova, D. (2005). The relationship between exchange rates and stock prices: Studied in a multivariate model”. The College of Wooster, Issues in Political Economy, Vol. 14, August 2005. [Online] Accessed on 14 March 2020. http//org.elon.edu/ipe/Dimitrova
- Dornbusch, R., & Fisher, S. (1980). Exchange rates and the current account. American Economic Review, vol. 70. [Online]. Available on Accessed on 18 March 2014. http//links.jstor.org/sici
- Erdem, C., Arslan, C. K., & Erdem, M. S. (2005). Effects of macroeconomic variables on Istanbul stock exchange indexes. Applied Financial Economics, 15(14), 987–994. https://doi.org/10.1080/09603100500120365
- Fourie, J., & Van Zanden, J. L. (2012). GDP in the Dutch Cape Colony: The national accounts of a slave based society. Global Centre for Economic History Working Paper, Utrecht University.
- Fowowe, B. (2015). The relationship between stock prices and exchange rates in South Africa and Nigeria: Structural breaks analysis. International Journal of Applied Economics, 29(1), 1–14. https://doi.org/10.1080/02692171.2014.933786
- Gokmenoglu, K., Eren, B. M., & Hesami, S. (2021). Exchange rates and stock markets in emerging economies: New evidence using the Quantile-on-Quantile approach. Quantitative Finance and Economics, 5(1), 94–110. https://doi.org/10.3934/QFE.2021005
- Granger, C. W., Huangb, B.-N., & Yang, C.-W. (2000). A bivariate causality between stock prices and exchange rates: Evidence from recent Asian flu. The Quarterly Review of Economics and Finance, 40(3), 337–354. https://doi.org/10.1016/S1062-9769(00)00042-9
- Hasan, A., & Nasir, Z. M. (2008). Macroeconomic factors and equity prices: An empirical investigation by using ARDL approach. The Pakistan Development Review, 47(4), 501–551. https://doi.org/10.30541/v47i4IIpp.501-513
- Iscan, E. (2015). The Relationship between commodity prices and stock prices: Evidence from Turkey. International Journal of Economics and Finance Studies, 7(2), 17–26. https://dergipark.org.tr/en/pub/ijefs/issue/26147/275354
- Khalid, W., & Khan, S. (2017). Effects of macroeconomic variables on the stock market volatility: The Pakistan experience. Global Journal of Management and Business Research.
- Khan, J., & Khan, I. (2018). The impact of macroeconomic variables on stock prices: A case study of Karachi stock exchange. Journal of Economics and Sustainable Development, 9(13), 15-25.
- Kutty, G. (2010). The Relationship between exchange rates and stock prices: The case of Mexico. North American Journal of Finance and Banking Research, 4(4), 1–12.
- Lean, -H.-H., Halim, M., & Wong, W.-K. (2005). Bivariate causality between exchange rates and stock prices on major Asian countries. Monash University.
- Lin, C. H. (2012). The comovement between exchange rate and stock prices in Asian emerging markets. International Review of Economics and Finance, 22(1), 161–172. https://doi.org/10.1016/j.iref.2011.09.006
- Luqman, R., & Kouser, R. (2018, August). Asymmetrical linkages between foreign exchange and stock markets: Empirical evidence through linear and non-linear ARDL. Journal of Risk and Financial Management, MDPI, Open Access Journal, 11(3), 1–13. https://doi.org/10.3390/jrfm11030051
- Luqman, R., & Koser, R. (2018). Asymmetrical linkages between foreign exchange and stock markets: Empirical evidence through linear and non-linear ARDL. Journal of Risk Financial Management, 6(3), 51. https://doi.org/10.3390/jrfm11030051
- Masih, A. M., & Masih, R. (1997). A comparative analysis of the propagation of stock market fluctuations in alternative models of dynamic causal linkages. Applied Financial Economics, 7(1), 59–74.
- McMillan, D. (2005). Time variation in the cointegrating relationship between stock prices and economic activity. International Review of Applied Economics, 19(3), 359–368. https://doi.org/10.1080/02692170500119862
- Mishkin, F. S. (2001). The transmission mechanism and the role of asset prices in monetary policy. NBER Working Paper No 8617.
- Mlambo, C., Maredza, A., & Sibanda, K. (2013). Effects of exchange rate volatility on the stock market: A case study of South Africa. Mediterranean Journal of Social Sciences, 4(14), 561–570. https://doi.org/10.5901/mjss.2013.v4n14p561
- Motseta, S. D., & Takawira, O. (2021). An analysis of sovereign credit ratings impact on financial development in South Africa. Journal of Accounting and Finance in Emerging Economies, 7(3), 553–571. https://doi.org/10.26710/jafee.v7i3.1804
- Muhammad, N., & Rasheed, A. (2002). Stock prices and exchange rates: Are they related? Evidence from South Asian countries. The Pakistan Development Review, 41(4), 535–550. https://doi.org/10.30541/v41i4IIpp.535-550
- Nieh, -C.-C., & Lee, C.-F. (2001). Dynamic relationship between stock prices and exchange rates for G-7 countries. The Quarterly Review of Economics and Finance, 41(4), 477–490. https://doi.org/10.1016/S1062-9769(01)00085-0
- Nkoro, E., & Uko, A. K. (2016). Autoregressive Distributed Lag (ARDL) cointegration technique: Application and interpretation. Journal of Statistical and Econometric Methods, 5(4), 78.
- Ocran, M. K. (2007). Interrelationships between South Africa and United States stock prices and the rand/dollar exchange rate. [Online]. Available on: http://www.essa.org.za/download/2007conference/Ocran_interrelationships.pdf. Accessed 03 April 2014
- Ocran, M. K. (2010). South Africa and United States stock prices and the Rand/Dollar exchange rate. South African Journal of Economic and Management Sciences, 13(3), 362–375.
- Odhiambo, N., & Tsaurai, K. (2012). Stock market development foreign capital inflows and economic growth in Zimbabwe: A multivariate causality test. Corp Ownersh Control, 9(2), 313–322. https://doi.org/10.22495/cocv9i2c3art1
- Olowe, R. A. (2007). The relationship between stock prices and macroeconomic factors in the Nigerian stock market. African Review of Money Finance and Banking, 79–98.
- Pal, K., & Mittal, R. (2011). Impact of macroeconomic indicators on Indian capital markets. The Journal of Risk Finance, 12(2), 84–97. https://doi.org/10.1108/15265941111112811
- Pan, M.-S., Fok, R. C.-W., & Liu, Y. A. (2007). Dynamic linkages between exchange rates and stock prices: Evidence from East Asian markets. International Review of Economics & Finance, 16(4), 503–520. https://doi.org/10.1016/j.iref.2005.09.003
- Parsva, P., & Lean, H. H. (2011). The analysis of relationship between stock prices and exchange rates: Evidence from six Middle Eastern financial markets. International Research Journal of Finance and Economics, 66(5), 157–171. https://www.researchgate.net/profile/Parham-Parsva/publication/288753074_The_analysis_of_relationship_between_stock_prices_and_exchange_rates_Evidence_from_six_middle_eastern_financial_markets/links/5ef50fa9a6fdcc4ca430fc84/The-analysis-of-relationship-between-stock-prices-and-exchange-rates-Evidence-from-six-middle-eastern-financial-markets.pdf
- Paul, S., & Mallik, G. (2003). Macroeconomic factors and bank and finance stock prices: The Australian experience. Economic Analysis and Policy, 33(1), 23–30. https://doi.org/10.1016/S0313-5926(03)50002-9
- Peiro, A. (2015). Stock prices and macroeconomic factors: Some European evidence. International Review of Economics and Finance.
- Pesaran, M. H., & Pesaran, B. (1997). Working with Microfit 4.0: Interactive Econometric Analysis. Oxford University Press.
- Pesaran, M. H., & Shin, Y. (1999). An autoregressive distributed lag modelling approach to cointegration analysis. In S. Strom (Ed.), Econometrics and economic theory in the 20th Century: The Ragnar Frisch Centennial Symposium. Cambridge University Press. pp. 2.
- Pesaran, M. H., Shin, Y., & Smith, R. J. (2001). Bounds testing approaches to the analysis of level relationships. Journal of Applied Econometrics, 16(3), 289–326. https://doi.org/10.1002/jae.616
- Phiri, A. (2018) Structural changes in exchange rate-stock returns dynamics in South Africa: Examining the role of crisis and new trading platform. Economic Change and Restructuring, 53(1), 171-193.
- Phylaktis, K., & Ravazzolo, F. (2005). Stock prices and exchange rate dynamics. Journal of International Money and Finance, 24(7), 1031–1053. https://doi.org/10.1016/j.jimonfin.2005.08.001
- Rahman, M. L., & Uddin, J. (2009). Dynamic relationship between stock prices and exchange rates: Evidence from three South Asian countries. International Business Research, 2(2), 167–174. https://doi.org/10.5539/ibr.v2n2p167
- Raza, S. A., & Jawaid, S. T. (2014). Foreign capital inflows, economic growth and stock market capitalization in Asian countries: An ARDL bound testing approach. Quality & Quantity, 48(1), 375–385. https://doi.org/10.1007/s11135-012-9774-4
- Richards, N., Simpson, J., & Evans, J. (2007). The interaction between exchange rates and stock prices: An Australian context. International Journal of Economics and Finance, 1(1), 3–23. https://espace.curtin.edu.au/bitstream/handle/20.500.11937/13668/20108_downloaded_stream_96.pdf?sequence=2&isAllowed=y
- Rjoub, H., Tursoy, T., & Gunsel, N. (2009). The effects of macroeconomic factors on stock returns: Istanbul stock market. Studies in Economics and Finance, 26(1), 36–45. https://doi.org/10.1108/10867370910946315
- Ross, S. A. (1978). The current status of the capital asset pricing model (CAPM). The Journal of Finance, 33(3), 885–901.
- Sichoongwe, K. (2016). Effects of exchange rate volatility on the stock market: The Zambian experience. Journal of Economics and Sustainable Development, 7(4), 114–119. https://www.rmb.co.za/news/south-african-rand-what-is-the-possible-new-normal
- Singh, T., Gupta, M., & Sharma, M. (2015). Stock market liquidity and firm performance. Accounting, 1(1), 29–36. https://doi.org/10.5267/j.ac.2015.11.003
- Singh, H. (2019). 'Show me the money’: a discussion of the cryptocurrency market and its potential regulation in South Africa (Doctoral dissertation).
- Smyth, R., & Nandha, M. (2003). Bivariate causality between exchange rates and stock prices in South Asia. Applied Economics Letters, 10(11), 699–704. https://doi.org/10.1080/1350485032000133282
- Sohail, N., & Hussain, Z. (2009). Long-run and short-run relationship between macroeconomic variables and stock prices in Pakistan: The case of Lahore stock exchange. Pakistan Economic and Social Review, 47(2), 183–198. https://media.teckiz.com/pakistan-economic-and-social-review/pesc-eco-pu/2021/04/28/608902105b48b.pdf
- Takawira, O., & Motseta, S. D. (2021). The relationship between sovereign credit ratings and capital flows: A case of South Africa. International Journal of Economics and Finance Studies, 13(1), 251–276. https://doi.org/10.34109/ijefs.202112234
- Tian, G. G., & Ma, S. (2010). The relationship between stock returns and the foreign exchange rate: The ARDL approach. Journal of the Asia Pacific Economy, 15(4), 490–508. https://doi.org/10.1080/13547860.2010.516171
- Tiwari, A. K., Dar, A. B., Bhanja, N., Arouri, M., & Teulon, F. (2015). Stock returns and inflation in Pakistan. Economic Modelling, 47(1), 23–31. https://doi.org/10.1016/j.econmod.2014.12.043
- Tsai, I.-C. (2012). The relationship between stock price index and exchange rate in Asian markets: A quantile regression approach. Journal of International Financial Markets, Institutions and Money, 22(3), 609–621. https://doi.org/10.1016/j.intfin.2012.04.005
- Yau, H.-Y., & Nieh, C.-C. (2006). Interrelationships among stock prices of Taiwan and Japan and NTD/Yen exchange rate. Journal of Asian Economics, 17(3), 535–552. https://doi.org/10.1016/j.asieco.2006.04.006
- Yousuf, A., & Nilsson, F. (2013). Impact of exchange rates on Swedish stock performances: Empirical study on USD and EUR exchange rates on the Swedish stock market. Spring 2013.
- Zhao, H. (2010). Dynamic relationship between exchange rate and stock price: Evidence from China. Research in International Business and Finance, 24(2), 103–112.
APPENDIX
Diagnostic Tests
Several diagnostic tests were performed on the residual to test the adequacy of the model estimated. The results are presented in .
Figure A1. Normality test.Source: By Author Based on the findings reported on Figure 5.5, the results show a Jarque-Bera statistic of 3.063, with an associated probability of 0.2162. This means the residuals are normally distributed.
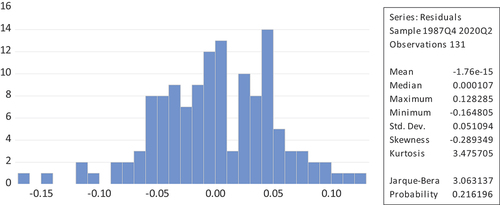
Table A1. Diagnosis test
The other three diagnosis test were performed on the residuals and the results are reported on Table . Table shows that the model does not suffer from serial correlation, given an F-statistic of 1.0783 with a probability value of 0.8493. Also, the model does not suffer from heteroscedasticity, given the Observed R-Squared of 1.5022 and a probability of 0.4748. The model also is correctly specified as evidenced by the LR ratio of 0.1498 and associated probability of 0.6986.
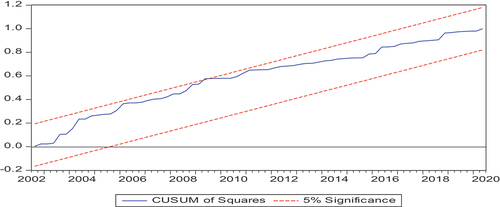
The stability of the model was examined through the CASUM test and the CASUM of Squares test. The results are reported in .
Figure A2. CASUM Test.Source: By Author shows that the plot of the CASUM test as well as the CASUM Square on are between the two red lines. This confirms that the model estimated is stable.
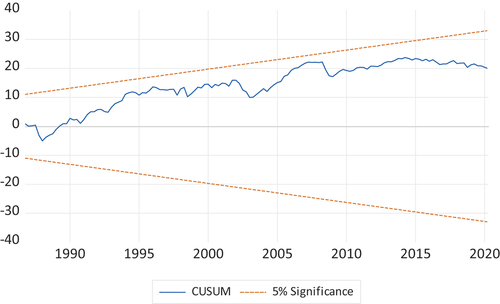
Figure A3. CASUM Test.Source: By Author
Informal Unit root Tests
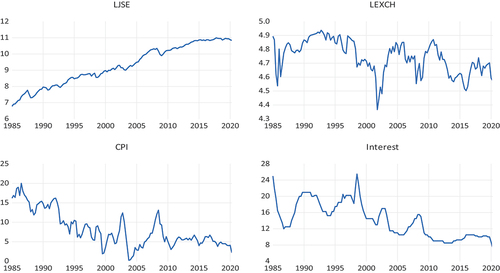
As a way of determining the time-series properties of the data, both the formal and informal tests were conducted. For the informal tests graphical plots were utilised. These are presented in .
Figure A4. Informal unit root tests (Level.Source: By Author shows that for all variables, there is evidence of the data trending. In other words, there is evidence that as one moves from one period to the next, the data changes as well. This is a way confirms that at level series the data is not stationary.
Informal unit root tests (Differenced Series)
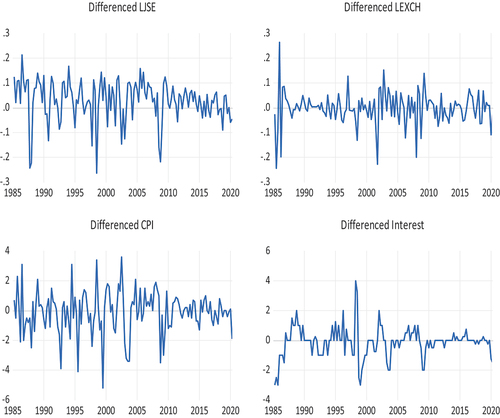
The data trends were also checked using first differenced data, as indicated on , there is evidence of the series being stationary. However, formal tests were carried out so as to ascertain the level of stationarity of the data.
Figure A5. Informal unit root tests (Differenced).Source: By Author