
 ?Mathematical formulae have been encoded as MathML and are displayed in this HTML version using MathJax in order to improve their display. Uncheck the box to turn MathJax off. This feature requires Javascript. Click on a formula to zoom.
Abstract
Though East Africa has ample resource endowments for electricity production, the region has the lowest performance in generating electricity, and millions of people are living without access to electricity. To fill the electricity gap countries used fossil fuels as the major source of energy, but electricity production from a renewable resource is lower. Therefore, this study aimed to identify determinant factors of electricity production from renewable resources excluding hydropower sources. Panel data for five East African countries for the period 1998 to 2019 were used, and it was examined using pooled mean group panel ARDL estimation technique. The estimation result revealed that in the long- and short-run GDP per capita growth, population growth, energy consumption per capita, and energy import have a positive significant effect on electricity production from renewable resources other than hydropower, while political instability, electricity production from hydropower, and electricity production from oil, gas, and coal have a negative significant effect. However, in the short run, energy use and resource rent percentage of GDP have positive and negative significant effects, respectively, but in the long run, the two variables have no significant effect. Error correction coefficient is negative 0.64, which indicates that the deviation from long-run disequilibrium adjusts toward equilibrium at a rate of 64% per year. Based on the results, this study recommends that the government improve the performance of GDP growth by quality education, lower lending interest rate, improving political stability through controlling internal conflicts caused by differences in religion and ethnicity, and improving energy security.
PUBLIC INTEREST STATEMENT
The limited availability of fossil fuels, on which countries have been highly dependent on for last few decades, makes it costlier, scarce, and greenhouse gas emission increases. Because of these reasons many countries shift their energy source from non-renewable to renewable. However, unlike the ample renewable resources in the region, its performance is the lowest in the world. To improve this performance great efforts, mostly on hydropower, were devoted by both the government of a country and international organizations, but it is not as expected. Therefore, identifying the bottlenecks of renewable energy production has paramount importance for the region. Thus, the researcher tried to do so.
1. Introduction
Though electricity is essential for life, millions of people in the world have no access to electricity. According to the International Energy Agency (IEA), an individual is in energy poverty if and only if he/she cannot access a minimum kWh of 120 per annum (UN-WB, Citation2011). IEA’s projection shows that a household has enough access to electricity if they can get 1250 kWh per year per household with standard appliance and 420 kWh of efficient appliance (Pérez-Fargallo et al., Citation2020). However, most African countries do not fulfill this criterion. Besides, in terms of electricity access, Africa is the lowest-performing continent. For instance, the share of the world population with access to electricity increases from 71.4% in 1990 to 87.35% in 2016 (World Bank, Citation2018). Despite this, the average annual increase in access to electricity is low. From 1990 to 2010 average annual increase in access to electricity is 0.61% which increases to 0.75% from 2010 to 2012, but declines back to 0.33% from 2012 to 2014. From 2014 to 2016, it is 0.83%, and the target rate from 2016 to 2030 is 0.9% (world bank, Citation2018). Despite this rate, sub-Saharan Africa’s electricity access deficit has more than doubled between 1990 and 2016. For instance, in 1990, only 28% of sub-Saharan Africa faces electricity deficit, but in 2016, it reaches 60%. Moreover, in the continent from 2002, each year around 9 million people are added to have no access to electricity per year. In Africa from 2000 to 2020, populations without electricity ranged from 522 to 609 million, and the maximum population without access to electricity was reached in 2013.Footnote1
To fill the electricity gap, great effort was devoted by both countries and international organizations. For the last few decades, fossil fuels were the major source of energy used by households, firms, and the government. However, the limited availability of fossil fuels makes the price of energy higher and the resource becomes scarcer, and the greenhouse gas emission increases. In addition, nowadays “climate change” has been receivin great interest among politicians, economists, and the government (Adra, Citation2014). Due to this, many countries are shifting their source of energy from non-renewable to renewable sources. Africa, in general, and East Africa, in particular, has great endowments and potential for renewable energy from water, wind, solar, and other renewable sources. For instance, Africa has 1.1 gigawatts of hydropower, 9,000 megawatts of geothermal, and other abundant potentials of biomass and solar energy (Karekezi & Kimani, Citation2002).
Despite the potentials, the region has the lowest performance in generating electricity from renewable sources. For instance, at the end of 2014 only 2462 megawatts of wind energy was generated, and a total of 21 gigawatts of new capacity is expected to be operational in 2020. According to the African energy industry report (AEIR, Citation2018) Africa faces many energy challenges, which require the accelerated use of modern renewable energy sources and the development of energy infrastructures. In Sub-Saharan Africa, the number of people without access to reliable electricity reaches more than 620 million. Sustainable Development Goal 7 plans to close the electrification gap and provide reliable and sustainable energy for all by 2030. However, recent rates of growth in electricity access indicate that Africa will not meet this target.Footnote2 Lack of access to electricity is endemic in Africa regardless of income. Africa is the leading continent that has most countries whose electrification performance is below their income predictions. Increasing the rate of electrification from 20% to 80% will take 25 years (Blimpo & Cosgrove-Davies, Citation2019).
The consumption and production of energy in East Africa are similar. Most of the countries in the region are heavily dependent on fossil fuels as a primary source of energy use. In addition to fossil fuel energy, they use traditional biomass fuels ranging from 70% to 90% of total energy production. This high dependence on traditional biomass fuels causes large area deforestation and environmental degradation. However, energy production from renewable resources is small accounting for 2% for hydropower, solar, and geothermal sources. From the total renewable resource of energy production, hydropower sources constitute 70% of production. Despite this, the region has geothermal energy potentials of 15,000 MW. However, only Kenya generates electricity from geothermal energy. From the total of worldwide geothermal energy generation of 10,000 MW, Kenya and Ethiopia generated 209 and 5 MW, respectively (Omenda & Teklemariam, Citation2010).
There was also only 5.5 GW of wind power across the whole of Africa in 2018, an increase from 1 GW in 2010. Meanwhile, there was 4.5 GW of solar PV across the continent as of 2019 (IEA, Citation2019). Looking at other renewable technologies, Kenya is leading other East African countries in the development of geothermal power in the region (Sawyer, Citation2020). International Energy Agency (International Energy Agency (IEA), Citation2011) estimates indicate that 17% of electricity in SSA was lost in 2018, and from this, Kenya loses over 20%. Climate-driven issues with rainfall can also lead to outages or price fluctuations when low water levels prevent hydropower plants from operating and force utilities to turn to backup generators (IEA, 2019a). The large share of hydropower in the region’s electricity mix has contributed to electricity shortages or being forced to turn to backup generators as climate-change-induced rainfall changes have resulted in depleted water resources across the region. Except for Kenya, where wind and geothermal are also being invested in, and in Rwanda, where solar PV is also seeing investments, in East African countries, investment in power is still predominantly in hydropower (REN21, Citation2016). As a result, other electrical power sources account for only small amounts of the region’s power, with solar PV having only 9.15 MW in the EAC in 2015, 8.75 MW of which was in Rwanda. At the same time, geothermal power had nearly 600 MW of capacity, and the wind had 25.5 MW (REN21, Citation2016). Thus, this study was intended to examine determinant Electricity Production from Renewable Sources other than Hydropower in selected East African countries.
The rest of the paper is organized as follows. The next section discusses the methodological approach of the panel ARDL approach and source of data. Section 3 is devoted to the presentation and discussion of empirical findings. Concluding remarks and recommendations are presented at the end.
2. Literature review
In this section, literature reviews related to renewable energy production and its determinants are presented. According to Da Silva et al. (Citation2018) economic growth is one of the drivers of renewable energy consumption. A recent study concluded that renewable energy sources, based on wind, water, and sunlight (abbreviated as WWS; not including biomass), could provide all new energy globally by 2030, and replace all current non-renewable energy sources by 2050 (Jacobson & Delucchi, Citation2011). The decline in energy import dependency diminishes the impact of fossil fuel energy prices, in other words, countries’ vulnerability to external shocks and restrictions imposed on the economy because of fossil fuel reserve limits (Da Silva et al., Citation2018). Marques and Fuinhas (Citation2011) found negative effects of fossil fuel and nuclear contribution to electricity generation and positive effects of energy imports. Investment in the renewable energy sector is very sensitive to the country’s institutions’ quality (e.g., Becker and Fischer, Citation2013). Theoretically, weak institutions have various harmful impacts on energy-sector policies, in particular, the electricity sector. Accordingly, Gutermuth (Citation2000) considers that the legal and institutional framework is of great importance in the transition to clean energies. The findings reveal that political stability is a key determining factor of renewable energy production.
By using panel quantile with non-additive regression model, Belaid et al. (Citation2019) concluded that the effect of political stability has a heterogeneous effect on renewable energy production. For instance, at the lower (10th) and higher (90th) quantile political stability has a negative significant effect. However, its elasticity has a positive significant effect. They also found that economic growth and natural resource dependency negatively affects renewable energy production in the lower (10th) quantile, while on the remaining quantile, it has a positive significant effect. Moreover, they found a positive relationship between renewable energy production and economic growth. This can be interpreted as a resource curse in countries where renewable energy production is lower. Finally, the quantile regression model results show that the total energy consumption elasticities are positive and statistically significant throughout the renewable energy production distribution.
Mengova (Citation2019) examined determinants of production of energy from renewable sources in Europe, the Former Soviet Union, the Middle East, and North Africa. The author found that energy use per capita has a negative significant effect on renewable energy production, while energy use per capita has a positive effect. The result confirms that the energy needs of one’s country should be fulfilled by utilizing both traditional and renewable energy sources efficiently. GDP per capita coefficient estimate was small, but positive and significant. The coefficient of energy imports, i.e., the variable accounting for the energy security of a country, has a positive and significant effect on renewable energy production. Finally, all the alternative traditional sources of electricity production in each country were statistically significant and had a negative effect.
3. Methods
The data for this study were collected from East African countries over the years 1998 to 2019. Electricity production from renewable energy sources excluding hydropower, gross domestic product per capita growth, population growth, electricity production from hydropower energy as a percentage of total electricity production, energy imports, energy use, political instability, electricity production from oil, gas, and coal as a percentage of total electricity production, resource rent as a percentage of GDP variables for five East African countries, namely, Ethiopia, Kenya, Tanzania, Zimbabwe, and Mauritius,was were collected from the World Bank database. Only these countries were selected because other East African countries have no data on electricity production from renewable sources excluding hydropower for the years 1998 to 2019.
In this study, panel ARDL estimation technique is used. It is used because it has many advantages over the traditional Johansson co-integration approach in that the panel ARDL approach could be used with the studied factors regardless of whether they were I(0), I(1), or both I(0) and I(1). Based on the study conducted by Paseran and Shin (Citation1995) the following basic ARDL specification is used as a benchmark for this study:
Where i = 1, 2 … N stands for cross sections and t = 1, 2, 3 … . represents for time periods; is k*1 vector of regressors and
is k*1 coefficient vectors;
is an m × 1 vector of unobserved common factors;
is the corresponding factor loading. From Equationequation 2
(2)
(2) , the error correction model is parameterized as follows:
Where represents the speed of adjustment from a long-run relationship;
is a vector of long-run coefficients is which can be computed regardless of whether the variables are I(0) or I(1), and whether the explanatory variables are endogenous or exogenous (Paseran et. al, Citation2001; as cited in Chen & Vujic, Citation2016). After specifying the model under the panel ARDL model, there are three estimation techniques. These include the mean group estimator, pooled mean group estimator, and dynamic fixed effect estimator. Mean group considers heterogeneity in both slope and constant, while PMG only assumes fixed effect heterogeneity in the long-run specification, which means Pooled Mean Group uses Maximum-likelihood to get the long-run equation, but MG estimates different coefficients (constant and slope) for each panel separately.
By contrast, the DFE estimator restricts the speed of adjustment, slope coefficient, and short-run coefficient to exhibit non-heterogeneity across countries. Accepting this estimator as the main analysis tool requires the strong assumption that countries’ responses are the same in the short-run and long-run, which is less compelling. Another drawback is that this approach may suffer from simultaneity bias in a small sample case due to the endogeneity between the error terms and lagged explanatory variables (Baltagi et al., Citation2000). The PMG restricts long-run equilibrium to be homogeneous across countries while allowing heterogeneity for the short-run relationship. The short-run relationship focuses on the country-specific heterogeneity, which might be caused by different responses of stabilization policies, external shocks, or financial crises for each country. The MG estimator allows for heterogeneity in the short-run and long-run relationships. To be consistent, this estimator is appropriate for a large number of countries. For a small number of N, this method is sensitive to the permutation of non-large models and outliers (Favara, Citation2003). To choose among the three models, the Hanuman specification test was used.
Dependent and independent variables used in this study are discussed as follows: the dependent variable is electricity produced from renewable resources excluding hydropower (EPRREHT). It is electricity production from solar, wind, biomass, and tides. Gross domestic product per capita growth (GDPPCG) is used as an independent variable, which is used to measure the prosperity of a nation computed by dividing GDP by the population of a country. It is expected that an increase in GDP per capita will cause an increase in electricity production from renewable energy sources excluding hydropower. However, in developing countries, the fast growth rate of population offsets the growth of the gross domestic product, which in turn causes GDPPCG to decline or be constant. The second variable used as an independent variable is Population growth (POPGROWTH) in that as the size of the population increases the energy demand also increases. Hence, it was expected that there is a positive relationship between population growth and electricity production from renewable energy sources excluding hydropower. Energy consumed per capita (ECPC) residing in the country is the third variable used in this study. Energy imports (ENERIMPOR), a proxy for the energy dependency of a country represents that as energy import increases the country’s energy source becomes insecure. As a result, the country is required to invest more in domestic renewable resources, and the production of electricity from renewable resources increases. Electricity production from oil, gas, and coal as a percentage of total electricity production (EPOGCT), which is a non-renewable resource, and relying on these sources will have a consequence of scarcity and declining welfare of the society. It was expected that an increase in electricity production from non-renewable resources will cause a decline in electricity production from renewable resources of wind, solar, and biomass.
Energy use (ENERUSE) is energy use measured as kg of oil equivalent per capita. It refers to the use of primary energy before transformation to other end-use fuels, which is equal to indigenous production plus imports and stock changes, minus exports and fuels supplied to ships and aircraft engaged in international transport. An increase in energy use could increase energy production and create incentives for more production, particularly from renewable sources. Total natural resources rents % of gross domestic product (RESRENTGDP) is the sum of oil rents, natural gas rents, coal rents (hard and soft), mineral rents, and forest rents. Electricity production from hydropower energy as a percentage (EPHPT) is also used as an independent variable. Finally, political instability (POLINST) is used as an independent variable, which involves whether the institutional development of one’s country depends on democracy and rule of law, i.e., the involvement of the population in the decision-making process. The data is yearly reported by the World Freedom House survey since 1972 for 195 sovereign countries. The measure of political freedom incorporates two broad sub-groups: political rights (PR) and civil liberties ratings (CL). The political right includes subgroups such as the process of election, level of participation and political pluralism, and government functioning. While civil liberties include the level of freedom of expression and belief, rights associated with freedom to join and leave existing groups of the organization, rule of law, protection of individual rights, and personal freedom. Both were evaluated in the range of 1 to 7. If the index ranges between 1 and 2.5 a country is considered as free, 3 to 5 partially free, and 5.5 to 7 is considered as not free (Bzhalava, Citation2014). In estimating the level of freedom, Freedom House survey control for cultural differences and provides generalized estimation built on worldwide standards of political and civil rights such as the Universal Declaration of Human Rights.
4. Result and discussion
Figure presents each country’s mean electricity production from only hydropower sources and electricity production from renewable resources excluding hydropower energy as a percent of total electricity production. In Ethiopia, more than 90% of electricity production is from hydropower and the mean electricity production from renewable resources excluding hydropower energy as a percentage of total electricity production is less than 10%. In Kenya, the mean electricity production as a percentage of total electricity production from hydropower energy is less than 60% and the mean electricity produced from renewable resources excluding hydropower is 20%, which is the highest mean electricity production as compared to other countries production considered in this study. In Mauritius, the mean electricity production excluding hydropower is greater than electricity production from hydropower. The mean electricity production from renewable resources excluding hydropower in Tanzania and Zimbabwe is closer to zero, while the mean electricity production from hydropower energy is greater than 60% and 50%, respectively.
Figure 1. Electricity production from renewable resources (hydropower and other sources), a comparison.
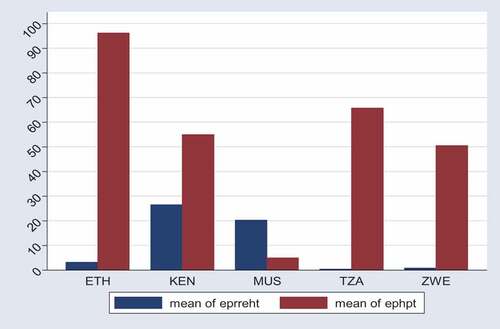
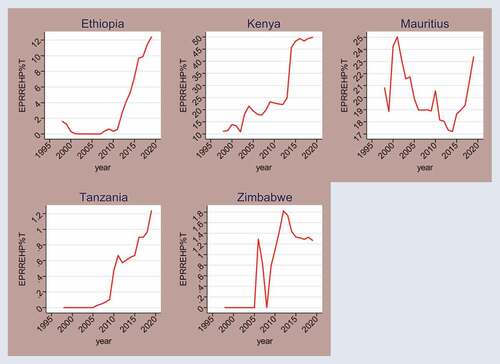
Figure presents the time trend of electricity production from renewable resources excluding hydropower energy by country. It shows that in Ethiopia, Kenya, and Tanzania, electricity production from renewable resources excluding hydropower sources as a percentage of total electricity production is increasing, while in Mauritius and Zimbabwe, it shows great fluctuations. For instance, in Zimbabwe, electricity production is declining after 2010.
Figure 2. Time trends of electricity production from renewable resources excluding hydropower by country.
4.1. Stationary test
Before reporting the long-run estimation of the panel ARDL model, the researcher tested the stationary of the variables used in the estimation. This study adopted the test of stationary developed by Im et al. (Citation2003), which relaxes the assumption of a common autoregressive parameter. The starting point for the IPS test is a set of Dickey–Fuller regressions of the form: where
is panel-specific indexed by I and I’m Pesaran assume that
is independently distributed normal for all i and t, and allow
have heterogeneous variances across panels. The IPS test allowing for heterogeneous panels with serially uncorrelated errors assumes that the number of periods, T is fixed. While N is assumed to be either fixed or
. Hence, the test is tested based on the null hypothesis that all panels have unit roots against the alternate hypothesis that some panels are stationary. As can be seen in Table , five variables are stationary at the first difference and the remaining four variables are stationary at level. Stationary test political instability is not conducted because of an insufficient number of periods to compute W-t-bar.
Table 1. Stationary test statistics of variables used in this study
4.2. Model selection
Under the panel ARDL model estimations there are three estimation techniques.. These include the mean group estimator, pooled mean group estimator, and dynamic fixed effect estimator. Mean group considers heterogeneity in both slope and constant, while PMG only assumes fixed effect heterogeneity in the long-run specification, which means Pooled Mean Group uses Maximum-likelihood to get the long-run equation, but MG estimates different coefficients (constant and slope) for each panel separately. By contrast, the DFE estimator restricts the speed of adjustment, slope coefficient, and short-run coefficient to exhibit non-heterogeneity across countries. Accepting this estimator as the main analysis tool requires the strong assumption that countries’ responses are the same in the short-run and long-run, which is less compelling. Another drawback is that this approach may suffer from simultaneity bias in a small sample case due to the endogeneity between the error term and lagged explanatory variables (Baltagi et al., Citation2000). The PMG restricts long-run equilibrium to be homogeneous across countries while allowing heterogeneity for the short-run relationship. The short-run relationship focuses on the country-specific heterogeneity, which might be caused by different responses of stabilization policies, external shocks, or financial crises for each country. The MG estimator allows for heterogeneity in the short-run and long-run relationship. To be consistent, this estimator is appropriate for a large number of countries. For a small number of N, this method is sensitive to permutations of non-large models and outliers (Favara, Citation2003). In both tests reported in Table , the probability is greater than chi2 test statistics, which confirms that pooled mean group estimator is found to be suitable for the data used in this.
Table 2. Model selection among the pooled mean group, mean group, and dynamic fixed effect
4.3. Panel ARDL estimation result
As can be seen from Table , among the independent variables used in this study in the long-run gross domestic product per capita growth, population growth, electricity production from oil, gas, and coal as a percentage of total electricity production, electricity consumption per capita, import of energy, electricity production from hydropower sources, and political instability have a significant effect on electricity production from renewable energy except for hydropower sources. However, energy use and natural resource rent have an insignificant effect on electricity production from renewable resources. This result is contrary to that of Akarsu and Gümüşoğlu (Citation2019). While in the short, all independent variables have a significant effect on the dependent variable and the error correction term is statistically significant and the coefficient is negative. Therefore, it indicates that short deviation from long-run equilibrium is adjusted towards the equilibrium at a rate of 64% per year.
Table 3. Long- and short-run panel ARDL estimation results of pooled mean group model
Economic growth has a positive significant effect on electricity production from renewable resources except for hydropower, which confirms that as the income of a nation increases it creates power and financial accessibility to invest in the production of electricity from wind, sunshine, and other renewable sources. Apergis and Payne (Citation2014), Pfeiffer and Mulder (Citation2013), da sliva et al. (Citation2013) found similar results. In addition, the relationship between population growth and electricity production from renewable resources excluding hydropower confirms the theory that states an increase in population growth causes demand for energy in general, and electricity in particular increases. To satisfy these demands, the production of electricity should be increased. One way of increasing electricity production is using renewable resources. However, in East Africa, it is very low and there is a huge gap between demand and supply of electricity in general, and electricity from renewable resources in particular. Currently, the demand for electricity in Africa, which is the world’s richest in solar resources, reaches 700 terawatts per hour. Despite this fact, only 5 gigawatts, less than 1% of the world’s solar energy installation, were installed in the continent. Dasliva et al. (2013) confirms the positive relationship between population growth and renewable electricity production.
The other significant variable which affects electricity production from renewable resources except hydropower sources is the production of electricity from oil, gas, and coal. The coefficient is negative confirming that the East Africa government’s electricity production highly depends on non-renewable resources which have a negative effect on the environment and the next generation, and in turn, it affects the investment of renewable resources negatively. The findings of Marques et al. (Citation2010), Marques and Fuinhas (Citation2011), Marques and Fuinhas (Citation2010), and Aguirre and Ibikunle (Citation2014) also indicate the negative effect of energy production from oil, gas, and coal on renewable energy production. The coefficient of energy imports, i.e., the variable accounting for the energy security of a country, was positive and significant. The theoretical assumption that the higher the reliance of a country on energy imports, the higher the level of renewables investment needed to ensure that country’s energy security, was empirically confirmed. The result is in line with the findings of Marques et al. (Citation2010).
Electricity consumption per capita, which is a more specific measure, was positive and significant. This affirmed that the general energy needs of a given country could be fulfilled by utilizing both non-renewable and renewable sources of energy production. Given the estimation result, it was clear that electricity consumption per capita would move to increase the electricity produced from renewable sources. As a country development indicator, this supported the hypothesis that the growing electricity needs of a developing country translated into a growing electricity production from renewables. Finally, political instability has a negative significant effect on electricity production from renewable resources other than hydropower sources. It confirms that under political instability investor’s fear to invest and production decreases. The result is consistent with the results found by Mengova (Citation2019).
5. Conclusion and recommendation
The main objective of the study was to identify determinants of electricity production from renewable sources excluding hydroelectricity in selected East African countries. To do so, panel data for five East African countries (Ethiopia, Kenya, Tanzania, Zimbabwe, and Mauritius) from the period 1998 to 2019 were collected. The reason that the researcher use only 22 years and 5 countries is that other East African countries have no data on dependent variable, and from 1998 backward, there is no data for all East African countries. The collected data was examined by the panel ARDL approach, which requires the data to be integrated of orders 0 and 1. To select a suitable estimation technique for the collected data among the three, namely, pooled mean group, mean group, and dynamic fixed effect model, Hausman specification test was employed. The test statistics show that the pooled mean group estimator is found to be suitable for the data used in this study. Before estimating pooled mean group estimation, the existence of co-integration was tested by Pedroni's co-integration tests with time trend and without trend. In both cases, at least four sub-tests are statistically significant, which confirms the existence of long-run relationship between variables.
The result of pooled mean group panel ARDL estimation revealed that in both the long- and short-run GDP per capita growth, population growth, energy consumption per capita, and energy import have a positive significant effect on electricity production from renewable resources other than hydropower, while political instability, electricity production from hydropower, and electricity production from oil, gas, and coal have a negative significant effect. However, in the short run, energy use and resource rent percentage of GDP have positive and negative significant effects, respectively, but in the long run, the two variables have no significant effect. Based on the result, this study recommends the following policy options: To increase electricity production from renewable resources the government and other concerning bodies should work on activities that increase GDP growth through infrastructure development and reduce the lending interest rate to accelerate investment, improving the quality of education and enhancing the productivity of the workforce, improving political stability through controlling internal conflicts caused by the difference in religion and ethnicity, and improving the quality of bureaucracy. In addition, being heavily dependent on imported energy indicates high energy insecurity. Thus, to bring energy security, the government and ministry of energy in East Africa should focus on substitution of imported energy by domestically produced alternative sources through identifying the least cost investment options of a renewable resource. Moreover, the concerning body should reduce investment and consumption of energy from natural gas, oil, and coal, and re-allocate investment to renewable resources. Finally, answering demand-driven factors would have paramount importance in increasing electricity production from renewable resources other than hydropower.
Disclosure statement
No potential conflict of interest was reported by the author(s).
Additional information
Funding
Notes on contributors
Teshager Mazengia Asratie
Teshager Mazengia Asratie, the author of this article, is MSc in economics holder from Addis Ababa University with specialization in resource and environmental economics. Currently, I am working for Debre Berhan University as a lecturer. I am interested in conducting a study on financial-sector performance, renewable and non-renewable resource use efficiency, and valuation, climate change adaptation practices and its role in agricultural productivity.
Notes
3. Pooled Mean Group
References
- Adra, F. (2014). Renewable energy: An eco-friendly alternative? Friedrich-Ebert-Stiftung, Ghana Office.
- AEIR. (2018). African energy industry report, ispy publishing’s Industry Survey. In Market Intelligence, and Forecasts Series. Bolton.
- (2018). An African energy industry report. Publishing limited Albert House 42 Seymour Road Bolton.
- Aguirre, M., & Ibikunle, G. (2014). Determinants of renewable energy growth: A global sample analysis. Energy Policy, 69, 374–12.
- Akarsu, G., & Gümüşoğlu, N. K. (2019). What are the main determinants of renewable energy consumption? A panel threshold regression approach. Anadolu Üniversitesi Sosyal Bilimler Dergisi, 19(2), 1–22. https://doi.org/10.18037/ausbd.566663
- Apergis, N., & Payne, J. E. (2014). Renewable energy, output, CO2 emissions, and fossil fuel prices in Central America: Evidence from a nonlinear panel smooth transition vector error correction model. Energy Economics, 42, 226–232.
- Baltagi, B. H., Griffin, J. M., & Xiong, W. (2000). To pool or not to pool: Homogeneous versus heterogeneous estimators applied to cigarette demand. Review of Economics and Statistics, 82(1), 117–126. https://doi.org/10.1162/003465300558551
- Becker, B., & Fischer, D. (2013). Promoting renewable electricity generation in emerging economies. Energy Policy, 56, 446–455. https://doi.org/10.1016/j.enpol.2013.01.004
- Belaid, F., Elsayed, A. H., & Belaid, F. (2019, July). What drives renewable energy production in MENA region?: Investigating the roles of political stability, governance and financial sector. Economic Research Forum (ERF).
- Blimpo, M. P., & Cosgrove-Davies, M. (2019). Electricity access in Sub-Saharan Africa: Uptake, reliability, and complementary factors for economic impact. The World Bank.
- Bzhalava, E. (2014). Determinants of financial development, faculity of social science, institute of economic studies. Charles university in Prague, masters thesis
- Chen, W., & Vujic, S. (2016). A reassessment of the relationship between income inequality and economic growth: New empirical evidence from China. In Conference paper. https://businesslaw.curtin.edu.au/wp-content/uploads/sites/5/2016/07/panel-data-conference-areassessment-of-the-relationhip-between-income-inequality-and-economic-growth-newempirical-evidence-from-china.pdf
- da Silva, N. F., Rosa, L. P., Freitas, M. A. V., & Pereira, M. G. (2013). Wind energy in Brazil: From the power sector's expansion crisis model to the favorable environment. Renewable and Sustainable Energy Reviews, 22, 686–697.
- Da Silva, P. P., Cerqueira, P. A., & Ogbe, W. (2018). Determinants of renewable energy growth in Sub-Saharan Africa: Evidence from panel ARDL. Energy, 156, 45–54. https://doi.org/10.1016/j.energy.2018.05.068
- Favara, M. G. (2003). An empirical reassessment of the relationship between finance and growth. International Monetary Fund.
- Gordon, E. (2018). The politics of renewable energy in East Africa.
- Gutermuth, P. G. (2000). Regulatory and institutional measures by the state to enhance the deployment of renewable energies: German experiences. Solar Energy, 69(3), 205–213.
- IEA. (2019). Heating in buildings Tracking Clean Energy Progress, International Energy Agency (IEA). Paris.
- Im, K. S., Pesaran, M. H., & Shin, Y. (2003). Testing for unit roots in heterogeneous panels. Journal of Econometrics, 115(1), 53–74. https://doi.org/10.1016/S0304-4076(03)00092-7
- International Energy Agency (IEA) (2011). International energy agency - energy statistics http://www.iea.org/stats
- Jacobson, M. Z., & Delucchi, M. A. (2011). Providing all global energy with wind, water, and solar power, Part I: Technologies, energy resources, quantities and areas of infrastructure, and materials. Energy Policy, 39(3), 1154–1169. https://doi.org/10.1016/j.enpol.2010.11.040
- Karekezi, S., & Kimani, J. (2002). Status of power sector reform in Africa: Impact on the poor. Energy Policy, 30(11–12), 923–945. https://doi.org/10.1016/S0301-4215(02)00048-4
- Karekezi, S., & Kithyoma, W. (2003). Renewable energy in Africa: Prospects and limits. Prepared for: The Workshop for African Energy Experts on Operationalizing the NEPAD Energy Initiative. 2-4 June 2003.
- Kiran, B., Yavuz, N. C., & Guris, B. (2009). Financial development and economic growth: A panel data analysis of emerging countries. International Research Journal of Finance and Economics, 30(2), 87–94.
- Marques, A. C., Fuinhas, J. A., & Manso, J. P. (2010). Motivations driving renewable energy in European countries: A panel data approach. Energy Policy, 38(11), 6877–6885.
- Marques, A. C., & Fuinhas, J. A. (2011). Drivers promoting renewable energy: A dynamic panel approach. Renewable and Sustainable Energy Reviews, 15(3), 1601–1608. https://doi.org/10.1016/j.rser.2010.11.048
- Mengova, E. (2019). What determines energy production from renewable sources? Journal of Strategic Innovation and Sustainability, 14(4), 83–100.
- Omenda, P., & Teklemariam, M. (2010). Overview of geothermal resource utilization in the east African rift system. Short Course V on Exploration for Geothermal Resources.
- Pérez-Fargallo, A., Bienvenido-Huertas, D., Rubio-Bellido, C., & Trebilcock, M. (2020). Energy poverty risk mapping methodology considering the user’s thermal adaptability: The case of Chile. Energy for Sustainable Development, 58, 63–77. https://doi.org/10.1016/j.esd.2020.07.009
- Pesaran, M. H., & Shin, Y. (1995). An autoregressive distributed lag modelling approach to cointegration analysis.
- Pesaran, M. H., Shin, Y., & Smith, R. J. (2001). Bounds testing approaches to the analysis of level relationships. Journal of Applied Econometrics, 16(3), 289–326.
- Pfeiffer, B., & Mulder, P. (2013). Explaining the diffusion of renewable energy technology in developing countries. Energy Economics, 40, 285–296.
- Przychodzen, W., & Przychodzen, J. (2020). Determinants of renewable energy production in transition economies: A panel data approach. Energy, 191, 116583. https://doi.org/10.1016/j.energy.2019.116583
- Renewables (REN21). (2016). Global Status Report (REN21, 2016).
- Sawyer, C. (2020). Meeting future electricity needs in the East African community: Mapping renewable energy potential.
- UN-WB. (2011). United Nations – World Bank, World development indicators. http://data.un.org
- World Bank (2018). Cambodia beyond connections: Energy access diagnostic report based on the multi-tier framework.
- World Bank. (2018). Tracking SDG 7: The energy progress report 2018.
