?Mathematical formulae have been encoded as MathML and are displayed in this HTML version using MathJax in order to improve their display. Uncheck the box to turn MathJax off. This feature requires Javascript. Click on a formula to zoom.
Abstract
This study investigates the asymmetric shock transmission mechanisms between seven large cryptocurrencies and crude oil at different market conditions across time. Wavelet technique was used to decompose the daily return series of the assets into wavelet scales to capture trading horizons. We applied quantile regression (QR) and quantile-in-quantile Regression (QQR) on the decomposed series to capture the bear (bull) market conditions. Applying the QR, we found Ethereum, Steller, Ripple and Monero as hedges for oil market volatility at all market regimes from medium to long terms. The QR undermined the hedging properties of Bitcoin, Litecoin and Das, suggesting possible spread of market disruptions from these markets to crude oil market. We observe from QQR that the assets have negative influence on each other at bear market but positive influence at bull market across time, signifying hedging possibilities for both assets in bear market. The significance of our finding is strengthened by the recent rise in the market share of cryptocurrencies.
PUBLIC INTEREST STATEMENT
Crude oil is a strategic and essential commodity for investors and the global economy. It is the primary export of most countries. Notably, an economy’s inflation and general price movement is measured by movements of crude oil price suggesting crude oil price as the harbinger of inflationary conditions in economies. Studies have demonstrated that crude oil price is the major cause of cost and demand pressures in an economy and that the price of cryptocurrencies may appreciate (depreciate) when the general price level change due to fluctuations in crude oil price. This shows the importance of investigating the dynamic interdependences between cryptocurrencies and crude oil returns at different market regimes in a time-frequency space to uncover the shock transmission mechanisms between the assets across time. The choice of cryptocurrencies and crude oil is not arbitrary but because crude oil is a major commodity traded in commodity exchanges and there has also been a creation of blockchain platform which facilitate crude oil trade between firms in the commodity industry. Importantly, crude oil price drives the price formation of cryptocurrencies therefore the response of cryptocurrencies to crude oil price shocks is crucial for risk management and assets allocation.
1. Introduction
Launched in 2009, cryptocurrencies have become global phenomenon with many features including alternative monetary system (Das & Kannadhasan, Citation2018; Fantazzini et al., Citation2016; Rogojanu & Badea, Citation2014), speculative or investment vehicles (Baek & Elbeck, Citation2015; Corbet et al., Citation2018; Ji et al., Citation2019; Yermack, Citation2013), hedges, diversifiers and safe havens for crude oil market fluctuations (Al-Yahyaee et al., Citation2019; Selmi et al., Citation2018) and assets with high volatility (Catania et al., Citation2018; Chan et al., Citation2017; Gkillas & Katsiampa, Citation2018; Huynh & L, Citation2019). The works of Rogojanu and Badea (Citation2014) and Popper (Citation2015) consider cryptocurrencies as digital gold owing to their hedge and safe haven characteristics. Crude oil is an essential commodity in the global economy but has exhibited high volatility and shocks over the past decade (Al-Yahyaee et al., Citation2019) and spilling over to other markets (Coudert et al., Citation2008; Ji et al., Citation2018a; Zhang et al., Citation2009).
Following Das and Kannadhasan (Citation2018), an economy’s inflation and general price movement is measured by movements of crude oil price, suggesting crude oil price as the harbinger of inflationary conditions in an economy. Studies by Krugman (Citation2008) and Palombizio and Morris (Citation2012) demonstrate that crude oil price is the major cause of cost and demand pressures in an economy and that the price of cryptocurrencies may appreciate (depreciate) when the general price level changes due to fluctuations in crude oil price (Ciaian et al., Citation2016). This shows the importance of investigating the dynamic interdependences between cryptocurrencies and crude oil returns at different market regimes in a time–frequency space to uncover the shock transmission mechanisms between the assets across time.
The empirical studies on cryptocurrencies in recent times are focused on the hedge and safe haven characteristics of cryptocurrencies relative to commodities (Bouri et al., Citation2018; Dyhrberg, Citation2015b: Baur et al., Citation2018; Bouri et al., Citation2017b; Bouri et al., Citation2018; Shahzada et al., Citation2019). However, the majority of these studies focus solely on Bitcoin and omit altcoins even though the works of Lee et al. (Citation2017), Selmi et al. (Citation2018) and Corbet et al. (Citation2018) suggest that Bitcoin and altcoins are new investment opportunities that can reduce the risk of a well diversified portfolio. Further, the time-variability, nonlinearity and asymmetric associations between the asset markets have not been extensively explored. Following Selmi et al. (Citation2018) and Al-Yahyaee et al. (Citation2019), these asset markets are characterized by nonlinear relationships and unusual dependencies and exhibit high volatility in prices despite being essential to the global economy. As accurate measurement of relationships between assets is critical for portfolio optimization and has implication for risk management, it is important to comprehensively investigate the connectedness between crude oil and cryptocurrencies during different market episodes across time to deepen the academic, regulators and international investors’ knowledge on the potential benefits and risk of these asset markets.
Motivated by the above discourse, we employ nonparametric wavelet-based quantile-in-quantile technique to model the effects of cryptocurrencies on gold and crude oil at different market states in a time–frequency space. We use wavelet technique to decompose the return series of the assets into short-, medium- and long-term trading horizons to capture the multiscale nature of relationship in financial market as used by Das and Kannadhasan (Citation2018). We complement the study of Selmi et al. (Citation2018) by examining the dynamic dependencies between crude oil and cryptocurrencies at bear (bull) states applying quantile regression (QR) and quantile-in-quantile regression (QQR) on the decomposed series to capture the nonlinear and asymmetric association of the assets. The use of QR technique captures both lower and upper tail dependencies in addition to average dependence conditional on varying crude oil and cryptocurrencies market regimes. The QQR approach models the reverse causality where the quantile of cryptocurrency returns with their various frequencies are expressed as a function of crude oil returns. This provides precise information to investors to hedge against their downside risk across time and market regimes.
The findings from QR indicate that only four of the cryptocurrencies studied (Ethereum, Steller, Ripple and Monero) can hedge oil market volatility at bear (bull) states from medium to long-term horizons. The QR result undermined the potential of Das, Litecoin and Bitcoin markets as hedges for crude oil market fluctuations, suggesting shock transmission from Bitcoin, Litecoin and Das markets to crude oil market. The QQR depict inverse association between the cryptocurrencies and crude oil returns when their market is bear but positive association when their market is bull across the time horizons. Thus, both cryptocurrencies and crude oil have hedging properties for each other at bear market across time. Our study departs from prior studies by showing that the connections between crude oil and cryptocurrencies are time-varying and also depend on the state of market. The choice of cryptocurrencies and crude oil is not arbitrary but because crude oil is a major commodity traded in commodity exchanges and there has also been a creation of blockchain platformFootnote1 which facilitates crude oil trade between firms in the commodity industry. Importantly, crude oil price drives the price formation of cryptocurrencies; therefore, the response of cryptocurrencies to crude oil price shocks is crucial for risk management and asset allocation (Van Wijk, Citation2013).
The remainders of the study are structured as follows. Section 2 is the literature review, section 3 covers a description of the methodology. Section 4 covers a description of data and statistical properties. Section 5 captures the results and discussion on the interdependencies between cryptocurrencies and crude oil markets. Section 6 is the conclusion and policy implications.
2. Brief literature review
The modern portfolio theory propounded by Markowitz (Citation1952) contends that adding an asset to a portfolio should be considered in the light of its impact on the performance and risk of the portfolio of assets. In today’s market, cryptocurrencies are digital assets with unique reward/risk profile with brand new level of correlation to conventional asset classes which can add previously unattainable level of asset mix to an investor’s holdings and impact the level of exposure and risk an investor has in a potentially positive way. As discussed by Diebold and Yilmaz (Citation2012), Barunik and Krehlik (Citation2018) and Wu et al. (Citation2014) that cryptocurrencies enhance the portfolio of investors, studies have modeled the relationship between Bitcoin and crude oil returns. Notable studies in this regard include Selmi et al. (Citation2018), who use conditional and unconditional QQR technique to study the impact of gold and Bitcoin on crude oil market and find that gold and Bitcoin can hedge crises in oil markets. Investigating the behavior of Bitcoin in portfolio including gold and crude oil, Guesmi et al. (Citation2019) employ VARMA-DCC-GARCH framework and report that Bitcoin has the ability to reduce portfolio risk when included in portfolio made up of crude oil. More recently, Kurkaa (Citation2019) uses volatility spillover framework to examine the nature of shock transmissions among stocks, commodities, financials, foreign exchange and Bitcoin. This study reports that Bitcoin cannot be a hedge to the traditional assets because of its low correlation with the assets. The study also reports a spillover from Bitcoin market disruptions to the traditional assets market.
Al-Yahyaee et al. (Citation2019) apply GARCH model to gold, oil and Bitcoin and examine the ability of Bitcoin and gold as a hedge against oil market volatility. Findings show that both gold and Bitcoin are good hedges for oil market risk management. Similarly, Ciaian et al. (Citation2016) employ ARDL to explore the relationship between 17 virtual currencies, including Bitcoin, and control for crude oil price, stock market index, interest rate, gold and exchange rate. The findings show that shocks in Bitcoin price impact 15 altcoins, and in the long-run, Bitcoin and four altcoin prices cointegrate. Further, Ji et al. (Citation2019) apply transfer entropy technique to explore the information interdependence among cryptocurrencies, agricultural, metals and energy commodities and report integration between cryptocurrencies and the commodities.
The empirical literature above highlights different dimensions of the connections between cryptocurrencies and commodities (Henriques & Sadorsky, Citation2018; Klein et al., Citation2018; Kurkaa, Citation2019; Selmi et al., Citation2018; Shahzada et al., Citation2019), making the relationship between the variables unclear, which can be attributed to different parametric techniques used to model the returns of cryptocurrencies and commodities. As discussed by Vandezande (Citation2017) that the behaviour of cryptocurrencies compared to other assets should be robustly analysed to provide regulatory bodies and policy makers with the risk and benefits of the assets, we employ wavelet-based quantile-in-quantile technique to model the asymmetric effects of cryptocurrencies on crude oil at different market state in a time–frequency space. Following the heterogeneous market hypothesis by Müller et al. (Citation1993),Footnote2 we decompose the time series of the variables into high, medium and low frequencies using wavelet to account for the multi-scale nature of relationship in assets market as did Das and Kannadhasan (Citation2018). We examine the dynamic dependencies between assets at bear (bull) states applying QR and QQR on the decomposed series.
3. Methodology
Agents in financial markets have varying decision making timescales, and wavelet analysis can be used to explore the association between market returns over different time and frequencies by decomposing a time series into multiple time series associated with varying time and frequencies. Following the work of Catania et al. (Citation2018), the return series of cryptocurrencies display features similar to the return series of traditional assets including extreme observations, leptokurtosis, time-varying asymmetric variability, nonlinear relationships, unusual dependencies and heteroscedasticity, although cryptocurrencies once invested at the correct period provide immense profit to their owners, and the QR and QQR can account for these properties of the financial time series data. Therefore, we model the dynamic dependences between crude oil and cryptocurrencies at bear (bull) states across time employing the maximal overlap discrete wavelet transform (MODWT), QR and QQR. This involves a two-step approach of using MODWT to decompose the series into various wavelet scales based on which QR and the QQR are applied. Pertinent studies that have used this approach include Mishra et al. (Citation2019) and Bouri, Gupta et al. (Citation2017).
3.1. Maximum overlap discrete wavelet transform
The MODWT that simultaneously localizes variations in signal in time and frequency is used to decompose the return series of cryptocurrencies and crude oil into different timescales (Percival & Walden, Citation2000). As Ramsey (Citation2002) notes, we can represent any function of time with scaling function, also known as father wavelet , and wavelet function, also known as mother wavelet
. Father wavelets integrate into one and are used to represent very long scale smooth components of the signal, whereas mother wavelets integrate to zero and are used to represent deviations that occur in the smooth components. Scaling coefficients are generated by father wavelets, whereas mother wavelets give rise to differencing coefficients.
We define father wavelet as
and mother wavelet as
From the father and mother wavelets, the basic functions which define the sequence of coefficients are constituted. The father wavelet smooth coefficients are defined as
and the mother wavelet detail coefficients as
The maximal scale of the former is 2j, while the details are computed from the mother wavelets at all scales from 1 to J. The function f (.) from the coefficient above is defined as
which is simplified to
with orthogonal components defined as
The resulting multihorizon (multiresolution) breakdown of f(t) is .
calculates the jth level wavelet detail related with changes in the series at scale
.
denotes cumulative sum of alterations at each level, and as j increases,
becomes smoother and smoother (Gençay et al., Citation2002). The study employs MODWT to estimate the scaling and wavelet coefficients. An advantage of using MODWT is that it does not restrict the sample size to an integer multiple of 2J0, unlike the discreet wavelet transform (DWT) (Percival & Walden, Citation2000).
The smooth and detail coefficients of a MODWT are allied with zero phase filters, which helps to align the features of original time series with that of multi-resolution analysis (MRA), and DWT-based estimators are asymptotically less efficient compared to MODWT (Gençay et al., Citation2002; Percival, Citation1995; Percival et al., Citation1997). Nonetheless, the MODWT employs moving difference and average operator, thus keeping the exact number of observations at each wavelet decomposition scale, while the DWT employs weighted differences and average attached pairs of observations.
The study applies Daubechies least asymmetric (LA) filter of length eight (LA8) to decompose the series due to its smoothness compared to HAAR wavelet filters which were widely applied in prior studies (Gençay et al., Citation2002). Cornish et al. (Citation2006) documents that the coefficients provided by LA8 filter exhibit better uncorrelatedness across scales than the HAAR filter. In the study, we decompose the series into wavelet coefficients because feasible wavelet coefficients get smaller for higher-level decompositions.Footnote3 The detail coefficient Dj provides the resolution of data at scale 2j to 2j+1. The oscillations of periods of 2–4, 4–8, 8–16, 16–32, 32–64 and 64–128 days are represented by wavelet scales
respectively. The wavelet smooth
represents the long-term movements.
3.2. The quantile-in-quantile approach
Majority of studies employ classical linear regression model to analyze and estimate the relationship between any two time series data and then move on to the conventional QR technique proposed by Koenker and Bassett (Citation1978). Since the inception of the QR analysis, it has become a common tool to model and analyze the time-varying degree and dependence structure between time-series data. Unlike the classical linear or non-linear regression models, the QR analysis precisely and accurately measures the impact of explanatory variable on the different quantiles of a dependent variable of the given distribution and thereby enabling us to judge the comprehensive relationship between variables across different time periods (see, Koenker, Citation2005). The QR, which is an extension of classical linear regression model, provides information on tail dependence (i.e., upper and lower tails) in addition to the median.
The major weakness of the QR approach is that it cannot capture entire dependency. The QR does not accommodate the possibility that movements of crude oil price may also influence the hedging properties of cryptocurrencies even though it can analyze and estimate the heterogeneous relationship between crude oil and cryptocurrencies at various points of the conditional distribution of crude oil returns. Hence, Sim and Zhou (Citation2015) proposed a quantile-in-quantile (QQ) approach, which is theoretically believed to be the combined product of conventional QR and nonparametric estimations. The QQ technique has been utilized in the field of applied growth and energy economics to empirically investigate how the quantiles that emerge from a variable may affect the conditional quantiles of another variable.
Employing the QQ approach, we model the quantile of crude oil returns (and its frequencies) as a function of the quantile of cryptocurrency returns. The QQ approach provides a clear and more complete picture of dependence by capturing the diverse relationships between the dependent and independent variables at each point of their conditional distributions. The QQ technique is implemented by selecting a number of quantiles of cryptocurrency returns and its various frequencies on the various quantiles of crude oil returns. The study follows Sim and Zhou’s (Citation2015) single equation regression approach, which is also based on Ma and Koenker (Citation2006).
Therefore, the QQ approach used in this study to model the effect of the quantiles of cryptocurrency returns on the quantiles of the crude oil returns has its starting point of representation in the following nonparametric QR equation:
Where denotes crude oil returns at period t,
denotes cryptocurrency returns at period t, θ is the θth quantile of the conditional distribution of
and
is the quantile residual term whose conditional θth quantile is assumed to be zero.
is an unknown function since we lack prior information on the relationship between crude oil and cryptocurrencies returns.
This QR model empirically studies the impact of movements of cryptocurrency returns on crude oil returns while exploring the varying effects of crude oil returns across different quantiles of cryptocurrency returns. The main advantage of this regression specification is the flexibility to capture the functional form of the dependency relationship between crude oil and cryptocurrency returns. Finally, the asymmetric effects of cryptocurrency returns on crude oil returns are possible in response to both negative and positive shocks arising from crude oil returns.
Notably, to establish the relationship between the θth quantile of cryptocurrency returns and the τth quantile of crude oil returns, the local linear regression is used to examine Equationequation 9(9)
(9) in the neighbourhood of
. Given the unknown value of
, the regression function can be expanded via a first-order Taylor expansion around a quantile of
in the following way:
We can redefine and
as
and
based on the study of Sim and Zhou (Citation2015). Accordingly, Equationequation (10)
(10)
(10) can be re-written as follows:
By substituting Equationequation (11)(11)
(11) into Equationequation (9)
(9)
(9) , we arrive at Equationequation (12)
(12)
(12) as follows:
where (*) gives the conditional quantile of θth of cryptocurrency returns. Further, it reveals the actual association between the quantile of cryptocurrency returns (θth) and the quantile of crude oil returns (τth) of parameters and
with indices of θ and τ. As in ordinary least squares (OLS), a similar minimisation is applied to arrive at Equationequation (13)
(13)
(13)
where is the quantile loss function representing as
, i is the function of indicator,
is the kernel density function and h denotes kernel density function bandwidth parameter. The kernel function weights the observations of
where the minimal weights are negatively related to distribution function of
as
.
Employing nonparametric estimation approach makes the choice of bandwidth more critical. The bandwidth offers the smoothness of the resulting estimate by determining the size of the neighbourhood around the target point. More specifically, it shows that the larger bandwidth will produce strong bias in estimates and the smaller bandwidth will also lead to estimates with higher variance. Therefore, the choice of bandwidth matters a lot for this study as it often brings a balance between bias and variance. Following the recent methodical approach of Sim and Zhou (Citation2015), the study uses a bandwidth parameter for our analysis.
4. Data description and preliminary analysis
In this study, we focus on seven large cryptocurrencies (Bitcoin, Ethereum, Litecoin, Das, Ripple, Monero, and Steller) and Brent crude oil prices to achieve our set objectives. The cryptocurrencies sampled have existed for the past 5 years and are among the top 15 currencies by market capitalization. The included commodity is produced on a commercial scale and has significance in international trade. Daily closing market data for the period 10 August 2015 to 18 February 2019 are gleaned from CoinMarketCap for the cryptocurrencies and Bloomberg database for the crude oil and expressed in US dollar to ease comparison and alleviate exchange rate noise (Pukthuanthong & Roll, Citation2009).
We calculated Monday-to-Friday returns for cryptocurrencies due to Brent crude oil not traded on weekends. Following Martens and Poon (Citation2001), we removed the non-synchronous data points to prevent the problem of underestimation of true correlations and regressions. After matching the daily observations of the seven cryptocurrencies with crude oil prices, there were 877 observations. The number of observations in this study is constrained by availability of cryptocurrency price data.
The daily return series of the assets are decomposed into a number of scales depending on the number of observations, and they represent short-, medium- and long-term dynamics of the assets. In line with extant literature, wavelet scales D1, D4 and D6 are taken as representing short-, medium- and long-term movements of the assets as used by Das and Kannadhasan (Citation2018). The summary statistics of cryptocurrencies and crude oil returns at composite and decomposed levels are reported in . The daily average returns of the assets are close to zero at composite level, with cryptocurrencies showing the highest average return, whereas the decomposed levels show zero average returns. The values for standard deviation depict that those cryptocurrencies are more volatile relative to crude oil.
Table 1. Summary statistics of cryptocurrencies and crude oil returns
The skewness and kurtosis of the series indicate that all the returns are skewed and leptokurtic, indicating asymmetry and heavy tail. This non-normality is confirmed by Shapiro-Wilk test of normality, which shows asymmetry in the series at all conventional levels of significance. Further, the return plots of the composite and decomposed series reported in Figure A2 in the appendices exhibit volatility clusters, fat tails, and asymmetry, suggesting nonlinearity. These stylized facts justify the motivation to use wavelet decomposition to model the frequency-dependent volatility of the series and quantile-based technique to model heavy tails of cryptocurrencies and crude oil and examine their association in bullish, normal and bearish market states.
5. Results and discussion
To investigate the asymmetric shock transmission mechanisms between cryptocurrencies and crude oil at different market episodes across time and uncover their hedgingFootnote4 properties, we choose the lower quantiles as bear market where the price of the assets are low, indicating negative shocks to the asset markets, the medium quantile
as normal market where prices are stable with no shock to the asset markets, and upper quantiles
as bull market where prices are high, suggesting positive shocks to the asset markets as used by Selmi et al. (Citation2018) and Mensi et al. (Citation2016). The wavelet scales D1, D4 and D6 represent short-, medium- and long-term movements of the assets, respectively, also indicating trading horizons. We present the results and discussion for QR and QQR in in sections 5.1 and 5.2, respectively.
Table 2. QR estimates for crude oil and cryptocurrencies returns
Table 3. QQR estimates for crude oil and cryptocurrency returns
5.1. QR results for crude oil and cryptocurrencies
Table exhibits the QR estimates for crude oil and cryptocurrency returns, and the plot of these estimates are shown in Figure A1 in the appendices for a further appreciation of the dynamics. The QR estimates on the impact of cryptocurrencies on crude oil reported in Table displays a significant effect of cryptocurrencies on crude oil at some composite levels and some wavelet scales.
For Bitcoin (BTC) market, the medium (D4) and long (D6) scales depict positive effects of Bitcoin on crude oil across all quantiles, suggesting that shocks in Bitcoin market can spillover to crude oil market from the medium to long-term horizons. This finding indicates that Bitcoin do not have hedging properties for extreme oil price movements across time and at the market regimes. This contradicts the findings of Bouri, Azzi et al. (Citation2017a), Al-Yahyaee et al. (Citation2019), Selmi et al. (Citation2018), and Guesmi et al. (Citation2019) who found Bitcoin as a hedge which can reduce the portfolio risk of crude oil. However, the finding provides evidence in support of Kurkaa (Citation2019), who finds Bitcoin as not a hedge for traditional assets due to its positive correlation with the assets.
Ethereum (ETH) displays negative effects on crude oil at the lowest quantile (o.15, 0.10) at the short (D1) and medium (D4) scales. However, Ethereum shows positive effects on crude oil across all quantiles in the long scale (D7). This implies that extreme market fluctuations in Ethereum do not have an impact on crude oil market and that Ethereum can hedge the position of crude oil investors at bear market in the short and medium-time horizons. However, Ethereum cannot hedge oil market risk in the long term as shocks in Ethereum market have the possibility of transmitting to crude oil market. For Litecoin (LTC), we observe a highly significant positive effect on crude oil across all quantiles at both medium (D4) and long (D6) scales, indicating that Litecoin does not have hedging properties for extreme oil market downturns at all market state across the investment horizons since shocks in Litecoin market can transmit to crude oil market across all time horizons. We confirm the findings of Corbet et al. (Citation2018) that support the hedging properties of Litecoin for crude oil. The short scale of Monero (XMR) depicts that movement of Monero has positive effect on crude oil prices at quantiles (0.30 to 0.90). The medium-term movement of Monero has negative effects on crude oil at lower quantiles (0.05, 0.10) and upper quantiles (0.90, 0.95) but positive effects at quantiles (0.30 to 0.50). Nonetheless, the long scale of Monero shows positive association across all distribution. This finding shows the possibility of market discrepancies spilling over from Monero market to crude oil market in the short- and long terms and that hedging strategies are only feasible at the bear (bull) market states in the medium term for oil traders when oil price is very low and very high. The findings on Ethereum and Monero complement previous studies such as Chuen et al. (Citation2017), Corbet et al. (Citation2018), and Selmi et al. (Citation2018), who demonstrated that these digital currencies are new tools to diversify portfolios and reduce risk.
In the case of Ripple (XRP), we find negative association from (0.35 to 0.80) at the composite scale, the quantiles (0.35 to 0.60) at the short scale, across all quantiles at the medium scale and at lower quantiles (0.05 to 0.15) at the long scale. The quantiles (0.20 through to 0.85) depict highly significant positive connections with crude oil at the long scale. The implication of the results is that crude oil investors can use Ripple to hedge negative shocks in crude oil price at bear market in the short and long terms but all market conditions in the medium term whether oil price is in upside, normal or downside regime. The Das (DASH) market behaves similar to Bitcoin and Litecoin markets with positive effects on crude oil at both medium and long scales, implying that Das cannot hedge oil market turmoil at any of the market states across the horizons since Das behaves just like crude oil across all quantiles in the various investment horizons. With regards to Steller (XLM), we find positive impact on crude oil in the short scale at quantiles (0.05 to 0.30), all quantiles in the medium scale but negative impact at lower quantiles (0.05, 0.10) and upper quantiles (0.70 to 0.95) in the long scale. This result indicates that Steller has hedging properties for oil investors at bear and bull markets in the long term when there are both negative and positive shocks in crude oil price. The findings on Steller and Ripple is in line with the works of Corbet et al. (Citation2018), Chuen et al. (Citation2017), and Selmi et al. (Citation2018), who reported that cryptocurrencies have diversification benefits for traditional assets including crude oil.
To sum it all up, our findings undermine the hedging potentials of Bitcoin, Litecoin and Das markets for crude oil crises and suggest that Bitcoin, Litecoin and Das market disruptions may spread to crude oil market at the various market conditions across the time horizons. However, Ethereum can hedge against oil market turmoil at bearish regime when oil price is very low in the short- and medium-time horizons. Hedging properties are feasible using Monero in the medium term at both bull and bear regimes. In the short-, medium- and long-term and at all market states, Ripple can hedge against oil market crises. Lastly, investors can use Steller to hedge oil crises in the long term when oil price is in very low and high states.
In general, the findings for Bitcoin, Litecoin and Das markets contradict the findings of Selmi et al. (Citation2018), Dyhrberg (Citation2016), Bouri et al. (Citation2017a), Corbet et al. (Citation2018), who discussed that Bitcoin and altcoins are safe havens, diversifiers and hedges for crude oil market. However, the findings on Ethereum, Monero, Steller and Ripple complement previous studies such as Lee et al. (Citation2017), Corbet et al. (Citation2018), and Selmi et al. (Citation2018), who demonstrated that these digital currencies are new tools to diversify portfolios and reduce risk.
5.2. QQR Results for crude oil and cryptocurrencies
The QR estimates the heterogeneous response of crude oil to cryptocurrencies across quantiles of the conditional distribution of crude oil returns. However, it neglects the possibility that crude oil prices in low, normal or high regimes can also impact the hedging properties of cryptocurrencies. Thus, QR estimates a unidirectional effect of cryptocurrencies on crude oil, while QQR investigates the bidirectional association (reverse causality) between crude oil and cryptocurrencies. Therefore, we combine these two approaches to explore the entire dynamic dependencies of the assets.
The QQR estimates reported in in the appendices do not show significance levels because QQR is nonparametric technique but can be validated with parametric QR coefficients. As Bouri, Gupta et al. (Citation2017) notes, the estimates generated by QR are decomposed into the specific quantiles of the explanatory variables by the QQR.
The QQR estimates on the asymmetric associations between cryptocurrencies and crude oil show larger coefficients relative to QR estimates. The upper half of the distribution depicts negative effects at quantiles (0.05 to 0.50) across all time scales (short, medium and long scales), while the lower half of the distribution exhibits positive effect at quantiles (0.55 to 0.95) across the trading horizons. The implication of this finding is that, under bearish and normal market states , shocks in the price of cryptocurrencies do not influence crude oil price, while shocks in crude oil price do not also affect cryptocurrency prices, suggesting that both assets can hedge the crises of each other in the short-, medium- and long-term horizons.
However, market discrepancies from either of the markets can spillover to the other at bull regimes across time, implying that neither of the asset markets is a hedge for the other at bull market across time. This finding is in line with Chuen et al. (Citation2017), Corbet et al. (Citation2018) and Selmi et al. (Citation2018), who illustrated that cryptocurrencies are new tool to diversify portfolios and reduce risk. The QQR estimates for crude oil and cryptocurrencies are shown in Table .
We plot the coefficients of both QR and QQR to test the validity of QQR. The line plots of the coefficients of QR and QQR in Figure A1 in the Appendices depict that QR estimates largely confirm QQR by the closeness in pattern of both QQR and QR across time-scales and quantiles which only differ in magnitude thereof. This shows the appropriateness of employing both techniques in this study. The pictorial view shown by the line plots of QQR and QR displays the bear and bull trends in crude oil and cryptocurrency markets.
6. Conclusion and policy implication
This study evaluates the asymmetric shock transmission mechanisms between cryptocurrencies (Bitcoin, Ethereum, Litecoin, Ripple, Das, Monero and Steller) and crude oil applying a relatively new technique wavelet-based QQR analysis. We applied the MODWT to decompose the daily return series of cryptocurrencies and crude oil into wavelet scales D1, D4 and D6 representing the short-, medium-, and long-term trade horizons, respectively. We then applied QR and QQR introduced by Koenker and Bassett (Citation1978) and Sim and Zhou (Citation2015), respectively, on the decomposed series to establish the association between the asset markets over 19 quantiles to capture the bear (bull) market conditions.
Both QR and QQR results highlight heterogeneous effect of movement of cryptocurrencies on crude oil returns across quantiles and time scales. Specifically, the QR results suggest that Bitcoin, Litecoin and Das do not have hedging characteristics for extreme oil price movements at bear (bull) markets across time. However, hedging possibilities are feasible from the medium to long terms for crude oil investors using Ethereum, Monero, Ripple and Steller at both bear and bull markets.
The results from QQR show negative associations between the assets at bear market but positive relations at bull market, indicating hedging possibilities for the assets in the bear market. Thus, economic actors can hedge their downside risk across time using either of the assets at bear market. Our finding is consistent with Bernanke et al. (Citation1996), flight to safety phenomenon where investors and traders use less risky assets to hedge their positions during economic crises.
The empirical literature highlights different dimensions on the effects of cryptocurrencies on crude oil returns (Henriques & Sadorsky, Citation2018; Klein et al., Citation2018; Kurkaa, Citation2019; Selmi et al., Citation2018; Shahzada et al., Citation2019). Our findings go beyond the findings of these studies by demonstrating that the connections between the assets is sensitive to different market conditions in different horizons. This study has practical implication for crude oil and cryptocurrency dynamic dependencies for hedging in order to reduce downside risk in crude oil market. Although cryptocurrencies exhibit excess price volatility, our study shows that it would be very profitable if investors incorporate them in a diversified portfolio which is consistent with the findings of Eisl et al. (Citation2015), and Bouri et al. (Citation2017c).
This study may help policy makers and investors to understand the microstructure and dynamics in the cryptocurrency and crude oil markets across time for regulating the general financial system. Knowledge on the interconnectedness between cryptocurrencies and crude oil markets across time is critical since shocks to the cryptocurrency market may have rippling effects on the crude oil market. This study confirms the heterogeneous market hypothesis by Müller et al. (Citation1993) which posit a time-varying connectedness between asset markets. Future studies can explore the impact of cryptocurrencies on the broader commodity market controlling for global uncertainties.
Disclosure statement
No potential conflict of interest was reported by the author(s).
Additional information
Funding
Notes on contributors
Seyram Pearl Kumah
DR. SEYRAM PEARL KUMAH is a Lecturer in Accounting and Finance at the Akenten Appiah-Menka University of Skills Training and Entrepreneurial Development, Kumasi, Ghana. She is also a chartered accountant with 13 years’ experience in Auditing, Financial Accounting and Management Accounting practices.
Prof. Jones Odei-Mensah PROF. JONES ODEI-MENSAH is a senior faculty member at the University of the Witwatersrand, where he directs the Wits Business school’s Postgraduate Diploma in Management programme. Jones consults with multilateral organisations such as the African Export-Import Bank and the African Union; multinational professional services networks such as KPMG; think tanks such as the African Center for Economic Transformation; serves as a Board member on a few organisations, including the AREF Consult and Nile Valley Group. growth, and policy stabilisation. In recognition of his research impact, the National Research Foundation (NRF) awarded him a Y2 rating in January 2022.
Notes
2. The heterogeneous market hypothesis propounded by Müller et al. (1993) argues that economic agents in financial markets are not homogeneous, all possesses the same information and objectives and thus operates at the same time and frequency.
3. Given the sample size of 877 observations and maximum scale number of decomposition possibility of 2, where
is the number of observations, we could have decomposed the series into nine details and one smooth component.
4. Based on the definitional approach conducted by Kaul and Sapp (Citation2006), Baur and Lucey (Citation2010), Reboredo (Citation2013) and Baur and Lucey (Citation2010), the distinctive characteristics of an asset as a safe haven, hedge and diversifier is as follows: An asset is a hedge if it exhibits a negative correlation in normal states. An asset is a safe haven if it is negatively correlated with another asset in times of market turmoil. An asset is a diversifier if it is positively but weakly correlated with another asset on average.
References
- Al-Yahyaee, K., Mensi, H., Al-Jarrah, W., I, M., Hamdi, W., & Kang, S. (2019). Volatility forecasting, downside risk and diversification benefits of bitcoin and oil and international commodity markets: a comparative analysis with yellow metal. The North American Journal of Economics and Finance, 49(1), 104–25. https://doi.org/10.1016/j.najef.2019.04.001
- Baek, C., & Elbeck, M. (2015). Bitcoins as an investment or speculative vehicle? A first look. Applied Economics Letters, 22(1), 30–34. https://doi.org/10.1080/13504851.2014.916379
- Barunik, J., & Krehlik, T. (2018). Measuring the frequency dynamics of financial and macroeconomic connectednessand systemic risk. Journal of Financial Econometrics, 16(2), 271–296.
- Baur, D., Mc Dermontt, T., & K, J. (2010). Is Gold a Safe Haven? International Evidence. Journal of Banking and Finance, 34(8), 1886–1898. https://doi.org/10.1016/j.jbankfin.2009.12.008
- Baur, D. G., & Lucey, B. M. (2010). Is gold a hedge or a safe haven? an analysis of stocks, bonds and gold. Financial Review, 45(2), 217–229. https://doi.org/10.1111/j.1540-6288.2010.00244.x
- Baur, D., Dimpfl, G., & Kuck, K. (2018). Bitcoin, gold and the us dollar–a replication and extension. Finance Research Letters, 25, 103–110. https://doi.org/10.1016/j.frl.2017.10.012
- Baur, D., Hong, G., & Lee, A. (2018). Bitcoin: medium of exchange or speculative assets? Journal of International Financial Markets, Institutions and Money, 54, 177–189. https://doi.org/10.1016/j.intfin.2017.12.004
- Bernanke, B., Gertler, M., & Gilchrist, S. (1996). The financial accelerator and the flight to quality. National Bureau of Economic Research. No. w4789
- Bouri, E., Gupta, R., Tiwari, A. K., & Roubaud, D. (2017). Does Bitcoin Hedge Global Uncertainty? Evidence from Wavelet-based Quantile-in-Quantile Regressions. Finance Research Letters, 23(1), 87–95. https://doi.org/10.1016/j.frl.2017.02.009
- Bouri, E., Azzi, G., & Dyhrberg, A. (2017a). On the return-volatility relationship in the bitcoin market around the price crash of 2013. Economics: The Open-Access, Open-Assessment E-Journal, 11(2), 1–16. http://dx.doi.org/10.5018/economics-ejournal.ja.2017-2
- Bouri, E., Jalkh, N., Molnr, P., & Roubaud, D. (2017b). Bitcoin for Energy Commodities before and after the December 2013 Crash: Diversifier, Hedge or Safe Haven? Applied Economics, 49(50), 5063–5073. https://doi.org/10.1080/00036846.2017.1299102
- Bouri, E., Molnár, P., Azzi, G., Roubaud, D., & Hagfors, L. I. (2017c). On the Hedge and Safe Haven Properties of Bitcoin: Is it really more than a Diversifier? Finance Research Letters, 20(1), 192–198. https://doi.org/10.1016/j.frl.2016.09.025
- Bouri, E., Mahamitra, D., Gupta, R., & Roubaud, D. (2018). Spillovers between bitcoin and other assets during bear and bull markets. Applied Economics, 50(55), 5935–5949. https://doi.org/10.1080/00036846.2018.1488075
- Catania, L., Grassi, S., & Ravazzolo, F. (2018). Forecasting Cryptocurrencies Financial Time Series. In CAMP working paper series. Norwegian Business School. http://hdl.handle.net/11250/2489408
- Chan, S., Chu, J., Nadarajah, S., & Osterrieder, J. (2017). A statistical analysis of cryptocurrencies. Journal of Risk and Financial Management, 10(12), 1–23. https://doi.org/10.3390/jrfm10020012
- Chuen, D. L. K. Guo, L., & Wang, Y. (2017). Cryptocurrency: A new investment opportunity? The Journal of Alternative Investments, 20(3), 16–40. https://doi.org/10.3905/jai.2018.20.3.016
- Ciaian, P., Rajcaniova, M., & Kancs, D. A. (2016). The economics of bitcoin price formation. Applied Economics, 48(19), 1799–1815. https://doi.org/10.1080/00036846.2015.1109038
- Corbet, S., Meegan, A., Larkin, C., Lucey, B., & Yarayova, L. (2018). Exploring the dynamic relationships between cryptocurrencies and other financial assets. Economics Letters, 165, 28–34. https://doi.org/10.1016/j.econlet.2018.01.004
- Cornish, C., Bretherton, R., C, S., & Percival, D. (2006). Maximal overlap wavelet statistical analysis with application to atmospheric turbulence. Boundary-Layer Meteorology, 119(2), 339–374. https://doi.org/10.1007/s10546-005-9011-y
- Coudert, V., Mignon, V., & Penot, A. (2008). Oil Price and the Dollar. Energy Studies Review, 15(2). https://doi.org/10.15173/esr.v15i2.508
- Das, D., & Kannadhasan, M. (2018). Do global factors impact bitcoin prices? evidence from wavelet approach. Journal of Economic Research, 23, 227–264.
- Diebold, F. X., & Yilmaz, K. (2012). Better to give than to receive: predictive directional measurement of volatility spillovers. International Journal of Forecasting, 28(1), 57–66. https://doi.org/10.1016/j.ijforecast.2011.02.006
- Dyhrberg, A. H. (2015b). Bitcoin, gold and the dollar – a garch volatility analysis. Finance Research Letters, 16, 85–92. https://doi.org/10.1016/j.frl.2015.10.008
- Dyhrberg, A., & H. (2016). Hedging Capabilities of Bitcoin. Is it the Virtual Gold?. Finance Research Letters, 16, 139–144.
- Eisl, A., Gasser, S. M., & Weinmayer, K. (2015). Caveat Emptor: Does Bitcoin Improve PortfolioDiversification? SSRN Electronic Journal. https://doi.org/10.2139/ssrn.2408997
- Fantazzini, D., Nigmatullin, E., Sukhanovskaya, V., & Ivliev, S. (2016). Everything you always wanted to know about bitcoin modelling but were afraid to ask. Applied Econometrics, Forthcoming. https://ssrn.com/abstract=2794622
- Gençay, R., Selçuk, F., & Whitcher, B. (2002). An introduction to wavelets and other filtering methods in finance and economics. Academic Press.
- Gkillas, K., & Katsiampa, P. (2018). An application of extreme value theory to cryptocurrencies. Economics Letters, 164, 109–111. https://doi.org/10.1016/j.econlet.2018.01.020
- Guesmi, K., Saadi, S., Abid, I., & Ftiti, Z. (2019). Portfolio diversification with virtual currency: evidence from bitcoin. International Review of Financial Analysis, 63, 431–437. https://doi.org/10.1016/j.irfa.2018.03.004
- Henriques, I., & Sadorsky, P. (2018). Can bitcoin replace gold in an investment portfolio? Journal of Risk and Financial Management, 11(3), 48. https://doi.org/10.3390/jrfm11030048
- Huynh, T., & L, D. (2019). spillover risks on cryptocurrency markets: A Look from VAR-Svar granger causality and student’s-t copulas. Journal of Risk and Financial Management, 12(2), 52. https://doi.org/10.3390/jrfm12020052
- Ji, Q., Bouri, E., Gupta, R., & Roubaud, D. (2018a). Network causality structures among bitcoin and other financial assets: a directed acyclic graph approach. The Quarterly Review of Economics and Finance, 70, 203–213. https://doi.org/10.1016/j.qref.2018.05.016
- Ji, Q., Bouri, E., Roubaud, D., & Kristoufek, L. (2019). Information Interdependence among energy, cryptocurrency and major commodity markets. Energy Economics, 81, 1042–1055. https://doi.org/10.1016/j.eneco.2019.06.005
- Kaul, A., & Sapp, S. (2006). Y2K fears and safe haven trading of the US dollar. Journal of International Money and Finance, 25(5), 760–779. https://doi.org/10.1016/j.jimonfin.2006.04.003
- Klein, T., Thu, H., & Walther, T. (2018). Bitcoin is not the new gold–A comparison of volatility, correlation, and portfolio performance. International Review of Financial Analysis, 59, 105–116. https://doi.org/10.1016/j.irfa.2018.07.010
- Koenker, R., & Bassett, G. (1978). Regression quantiles. Econometrica, 46(1), 33–50. https://doi.org/10.2307/1913643
- Koenker, R. (2005). Quantile Regression. Cambridge University Press.
- Krugman, P. R. (2008). International Economics: Theory and policy, 8/E. Pearson Education India.
- Kurkaa, J. (2019). do cryptocurrencies and traditional asset classes influence each other? Finance Research Letters, 38, 38–46. https://doi.org/10.1016/j.frl.2019.04.018
- Ma, L., & Koenker, R. (2006). Quantile regression methods for recursive structural equation models. Journal of Economics, 134(2), 471–506. https://doi.org/10.1016/j.jeconom.2005.07.003
- Markowitz, H. (1952). Portfolio Selection. The Journal of Finance, 7(1), 77–91.
- Martens, M., & Poon, S. H. (2001). Returns Synchronization and Daily Correlation Dynamics between International Stock Markets. Journal of Banking and Finance, 25(10), 1805–1827. https://doi.org/10.1016/S0378-4266(00)00159-X
- Mensi, W., Hammoudeh, S., Tiwari, A., & K. (2016). New Evidence on Hedges and Safe Havens for Gulf Stock Markets using the Wavelet-Based Quantile. Emerging Markets Review, 28, 155–183.
- Mishra, S., Sharif, A., Khuntia, S., Meo, S. A., & Khan, S. A. R. (2019). Does oil prices impede Islamic stock indices? fresh insights from wavelet-based quantile-on-quantile approach. Resources Policy, 62, 292–304. https://doi.org/10.1016/j.resourpol.2019.04.005
- Müller, U. A., Dacorogna, M. M., Davé, R. D., Pictet, O. V., Olsen, R. B., & Ward, J. R. (1993). Fractals and Intrinsic Time: A Challenge to Econometricians. Unpublished Manuscript, Olsen & Associates, Zürich.
- Palombizio, E., & Morris, I. (2012). Forecasting exchange rates using leading economic indicators open access scientific reports. 1(8), 1–6. https://doi.org/10.4172/scientificreports
- Percival, D. B. (1995). On Estimation of the Wavelet Variance. Biometrika, 82(3), 619–631. https://doi.org/10.1093/biomet/82.3.619
- Percival, D., Mofjeld, B., & H, O. (1997). Analysis of subtidal coastal sea level fluctuations using wavelets. Journal of the American Statistical Association, 92(439), 868–880. https://doi.org/10.1080/01621459.1997.10474042
- Percival, D., & Walden, A. T. (2000). Wavelet methods for time series analysis, vol. 4 of Cambridge series in statistical and probabilistic mathematicS. Cambridge University Press.
- Popper, N. (2015). Digital gold: The Untold Story of Bitcoin. Penguin UK.
- Pukthuanthong, K., & Roll, R. (2009). global market integration: an alternative measure and its application. Journal of Financial Economics, 94(2), 214–232. https://doi.org/10.1016/j.jfineco.2008.12.004
- Ramsey, J. B. (2002). Wavelets in economics and finance: past and future. Studies in Nonlinear Dynamics & Econometrics, 6(3), 1–29. https://doi.org/10.2202/1558-3708.1090
- Reboredo, J. C. (2013). Modeling EU allowances and oil market interdependence. Implications for Portfolio Management. Energy Economics, 36, 471–480. https://doi.org/10.1016/j.eneco.2012.10.004
- Rogojanu, A., & Badea, L. (2014). The issue of competing currencies. Theoretical and Applied Economics, XXI(590), 103–114.
- Selmi, R., Mensi, W., Hammoudeh, S., & Bouoiyour, J. (2018). Is bitcoin a hedge, a safe haven or a diversifier for oil price movements? A comparison with gold. Energy Economics, 74, 787–801. https://doi.org/10.1016/j.eneco.2018.07.007
- Shahzada, H., J, S., Bourib, E., Roubaudc, D., Kristoufekd, L., & Lucey, B. (2019). Is bitcoin a better safe-haven investment than gold and commodities? International Review of Financial Analysis, 63, 322–330. https://doi.org/10.1016/j.irfa.2019.01.002
- Sim, N., & Zhou, A. (2015). oil prices, us stock return, and the dependence between their quantiles. Journal of Banking and Finance, 55, 1–8. https://doi.org/10.1016/j.jbankfin.2015.01.013
- van Wijk, D. (2013). What can be expected from the BitCoin. Erasmus Universiteit Rotterdam, 18.
- Vandezande, N. (2017). Virtual Currencies under EU Anti-Money Laundering Law. Computer Law & Security Review, 33(3), 341–353. https://doi.org/10.1016/j.clsr.2017.03.011
- Wu, C. Y., Pandey, V. K., & Dba, C. (2014). The value of Bitcoin in enhancing the efficiency of an investor’s portfolio. Journal of Financial Planning, 27(9), 44–52. https://doi.org/10.1016/j.clsr.2017.03.011
- Yermack, D. (2013). Is bitcoin a real currency? an economic appraisal. (No. w19747). National Bureau of Economic Research. http://www.nber.org/papers/w19747
- Zhang, X., Yu, L., Wang, S., & Lai, K. K. (2009). Estimating the impact of extreme events on crude oil price: An EMD-Based event analysis method. Energy Economics, 31(5), 768–778. https://doi.org/10.1016/j.eneco.2009.04.003
Appendices
Figure A1. Plot of QR and QQR coefficients of crude oil and cryptocurrencies.
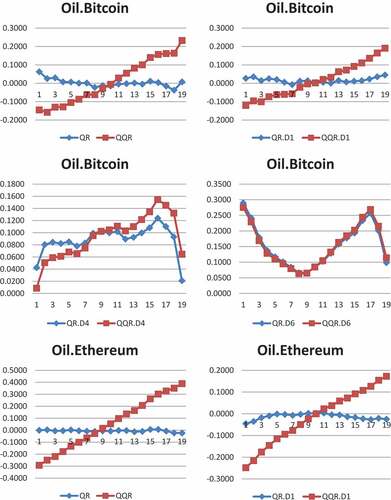
Figure A1. Continued.
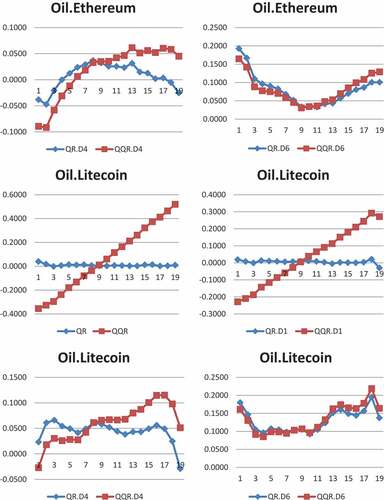
Figure A1. Continued.
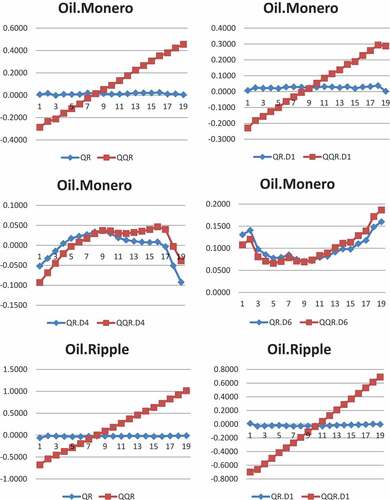
Figure A1. Continued.
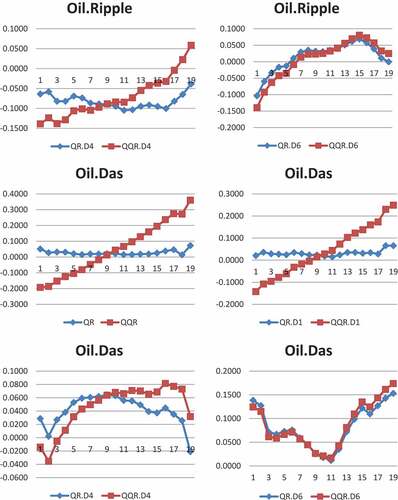
Figure A1. Continued.
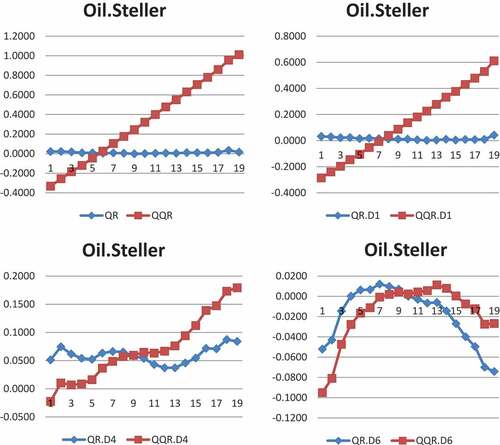
Figure A2. Time series plots of crude oil and cryptocurrency returns.
Figure A2. Continued.