
 ?Mathematical formulae have been encoded as MathML and are displayed in this HTML version using MathJax in order to improve their display. Uncheck the box to turn MathJax off. This feature requires Javascript. Click on a formula to zoom.
Abstract
The study examined the relationship between firm life cycle (FLC) and earnings management (EM) in the Vietnamese context with the moderating role of state ownership (SOE). We used the sample of 622 Vietnamese listed companies over the period 2010–2019. To eliminate autocorrelation and heteroscedasticity violations, we utilized FE Robust on all models. The data show that accrual earnings management (AEM) behavior varies between FLC phases. The results revealed a U-shaped pattern, with discretionary accruals (DAs) being more remarkable in the introduction and decline stages and lower in the remaining stages. The findings on the connection between FLC and real earnings management (REM) varied depending on the REM technique used. The results support the involvement of SOE as a moderator in both the FLC—REM and the FLC—EM relationship. This study significantly contributed to the existing literature about FLC and EM behavior.
PUBLIC INTEREST STATEMENT
Vietnam is a country with an incomplete legal framework for protecting investors and inefficiency in the corporate governance mechanism. With the rapid development of the financial market, the firm life cycle term attracts much attention from scholars and other related parties to select the most appropriate strategy for firms in each state. Although the FLC was ascertained for its impact on the organization’s development in existing literature, the relationship between FLC and characteristics of earnings management is rarely explored by prior studies. Therefore, this is the first study to explore the relationship between firm life cycle and earnings management behaviors along with the moderating effect of state-ownership in the Vietnamese context. Depending on each stage and the method of earnings management, the relationship between earnings management and the firm life cycle is different. This study significantly contributed to the existing literature about FLC and EM behavior.
1. Introduction
Based on life cycle theory, Miller and Friesen (Citation1980) argued that each phase in developing an organization will have a different strategy, structure, and decision-making methodology to meet the firm’s objective. Therefore, analyzing firm life cycle (FLC) could help managers, investors, and other related parties predict firms’ operation patterns in different development stages. Recently, the FLC topic has attracted much attention from scholars; many aspects were found that have a correlation with FLC, such as corporate social responsibility (Hsu, Citation2018; B.-J. Park & Lee, Citation2020); dividend policy (Trihermanto & Nainggolan, Citation2018); financial reporting quality (Krishnan et al., Citation2020); risk of bankruptcy (Durana et al., Citation2021); tax avoidance (Irawana & Afifb, Citation2020). Examine the development cycle in connection to research themes that researchers are interested in. During the stages of the development cycle, some studies consider accruals earnings management (AEM)/real earnings management (REM; Durana et al., Citation2021; Hussain et al., Citation2020; Liu, Citation2006), business strategy (Jawahar & McLaughlin, Citation2001; Miller & Friesen, Citation1984; Verreynne & Meyer, Citation2010), corporate governance (Ramaswamy et al., Citation2007), tax avoidance (Hasan et al., Citation2017) and corporate social responsibility (Hasan & Habib, Citation2017a).
Despite the FLC was ascertained for its impact on the development of the organization in existing literature, the relationship between FLC and characteristics of earnings management (EM) is rarely explored by prior studies. FLC is an inherited and time-varying phenomena that aids in the prediction of a firm’s cash holdings, risk-return dilemma, capital structure, dividend payout, debt maturity structure, investment criteria, and reporting quality, among other things (M. Akbar et al., Citation2020; Deangelo et al., Citation2006; Hasan et al., Citation2017; Hasan & Habib, Citation2017a). Existing literature in the context of EM reveals that the institutional environment, cost of capital, audit quality, financing restrictions, diversification, and asymmetric knowledge all impact enterprises’ EM activities (Abad et al., Citation2018; Alzoubi, Citation2018; Habib et al., Citation2019; Hasan et al., Citation2017). Firm risk taking is higher (lower) throughout the introduction (growth and maturity) phase of FLC, according to Habib and Hasan (Citation2017). In addition, Hasan et al. (Citation2017) suggested a substantial link between FLC phases and tax avoidance tactics. They discovered that, in comparison to the shake-out stage, the introduction (growing and mature) stages had a favorable (negative) relationship with business tax avoidance strategies. Furthermore, there is a strong link between financial crisis and EM founded by prior studies (Jacoby et al., Citation2019; Li et al., Citation2020). The likelihood of financial distress/bankruptcy varies according on the stage of FLC (A. A. Akbar et al., Citation2019). As a result, it’s plausible to assume that management EM techniques behave differently at different periods of FLC. The corporate life cycle has its origins in the literature of organizational science. According to studies Adizes (Citation1979); Miller and Friesen (Citation1984), firms at different stages of their life cycle have distinct characteristics such as ownership structure (Faff et al., Citation2016), financial and investment activities, accounting techniques (Moores & Yuen, Citation2001), but also earnings management characteristics such as the value of accruals (Chen, Citation2016; Kovacova et al., Citation2018). However, no empirical study has been designed to explore the possible effects of FLC stages on the EM behavior of firms in the context of a developing country such as Vietnam. Therefore, the prime objective of this study is to shed light on the influence of FLC stages on the EM in an emerging market such as Vietnam.
According to Dickinson (Citation2011), the development cycle has five stages: introduction, growth, maturity, shake-out, and decline. Dickinson (Citation2011) used the signatures of the components of the cash flow statement to classify the different eras. Dickinson (Citation2011) used this metric to track changes in business performance (profit margin, earnings sustainability, and asset turnover) over the course of a company’s life cycle. The stage of the business development cycle, according to (Dickinson, Citation2011), has an impact on business performance and resource allocation. The most efficient way to reflect a company’s economy and market activity is through its cash flow patterns. As a result, this study uses this metric to give a holistic view of the entire life cycle (Ahmed et al., Citation2020; A. A. Akbar et al., Citation2019; M. Akbar et al., Citation2020; M., Citation2021; Habib & Hasan, Citation2019; K. Park, Citation2017; Wang et al., Citation2020).
The theory of the company’s life cycle depicts the company’s development from the start-up stage through maturity and decline (Mueller, Citation1972). The growth cycle of a firm is not the same as the life cycle of a product or industry. This cycle is considered as a collection of overlapping but different stages in the product lifecycle (Dickinson, Citation2011). Growth cycle analysis aims to categorize a company’s annual data into similar categories using fundamental and technical analysis, and then use these categories as a framework for analysis to different degrees. In the company’s development cycle, there are a variety of motives, restraints, and tactics that are linked to business actions and performance. According to Black (Citation1998), each stage of the development cycle will be more uniform in terms of the company’s financial features. Empirical research has confirmed the notion that EM varies over the life cycle phases and, thus, is more similar to this study’s method. Krishnan et al. (Citation2020) investigate the impact of life cycle stages on financial reporting quality through the use of anomalous accruals and abnormal revenues, among other metrics. They suggest that organizations in the early stages have greater incentives to engage in EM strategies than mature companies, and that managers’ judgment and experience in estimating accruals may fluctuate throughout phases. According to their findings, absolute abnormal accruals and abnormal revenues are lower for mature enterprises and greater in the remaining phases with an inverted U-shaped pattern. Similarly, Kale and Almeida (Citation2019) investigated the impact of the firm’s life cycle stages on the quality of accruals. The authors show that businesses in the introduction and decline (mature) phases have the lowest (highest) accrual quality. As a result, such relevant literature implies that the life cycle stages have considerable influence on AEM. In conclusion, the FLC have influence on the magnitude of firm’s earnings manipulation.
The nature of the interconnections between these stages may be explained by differences in resource reallocation and operational, investment, and financial decisions taken during the stages of the business growth cycle. Earnings management and operational efficiency are two important factors to consider. Early management science study defined distinct stages of the growth cycle as initiation, growth, maturity, revival, and decline (Miller & Friesen, Citation1984) or entrepreneurship, growth, maturity, shake-out, and decline (Gort & Klepper, Citation1982). Variations in environment, strategy, organization, and decision-making approach characterize each stage (Miller & Friesen, Citation1984). Dickinson (Citation2011) expands on the stages of the corporate development cycle by examining variances in operations, investments, and financing activities, as well as a shifting cash-to-operations pattern. This activity is being taken in order to better understand performance variances. Throughout the development phase, cash flow, efficiency, development, hazard, and allocating resources all change consistently. While several stages of diversity have been recognized, firm’s developments are inevitable and are influenced by product and geographic diversification, innovation, mergers and acquisitions, structural shifts, and economic disruptions (Dickinson, Citation2011). During the global financial crisis of 2008, some organizations may have quickly shifted to shake-out or decline before rebounding. Furthermore, sudden fluctuations in commodities prices can lead businesses to shift from growth to shake-out occasionally within the overall developmental phase of the growth cycle, while innovation in a particular searched pharmaceutical product can drive a time of high growth.
This study significantly contributes to the existing literature about FLC and EM because of several reasons. First, very little study has been done in developing countries on the association between life cycle and EM. Most prior studies on this link were primarily conducted in developed markets (Durana et al., Citation2021; Hussain et al., Citation2020), so this study would shed light on the impact of FLC on EM in the context of Vietnamese, an emerging market. Second, prior research’ findings have not always been consistent, therefore investigations in varied situations will help to clarify variations between countries. In addition, the study also explores all five stages of the business life cycle instead of only evaluating a few stages like previous studies. The findings are an outstanding contribution to future research. Finally, the study investigates the regulatory impact of state ownership (SOE) on the previously mentioned relationship. Because of national features, the legal structure provides little protection for investors, which is an institutional distinction and SOE is also typical ownership that prevails in Vietnam (Kabir & Thai, Citation2017).
The study then continues to an examination of the impact of the firm development life cycle on earnings management in both accrual and real activities, as well as the impact of SOE on the life cycle and EM connection. The following is how we plan to organize this paper. Section 2 examines the theoretical and hypothesis development. The study methodologies, models, and data are presented in Section 3. In part 4, we provide the study’s findings, followed by conclusions and some recommendations in section 5.
2. Theoretical framework and hypothesis development
The importance of the development cycle to EM has been emphasized in previous studies. Hribar and Yehuda (Citation2015) show how the proportional importance of DAs on firm growth varies depending on the phase of the development cycle. Differences in the importance of financial reporting information, such as revenue growth, capital investment, earnings and book value, and earnings forecasting, are also explained by the company’s growth cycle (Ahmed et al., Citation2020; A. A. Akbar et al., Citation2019; M. Akbar et al., Citation2020; M., Citation2021; Dickinson et al., Citation2018; Habib & Hasan, Citation2019; K. Park, Citation2017; Wang et al., Citation2020).
There are various aspects of profitability that contribute to a company’s value. First, it is the income stream that delivers the estimated value for profit/earnings to be useful in predicting stock values. According to Vorst and Yohn (Citation2018), future forecasting at each stage of the development cycle leads to higher forecasting accuracy than independent industry members’ forecasts. Furthermore, Anthony and Ramesh (Citation1992) argue that financial statement data provide reliable information regarding a condition’s earning potential and associated earnings responses at the growth cycle stage. As a result, organizations that have reached maturity, or are in a steady condition, will provide the most consistent income streams.
Because these companies make big investments that are supported by stakeholders outside the company, cash outflows for operations, investments, and financing activities are common at the start-up stage (Jensen, Citation1986; Jovanovic, Citation1982; Spence, Citation1977, Citation1979). To develop, introduce, and promote a new product, large investments are necessary in phases (Spence, Citation1979). As a result, investment in operating assets raises the buildup of working capital (inventory) by a large amount during the startup phase (Durana et al., Citation2021; Hussain et al., Citation2020). A significant investment in working capital, in addition to cash expenditures for business operations, leads in a bigger coefficient of variation in cash sales than in the start-up phase. Furthermore, organizations steadily acquire fixed assets throughout this stage, although the amount obtained and depreciation expense are minimal in comparison to the amounts acquired and depreciation expense during the growth and maturity stages (Dickinson, Citation2011). As a result, in terms of depreciation expense, the absolute value of the coefficient on PPE is likely to be lower in the start-up period than in other periods.
According to Jovanovic (Citation1982), cash flows from operating and investing activities of companies in the start-up and growth stages are frequently negative because management optimism motivates companies to invest early in order to develop. competitors’ ability to enter the market. Furthermore, the anticipation of high future profits generates an incentive for managers to overinvest in the present, according to Durana et al. (Citation2021); Hussain et al. (Citation2020), which suggests that organizations are at the start-up and growth stages.
Hypothesis 1A: Introduction stage is positively related to AEM.
Hypothesis 2A: Growth stage is mixed related to AEM.
Previous research has found that the stage of the business cycle and performance have an impact on earnings data. According to Burgstahler and Dichev (Citation1997), earnings contribute more to value when the business’s current operating activities are successful, implying that earnings are more appropriate for the company during its growth and maturity stage. Basu (Citation1997), on the other hand, shows that bad news spreads faster than positive news due to financial statement asymmetry. Because the most advantageous period for a company to make a loss is during the introduction and decline stages. Companies in the maturation and decline stages, on the other hand, will cut back on investments in new assets and activities. Instead of making new investments, companies will focus on fixing current assets. As a result, managers in mature and declining organizations place more emphasis on the disadvantage of earnings manipulation because they have fewer future profits growth cycles to compensate for it (Durana et al., Citation2021; Hussain et al., Citation2020). In conclusion, theories and empirical research imply that companies in their early stages of maturity and decline are more likely to utilize AEM than enterprises in their later stages of maturity and decline.
Hypothesis 3A: Mature stage is mixed related to AEM.
Hypothesis 4A: Shake-out stage is negatively related to AEM.
Hypothesis 5A: Decline stage is positively related to AEM.
Previous study has attempted at the strategic decisions made by businesses at various stages of the growth cycle. At comparison to market share or revenue, companies on the start-up stage are more likely to engage extensively in role of marketing activities that generate consumer adoption (Bain, Citation1956; Scherer, Citation1970). Growth-stage businesses reach a particular level of market share and then keep investing extensively in innovation, branding, and tangible assets in order to expand their market share (Bain, Citation1956; Scherer, Citation1970). Maturity firms concentrate on increasing efficiency and creating profits for their investors (Selling & Stickney, Citation1989). Because of technological advancement (Christensen & Olsen, Citation2004), firms in downturn may engage in investment and reorganization activities (Kimberly, Citation1980; Miller & Friesen, Citation1984).
For two reasons, startups are unlikely to utilize REM. For starters, in-demand investors are more likely to put their money towards new activities and market branding rather than short-term gains. As a result, there appears to be little pressure on managers to meet their earnings targets. Studies back up this assertion, demonstrating that startups can operate with very little capital (Castanias & Helfat, Citation2001). In general, initial costs for innovation and marketing are critical and serve as the foundation for a company’s future possibilities. As a result, these businesses don’t have much leeway in cutting costs. The employment of REM, however, can be favorable in developing countries with benefits in terms of labor and housing expenses due to distinct institutional and environmental variations.
Hypothesis 1B: The introduction phase has a mixed impact on REM.
Hypothesis 2B: The growth phase has a mixed impact on REM.
To meet profit forecasts, mature companies may encounter capital market pressure (Burgstahler & Dichev, Citation1997). Furthermore, in mature organizations, managers are more inclined to stake their reputation and credibility on reaching earnings targets (Graham et al., Citation2005). These supply-side variables are expected to encourage mature companies to engage in REM. On the supply side, mature businesses may be able to finance ineffective innovation and marketing operations because they have a portfolio of initiatives, some of which are ineffective (Hamilton & Chow, Citation1993; Hitt et al., Citation1996; Hoskisson & Hitt, Citation1994). Furthermore, mature companies may put off investing in new marketing and/or innovation projects (Hitt et al., Citation1996). Mature organizations are likely to participate in REM behavior as a result of the mix of decision-making and incentives to accomplish profits targets.
Companies in the growth stage are likely to be between startup and mature. Investors, like companies in the startup stage, are unlikely to put as much emphasis on short-term profits as they are on innovation and branding. Companies in the expansion phase, on the other hand, require both external and internal finance to expand their activities (Jovanovic, Citation1982). Furthermore, during the growth phase of a business, founders are more inclined to withdraw (Amit et al., Citation1998; Granlund & Taipaleenmäki, Citation2005). As a result, it is an empirical question whether organizations in the growth phase have adequate incentive to meet earnings targets. On the supply side, growth-stage companies are less likely to minimize marketing and innovation investment than early-stage organizations, and unlike mature companies, they may not have the option of deferring marketing and innovation projects. Overall, organizations in the mature phase are unlikely to participate in EM through real transactions, aside from a larger motivation to meet profits goals in order to sustain a higher share price so founders can exit or raise more cash.
Companies in their early stages of development and expansion frequently have a lot of investment opportunities, which means they have a lot of projects with positive present value or initiatives that can generate profits in the long run. A modification in investment or inefficient decision making, such as when decreasing or investing in period costs, has a significant negative impact on the firm’s future performance expectations, particularly in companies in the start-up and growth stages. Costs incurred over time as a result of effective company practices, such as research and development investments.
Because the investment opportunity costs deriving from business decisions are suboptimal, managers perceive REM to be particularly expensive in this instance. Companies in the mature and depression stages, on the other hand, will have much less long-term investment prospects. As a result, because the investment opportunity cost is low, the cost of making suboptimal decisions might be low. The extent of AEM and REM, according to Zang (Citation2012), is determined by the company’s costs. As a result of the high costs, managers of start-up and growth-stage companies are less likely to use REM. Organizations in the start-up and growth stages utilise less REM than companies in the maturity and decline stages, according to the above analysis.
Hypothesis 3B: The mature phase has a mixed impact on REM.
Hypothesis 4B: The shake-out phase has a mixed impact on REM.
Hypothesis 5B: The decline phase has a mixed impact on REM.
To explore the moderating role of SOE on the FLC-EM relationship, we utilized resource dependency theory to build up hypotheses. Resource dependency theory was developed by Pfeffer and Salancik (Citation1978) and was first published in the book “The External Control of Organizations: A Resource Dependence Perspective.” Since its emergence, resource dependency theory has become one of the most influential theories of strategic management and organization (Hillman et al., Citation1999). According to resource dependency theory, when companies employ external resources, they will meet dependencies, and detecting and responding to these dependencies is an important managerial responsibility (Lux et al., Citation2011). External relationships between both the business and vital sources are a survival strategy for businesses to decrease uncertainty and risk (Pfeffer & Salancik, Citation1978). As a result, government policies and regulations are viewed as a powerful force that cannot be found in the natural environment (Hillman et al., Citation1999). Nevertheless, when internal and external entities exchange assets and the degree of dependence of each, the connection between the company and this resource dependency is dependent on the relative power of the stakeholders (Pfeffer & Salancik, Citation1978). Uddin (Citation2016) concurs, making the argument that I how well the current regime, as the country’s most politically powerful body, helps organize its experience of dealing with other insiders in the public add; and (ii) how the corporation and government on the board influence policy that affects the company’s outlook forward into taking risks, going to lead to much more conservative reactions (willing to accept or minimizing risk).
Firms having a higher percentage of SOE will acquire external financing, such as financial support and information sooner (Faccio, Citation2010; Faccio et al., Citation2006). Another explanation is that top managers with more government ownership are much more likely to generate the perception that they are “too big to fail,” that is, improbable to go insolvent and easier to put risky investments into place (Najid & Rahman, Citation2011; Uddin, Citation2016). As a result, the study claims that at the introduction and decline stages, corporate managers will approve the use of accrual earnings manipulation more than at the other three stages. Because the cash flow from business activities is now unstable. Because of the necessity to beautify the financial statements of these significant resources, managers are more likely to utilize earnings manipulation if there is a large SOE. Managers will, on the other hand, minimize the use of earnings manipulation in the next three periods with stable cash flow and positive growth due to its detrimental influence on long-term business success.
Hypothesis 6A: Increased SOE moderates Life cycle effects on AEM during the start-up and decline phases.
Hypothesis 6B: Decreased SOE moderates Life cycle effects on AEM during the last three stages.
There are consequences for managers who manipulate results based on whether the government is a minority or majority stakeholder. This can be seen in the ease with which managers make judgments about whether or not to take risk in investments. However, based on the cash influx and outflow of the firm, the effect of growing or decreasing economic transactions to increase or decrease period costs and directly affect the profit of the reporting period will be examined by management. These transactions are used based on the manager’s current status and choices.
Hypothesis 7A: The mixed effect of life cycle on REM is moderated by SOE.
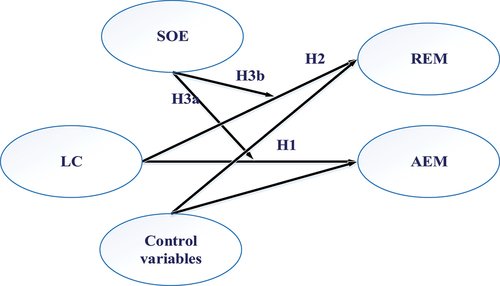
From all the above statements, we propose an analytical framework () of the study:
Figure 1. Research framework.
3. Research design
The research sample consists of companies listed on three stock exchanges (HOSE, HNX and UPCOM) between 2010 and 2019, as derived from publicly released audited financial statements of listed non-financial companies obtained from Refinitiv Eikon’s Datastream data source. The sample represents the whole Vietnamese stock market, with 622 listed non-financial enterprises. categorizes the study’s sample, including 622 listed non-financial companies into different industries.
Table 1. Classification of research sample based on industry
Because the research involved panel data, it was required to choose between a fixed effects model (FEM) and a random effect model (REM). The parameters in the models were estimated using both fixed and random effects models to identify suitable models. The Hausman test was then conducted, with the assumption that the REM model is more appropriate. The test results show which model is more appropriate for producing valuable regression findings. We employ the Modified Wald test and the F-test to investigate the phenomena. To eliminate violations, we utilize FE Robust on all models. Before running the estimation, the normality test is required to make sure the data is followed the normal distribution. However, several essential variables in this study such as firm life cycle proxies are dummy variable, so it is hard to follow the normal distribution. In this case, based on the study of Bell et al. (Citation2019), the FE Robust estimation is still suitable, effective, and has less biased regression results.
We built a model based on past studies to assess the relationship between company life cycle and AEM/REM (Durana et al., Citation2021; Hussain et al., Citation2020):
Then, we hypothesize that SOE moderates the effect in the association between life cycle and AEM/REM, the authors follow the guided steps of Baron and Kenny (Citation1986); Pham and Tran (Citation2020) to estimate the moderating effect of SOE on FLC-AEM/REM association. As a result, we construct the following regression model:
Appendix A contains detailed descriptions of the research variables.
According to the Rekon Infinitive classification, INDUSTRY is one of the industry control variables used to calculate the effect on the dependent variable at the industry level. YEAR is a binary variable with a value of 1 if it is in the current year and vice versa.
4. Results and discussion
Regarding AEM, the DAs variables (aem_jones and aem_kothari) have a mean value of 0.0001 and 0.0001, respectively, lower than the research of Roma et al. (Citation2020) with the US firm. Besides, the mean value of firm size by assets after logarithm (size) is 27.0554 and companies are suffering growth stage accounted for a small fraction with nearly 18.04%, much lower than the study of Hussain et al. (Citation2020) with sample includes Chinese listed firms. At the same time, companies facing recession (decline stage) are around 10.93% higher than 3.85% (Hussain et al., Citation2020). The similarity in the number of shake-out firms in this study and Hussain et al. (Citation2020) nearly 20% ().
Table 2. Descriptive statistics of variables
4.1. The relationship of the firm life cycle and accrual earnings management
The results from F-test (compared FEM and OLS), Hausman test (FEM and REM) suggest that FEM robust is the appropriate method for this study. Through aem_jones and aem_kothari proxies, variable lc_intro has coefficient = 0.181; 0.1778 with p-value < 0.01; 0.01 () and the same tendency is found with variable lc_decline (coefficient = 0.1471; 0.1471 with p-value < 0.01; 0.01 ()). The findings suggest that in the introduction and decline stage, the manipulation earnings through DAs are increased. These results are consistent with Durana et al. (Citation2021), Hussain et al. (Citation2020), and Roma et al. (Citation2020). In these stages, firms distort their financial information from creditors to obtain loans without strict debt covenants (Durana et al., Citation2021). Because in the introduction phase, firms need more capital with higher information asymmetry leading to pursue more in AEM practices (Hussain et al., Citation2020). Besides, in the decline stage, companies require higher financing, and executives are under pressure to provide a strong financial condition to stakeholders. Because of lacking the understanding of the market, firms were not pursuing any strategy (Miller & Friesen, Citation2016), or they may get into trouble with operating activities, leading to bad financial information. Thus, managers apply AEM practices for “window dressing” to hide the companies’ actual financial performance.
Table 3. FE Robust regression results of LC and AEM
Results illustrate that variable lc_growth has a negative significant association with AEM (coefficient = −0.063; −0.065 with p-value < 0.01; 0.01 ()). It describes that the degree of DAs reduces in the growth phase, and the study’s findings are consistent with Durana et al. (Citation2021); Roma et al. (Citation2020) and contrast to Hussain et al. (Citation2020). In the growth stage, AEM techniques are undesirable to managers because of the reduced asymmetric information problem, more analyst coverage, the ability to acquire loans at lower rates, and higher responsibility and transparency of growing and mature businesses (Hussain et al., Citation2020). Besides, Can et al. (Citation2020) also shows the positive link between the growth stage and financial reporting quality. However, the main point is that mentioned studies were conducted in big economies such as the USA (Can et al., Citation2020) or China (Hussain et al., Citation2020), which is different in emerging markets or developing countries. The findings of Durana et al. (Citation2021); Roma et al. (Citation2020) align with this paper, and they explained that the growth stage is a significant step that helps firms leap and find a sustainable position in the market. Although the dramatic increase in sales leads to positive cash flow, the investment is still not enough for the expanding demand of companies. Furthermore, the disparity between investors in developed and developing countries, along with the incomplete legal framework in the Vietnamese context, contributes to the negative relationship between EM and the growth stage.
The EM practices have the negative relationship with mature stage and shake-out stage (variable lc_mature with coefficient = −0.114, −0.1125 (p-value < 0.01) in ; and variable lc_shakeout with coefficient = −0.034; −0.0313 (p-value < 0.01) in ). The results are inconsistent with Hussain et al. (Citation2020). Because profits add more to value when the firm’s present operational activities are effective, earnings during the maturity stage are more suited for the company (Burgstahler & Dichev, Citation1997). Furthermore, in this stage, companies have a sustainable position in the market. The investments from potential projects are fewer, instead of investment managers focusing on more efficient operating. So AEM are not attractive to managers because they have fewer future profits growth cycles to compensate for it (Durana et al., Citation2021; Hussain et al., Citation2020). When considering the shake-out stage, several scenarios may happen. Weak firms are forced to close because they cannot keep up with the industry’s growth or are still losing money. So, they try to choose any option to escape from that situation which means that more DAs practices would be done to make the financial information beautiful. However, abusing earning manipulations would lead to a harmful effect on the long-term financial performance because the fact is that managers can not change the actual financial situation of the company. So, the negative relationship between AEM and the shake-out stage is found.
The accounting processes for accruals creation can differ depending on the stage of a company’s development. Companies at various stages of development have varying manufacturing capacity, capital investments, and hazards (Yonpae & Chen, Citation2006). Consider a corporation that is at two different stages of development (one in the growth stage and the other in the decline stage). Assume these companies are identical in every way except production capability. Because the corporation has the potential to progressively raise production capacity, the growth firm can generate DAs in response to any sales shock (exceptional increase in consumer demand). Nevertheless, because it is generally liquidating assets and does not have enough production capacity to meet the slowdown, a declining company cannot earn as much DAs as a growing organization.
4.2. The relationship of the firm life cycle and real earnings management
AEM is an earnings manipulation approach that has no effect on cash flow from operations or economic activities. Managers in start-up and growth firms are less likely to adopt EM through information depending on the characteristics of the start-up stage, where the company is generally focused on investment activities. In the short term, real shifts are needed to enhance earnings. Furthermore, organizations in the early stages of development and expansion are projected to see significant asset growth and enhanced long—term growth prospects. As a result, the impact of future DAs is less of a priority for these organizations’ executives. This is because managers expect future earnings growth to compensate for the negative effects of accrual earnings management in the future. This is corroborated by a poll of interviews conducted by Graham et al. (Citation2005), in which the majority of CFOs claimed that executives who are expanding the company anticipate future earnings growth to compensate for the disadvantage caused by past accounting earnings manipulation.
The results from F-test (compared FEM and OLS), Hausman test (FEM and REM) suggest that FEM robust is the appropriate method for this study. presents the relationship between FLC and REM. In terms of the first proxy of the REM approach, variable r_cfo represents actual activities affecting the cash flow from operations. It confirms that managers have a negative attitude toward the manipulation of REM in the introduction and decline stage. These results contrast with Hussain et al. (Citation2020), Hasan and Habib (Citation2017b), and Doukas and Kan (Citation2004). They suggest that firms confront poorer profitability, greater asymmetric information, increased idiosyncratic volatility, and cash-flow uncertainty during the introduction period, which motivates managers to engage in REM activities (Doukas & Kan, Citation2004; Hasan & Habib, Citation2017b). In the introduction stage, in-demand investors are more inclined to invest in new ventures and market branding than short-term gains. Consequently, management appears to be under minimal pressure to fulfill their profit objectives, so they do not need to manipulate earnings through real activities. Hussain et al. (Citation2020) imply that managers abuse REM practices to provide an efficient firm performance or hide the company’s loss to shareholders, other related parties in the decline stage. However, they finally realized that the manipulation of earnings through cash flow operations can not compensate actual operating status of the business in the long term. So, in the Vietnamese context, REM practices impact operating cash flow rarely used in the introduction and decline stage. In the growth and mature stage, the study’s results contrast to Hussain et al. (Citation2020). The different research contexts can explain this contradiction, Hussain et al. (Citation2020) conducted their studies in China, where the legal framework in protecting the investors is complete (Leuz, Citation2010) compared to the incomplete legal framework in Vietnam. To conclude, managers of companies in developing countries such as Vietnam tend to participate in real activities affecting operation cash flow in the mature and growth phase. The shake-out phase has the same trend as the mature stage and growth stage. Because after the mature stage, many companies could have poor financial performance. So, managers choose REM by accelerating sales or easing credits terms to create unreal cash flow and hide the loss or poor economic performance. This is a temporary solution to help managers deal with shareholders before they find a way to enhance their financial position.
Table 4. FE Robust regression results of LC and REM
When considering REM practices through changing the production cost, in the introduction and decline stage the positive relationship between REM and FLC is found. Because in the introduction stage, companies have the advantage of cutting-edge machines, so managers can create more items than necessary to fulfill projected demand. Fixed overhead expenses are distributed over a larger number of units at higher production volumes, decreasing fixed costs per unit. On the other hand, the sales will decrease dramatically when firms step into the decline stage. At this time, managers may choose many risky selections to help the company overcome this situation, and if the choice of managers success, firms can step in to a new life cycle. In particular, despite the decline in sales company will reduce the product’s price combine with the overproduction of new items to compensate for the loss of marginal profit because of lowering the selling price. In the decline stage, manipulating earnings by reducing production costs is a risky choice. If companies fail with this strategy, they can easily go bankrupt and be gotten away from the market. In the growth and mature stages, the negative relationship between FLC and REM practices through reducing production costs was found. The results contrast with Hussain et al. (Citation2020), which explained that because maturity firms have fewer investment opportunities in the mature stage. So instead of searching for potential projects that can make certainty profits, managers focus on improving the effectiveness and efficiency of the operational process (Jawahar & McLaughlin, Citation2001; Miller & Friesen, Citation1984). Furthermore, when financial performance reaches its peak, businesses have a higher ranking in governance activities and are considerably more accountable (O’Connor & Byrne, Citation2015). Thus, REM practices by declining productions costs are unnecessary. In the growth phase, firms find investors to build up substantial initial funds (Jawahar & McLaughlin, Citation2001). So, the relationship between FLC and REM should be positive in the growth stage. However, the result shows a negative relationship between REM and the growth stage. The explanations can base on the Vietnamese context that managers prefer applying REM practices through impact on operating cash flow or period costs. Furthermore, suppose managers want to impact production costs. In that case, they must consider carrying out complex activities with the production process and the supply side to decrease the fixed cost per unit and ultimately the unit cost and the cost of sales. In addition, firms have a high demand for capital and money to expand in this stage, and managers prefer to seek potential projects to build sustainable long-term profit. So, manipulating through affecting on productions cost rarely happen in the growth stage.
4.3. SOE’s moderating role in life cycle and accrual earnings management
In we test the impact of SOE on the role of moderation factor in the relationship between FLC and AEM. In terms of AEM practices represented by variables aem_jones and aem_kothari, the study’s findings suggest that firms with a high proportion of state ownership increase EM behavior in the introduction and decline stage (SOE_INTRO = 0.0034; 0.0033; SOE_DECLINE = 0.0025; 0.0025 ()). Moreover, managers of these companies tend to reduce the EM practices in the remaining stages (SOE_GROW = −0.0008; −0.0009; SOE_MATURE = −0.0016; −0.0016; SOE_SHAKEOUT = −0.0006; −0.0005 ()).
Table 5. FE Robust regression results of SOE on the relationship between LC and AEM
The findings are consistent with Najid and Rahman (Citation2011). In the introduction stage, managers of firms with a high percentage of SOE believe that the Government would support them or have “too big to fail” perception, so they tend to invest in more risky projects leading to the high risk of suffering loss from the failure. As a result, managers rise to manipulate earnings through AEM practices to beautify the financial statements. Regarding the decline stage, companies get into trouble with liquidity and solvency problems caused by failed projects. Leading to corporate managers of companies with a high rate of state ownership choose AEM for “window dressing” financial statements. However, unlike usual companies, SOE firms can find financial support from the public or the Government to help them overcome the recession and step into a new life cycle. In other words, in the decline stage, Government would allocate more resources and provide financial aid for rescuing purposes and preventing companies from bankruptcy. In terms of the remaining stages, firms with stable cash flow and optimistic growth will minimize earnings manipulation to prevent detrimental effects on long-term business success. Unlike the growth and mature stage, the shake-out stage was defined as the number of producers starts to dwindle (Gort & Klepper, Citation1982). However, SOEs firm are usually “too big to fall”. Hence, managers engage in M&A strategies with other rivals to become the predominant player in the industry, which helps companies enhance their financial performance.
4.4. SOE’s moderating role in life cycle and real earnings management
In Tables we test the impact of SOE on the role of moderation factor in the relationship between FLC and REM. Through proxy r_cfo, firms with a high rate of state ownership tend to reduce REM practices in the introduction and decline stage, and managers approve more REM in the remaining stages. Managers can perceive the enormous size of firms and the financial support from the Government, so they do not take too much pressure to gain profits in the bird stage. As a result, they have various investment choices without caring about the risk factors. Besides, in the decline stage, non-SOE firms tend to reduce the REM practices. Because corporate managers know that manipulation earnings through cash flow operations can not compensate actual operating status of the business in the long term. Although the same result was found in SOE firms, the reason may be different. These enterprises are usually too big to fail, and they also have more support from the Government to help them overcome the recession and start a new life cycle. The same tendency when high percentage state ownership firm apply more REM in the growth, mature and decline stage. In the mature stage, the SOE firms increase the REM practice to earn more profits to backup for the M&A strategies in the following stages. Stepping into the shake-out stage, companies might face many problems creating profits or competing with other rivalries. As investors become more aware of the firm’s potential for collapse, the firm’s capacity to fund new development initiatives by issuing shares will be constrained (Black, Citation1998). Therefore, Managers use REM to produce fake cash flow and cover losses or bad economic performance by accelerating sales or relaxing lending terms. This is a short-term option to assist management in dealing with shareholders while looking for a method to improve their financial situation.
Table 6. FE Robust regression results of SOE on the relationship between LC and REM for operational cash flow
Table 7. FE Robust regression results of SOE on the relationship between LC and REM for production costs
Table 8. FE Robust regression results of SOE on the relationship between LC and REM for discretionary expenses
When considering REM practices by changing the production cost, the relationship between FLC and REM in the introduction and mature stages are positive and negative, respectively. The remaining stages show the insignificant relation between FLC and REM. These correlations prove that companies with a high proportion of state ownership incentivize using REM in the beginning phase and decline in the mature stage. SOE firms are usually large and have a sustainable financial budget from many internal and external resources. In addition, these companies are also equipped with cutting-edge technology, so they easily improve production processes or overproduction to minimize manufacturing costs. Besides, with a strong financial budget, managers boldly invest in many high-risk projects, leading to a high likelihood of failure. As a result, manipulating earnings to compensate for the loss through REM activities is inevitable. However, in the mature stage, although companies would focus on enhancing effectiveness and efficiency. After a long operating time, the firm’s equipment and machines are depreciated, outdated, etc., so it is hard to improve the production process. The insignificant relationship between REM practices and FLC through production cost confirms the difficulty of changing the manufacturing process. Thus, reducing production costs to conduct REM activities is rarely chosen by managers of SOE firms.
In terms of the final typical REM proxy is r_disx, the findings suggest that companies with high state ownership rates prefer to apply REM practice in the introduction and mature growth stage. However, this relationship becomes insignificantly in the remaining period of FLC. Showing the same pattern with r_pro and r_cfo, managers of SOE companies tend to manipulate earnings to miss the target or compensate for the loss from failure projects. Study of Roychowdhury (Citation2006) indicated that declines the discretionary expense can have an impact on earnings. So, decreasing these period costs is the way to conduct earnings manipulations. The growth stage is an essential step to help firms leap and find a sustainable position in the market. To build up long-term strong financial performance, managers try to do many things to create an advantage over other competitors in the future, such as investing in CSR activities or finding more potential projects. Besides, this stage demands the rapid development of organizations, so they need a certain providing of resources from their suppliers to do it (Jawahar & McLaughlin, Citation2001).
Furthermore, a massive fraction of resources will be allocated for expansion in this stage (Anker, Citation2016). With the government’s support, firms will easily conduct the expansion strategy and achieve long-term sustainable financial ability in the future. However, over-investing can lead to failure. Hence, managers try to reduce period costs to create good financial information for investors and be competitive with other competitors. After that, the profit from expansion and other potential projects can compensate for the current manipulation regardless of harmful effects in the future. To conclude, this study’s findings of the relationship between FLC and REM with the moderating role of SOE are mixed results. The earnings manipulation behavior could be different depending on the categories of REM practices and different stages in FLC. In the future, other studies can compare this study’s results with their findings based on the same or the difference in research background.
5. Conclusions
While much prior research were conducted about EM behavior and FLC, this is the first study exploring the relationship between FLC and EM using the Dickinson (Citation2011) classification of FLC. Furthermore, earlier studies have devoted close attention to EM through DAs (Abdul Rahman et al., Citation2006; Beneish, Citation2001). This implies that the EM literature has focused on AEM. The authors measured EM behavior through both AEM and REM approaches to provide a more detailed view of manipulating companies’ earnings.
We used a sample of 622 Vietnamese non-financial enterprises listed on the HOSE, HNX, and UPCOM stock exchange from 2010 to 2019 and Fixed effects along with OLS robust models to estimate regression models. The findings reveal that AEM behavior is not the same across FLC stages in terms of the AEM and FLC relationship. A U-shaped pattern was found where DAs tend to be higher in the introduction and decline stage and lower for the remaining stages. The same U-shaped pattern was found when considering the impact of state ownership on the correlation between AEM and FLC. Managers tend to increase manipulating earnings through abnormal accruals and abnormal revenues in the introduction and decline stage, whereas AEM is negatively related to the remaining stages.
With the relationship between FLC and REM, the results differ depending on the REM method. When managers apply REM through operating cash flow, they have a negative attitude toward manipulating REM in the introduction and decline stage, while a positive relationship between REM and the remaining stages was found. Besides, suppose managers use the approach to change production costs. In that case, the results prove that executives incentivize using REM at FLC’s beginning and final stages. In the growth and mature stage, a negative relationship between FLC and REM practices was found. Regarding the REM approach through reducing period costs, managers tend to manipulate earnings in the introduction and growth stage, while maturity and shake-out firms reduce distorting their profits. When state ownership influences the relationship between FLC and REM, the FLC-REM relationship remains unchanged when using the r_cfo proxy. Whereas this correlation is various when applying the r_prod and r_disx proxies. The study’s results confirm the moderating role of SOE in the FLC—REM relationship in particular and FLC—EM in general.
5.1. Recommendation
This study has important implications for policymaker, investors, managers, shareholders, and other related parties:
First, CEOs should enhance the real-time link between current revenues and current expenditures to avoid a mismatch between expenses and current revenues. Adopting accounting rules and predicting more accurate accruals to encourage better matching might improve this development.
Second, the government should enhance the legal environment to emphasize safeguarding investors to prevent high-profit businesses’ earnings manipulation. Similarly, creditors must consider the stage of the firm’s life cycle before giving loans. Last but not least, if readers of accounting reports see that managers have free cash flow, they should have higher expectations when it comes to lending money to businesses.
Third, to combat EM practices, financial analysts should pay close attention to the financial data of companies on the stock market. Dickinson et al. (Citation2018) claimed that for growth and mature stage organizations, investors and creditors prefer to depend only on analyst coverage, however for introduction and decline stage firms, value-relevance of accounting information becomes more important. As a result of this study, we advise investors to be cautious when investing in early and late-stage companies.
5.2. Limitation
There are several restrictions of this study, which provides new possible avenues for future research. Firstly, these study samples are restricted in Viet Nam, therefore future research should take into accounts firms from areas having the difference in economies. Secondly, the study sample size needs to be improved in terms of the number of enterprises as well as the length of the research period. Thirdly, we merely use distinct AEM and REM proxies to quantify the managers’ opportunistic behavior. Future study might build on this work by looking at how top management factors including executive background, gender, age, and qualification mediate the relationship between EM and FLC. Finally, we recommend that future studies should be expanded to a larger range of nations, particularly emerging economies with poorer investor protection/corporate governance procedures.
Disclosure statement
No potential conflict of interest was reported by the author(s).
Additional information
Funding
Notes on contributors

Nguyen Vinh Khuong
Nguyen Vinh Khuong is a PhD from the University of Economics Ho Chi Minh City, Vietnam and a Lecturer in the Faculty of Accounting and Auditing at University of Economics and Law, Vietnam National University, Ho Chi Minh City, Vietnam. Dr Khuong works and does research in the fields of CSR, corporate governance, audit quality, earnings management, and behavioural accounting.
Le Huu Tuan Anh
Le Huu Tuan Anh is a Bachelor’s student in Auditing at the University of Economics and Law, Vietnam. He works and does research in the fields of auditing, corporate finance, and behavioural accounting.
Nguyen Thi Hong Van
Nguyen Thi Hong Van is an associate researcher at the University of Economics and Law, Vietnam National University, Ho Chi Minh City, Vietnam. Collectively, the authors have published several papers in quality journals, including Corporate Social Responsibility and Environmental Management, Sustainability, Business Strategy & Development, Journal of Sustainable Finance and Investment, Asia-Pacific Journal of Business Administration, Journal of Financial Reporting and Accounting, International Journal of Accounting & Information Management, Cogent Business and Management, and Social Responsibility Journal.
References
- Abad, D., Cutillas-Gomariz, M. F., Sánchez-Ballesta, J. P., & Yagüe, J. (2018). Real earnings management and information asymmetry in the equity market. European Accounting Review, 27(2), 209–28. https://doi.org/10.1080/09638180.2016.1261720
- Abdul Rahman, R., Haniffa, R., Haniffa, R., & Haniffa, R. (2006). Board, audit committee, culture and earnings management: Malaysian evidence. Managerial Auditing Journal, 21(7), 783–804. https://doi.org/10.1108/02686900610680549
- Adizes, I. (1979). Organizational passages-diagnosing and treating lifecycle prob- lems of organizations. Organizational Dynamics, 8(1), 3–25. https://doi.org/10.1016/0090-2616(79)90001-9
- Ahmed, B., Akbar, M., Sabahat, T., Ali, S., Hussain, A., Akbar, A., & Hongming, X. (2020). Does firm life cycle impact corporate investment efficiency? Sustainability, 13(1), 197–210. https://doi.org/10.3390/su13010197
- Akbar, A., Akbar, M., Tang, W., & Qureshi, M. (2019). Is bankruptcy risk tied to corporate life-cycle? Evidence from Pakistan. Sustainability, 11(3), 678–700. https://doi.org/10.3390/su11030678
- Akbar, M., Akbar, A., Maresova, P., Yang, M., & Arshad, H. M. (2020). Unraveling the bankruptcy risk‒return paradox across the corporate life cycle. Sustainability, 12(9), 147–159. https://doi.org/10.3390/su12093547
- Akbar, M., Akbar, A., Qureshi, M., & Poulova, P. (2021). Sentiments–risk relationship across the corporate life cycle: Evidence from an emerging market. Economies, 9(3), 111–128. https://doi.org/10.3390/economies9030111
- Alzoubi, E. S. S. (2018). Audit quality, debt financing, and earnings management: Evidence from Jordan. Journal of International Accounting, Auditing and Taxation, 30, 69–84. https://doi.org/10.1016/j.intaccaudtax.2017.12.001
- Amit, R., Brander, J., & Zott, C. (1998). Why do venture capital firms exist? theory and Canadian evidence. Journal of Business Venturing, 13(6), 441–466. https://doi.org/10.1016/S0883-9026(97)00061-X
- Anker, R. (2016). The moderating effect of organizational life cycle on the relationship between corporate social performance and corporate financial performance. ( Master thesis) University of Amsterdam.
- Anthony, J. H., & Ramesh, K. (1992). Association between accounting performance measures and stock prices: A test of the life cycle hypothesis. Journal of Accounting and Economics, 15(2–3), 203–227. https://doi.org/10.1016/0165-4101(92)90018-W
- Bain, J. (1956). Barriers to New Competition. Harvard University Press.
- Baron, R. M., & Kenny, D. A. (1986). The moderator-mediator variable distinction in social psychological research: Conceptual, strategic, and statistical considerations. Journal of Personality and Social Psychology, 51(6), 1173–1182. https://doi.org/10.1007/BF02512353
- Basu, S. (1997). The conservatism principle and the asymmetric timeliness of earnings1. Journal of Accounting and Economics, 24(1), 3–37. https://doi.org/10.1016/S0165-4101(97)00014-1
- Bell, A., Fairbrother, M., & Jones, K. (2019). Fixed and random effects models: Making an informed choice. Quality & Quantity, 53(2), 1051–1074. https://doi.org/10.1007/s11135-018-0802-x
- Beneish, M. D. (2001). Earnings management: A perspective. Managerial Finance, 27(12), 3–17. https://doi.org/10.1108/03074350110767411
- Black, E. L. (1998). Life-cycle impacts on the incremental value-relevance of earnings and cash flow measures. Journal of Financial Statement Analysis, 4, 40–57.
- Burgstahler, D., & Dichev, I. (1997). Earnings management to avoid earnings decreases and losses. Journal of Accounting and Economics, 24(1), 99–126. https://doi.org/10.1016/S0165-4101(97)00017-7
- Can, G., Ntim, C. G., & Ntim, C. G. (2020). Do life-cycles affect financial reporting quality? Evidence from emerging market. Cogent Business & Management, 7(1), 185–209. https://doi.org/10.1080/23311975.2020.1854147
- Castanias, R. P., & Helfat, C. E. (2001). The managerial rents model: Theory and empirical analysis. Journal of Management, 27(6), 661–678. https://doi.org/10.1177/014920630102700604
- Chen, T. (2016). Internal control, life cycle and earnings quality —an empirical analysis from Chinese market. Open Journal of Business and Management, 4(2), 301–311. https://doi.org/10.4236/ojbm.2016.42032
- Christensen, F. M., & Olsen, S. (2004). The potential role of life cycle assessment in regulation of chemicals in the European Union. The International Journal of Life Cycle Assessment, 9(5), 327–332. https://doi.org/10.1007/BF02979422
- Deangelo, H., Deangelo, L., & Stulz, R. (2006). Dividend policy and the earned/contributed capital mix: A test of the life-cycle theory☆. Journal of Financial Economics, 81(2), 227–254. https://doi.org/10.1016/j.jfineco.2005.07.005
- Dickinson, V. (2011). Cash flow patterns as a proxy for firm life cycle. The Accounting Review, 86(6), 1969–1994. https://doi.org/10.2308/accr-10130
- Dickinson, V., Kassa, H., & Schaberl, P. D. (2018). What information matters to investors at different stages of a firm’s life cycle? Advances in Accounting, 42, 22–33. https://doi.org/10.1016/j.adiac.2018.07.002
- Doukas, J. A., & Kan, O. B. (2004). Excess cash flows and diversification discount. Financial Management, 33(2), 71–88. http://www.jstor.org/stable/3666159
- Durana, P., Michalkova, L., Privara, A., Marousek, J., & Tumpach, M. (2021). Does the life cycle affect earnings management and bankruptcy? Oeconomia Copernicana, 12(2), 425–461. https://doi.org/10.24136/oc.2021.015
- Faccio, M., Masulis, R. W., & McConnell, J. J. (2006). Political connections and corporate bailouts. The Journal of Finance, 61(6), 2597–2635. https://doi.org/10.1111/j.1540-6261.2006.01000.x
- Faccio, M. (2010). Differences between politically connected and nonconnected firms: A cross‐country analysis. Financial Management, 39(3), 905–928. https://doi.org/10.1111/j.1755-053X.2010.01099.x
- Faff, R., Kwok, W. C., Podolski, E. J., & Wong, G. (2016). Do corporate policies follow a life-cycle? Journal of Banking & Finance, 69, 95–107. https://doi.org/10.1016/j.jbankfin.2016.04.009
- Gort, M., & Klepper, S. (1982). Time paths in the diffusion of product innovations. The Economic Journal, 92(367), 630–653. https://doi.org/10.2307/2232554
- Graham, J. R., Harvey, C. R., & Rajgopal, S. (2005). The economic implications of corporate financial reporting. Journal of Accounting and Economics, 40(1–3), 3–73. https://doi.org/10.1016/j.jacceco.2005.01.002
- Granlund, M., & Taipaleenmäki, J. (2005). Management control and controllership in new economy firms - a life cycle perspective. Management Accounting Research, 16(1), 21–57. https://doi.org/10.1016/j.mar.2004.09.003
- Habib, A., & Hasan, M. M. (2017). Firm life cycle, corporate risk-taking and investor sentiment. Accounting & Finance, 57(2), 465–497. https://doi.org/10.1111/acfi.12141
- Habib, A., & Hasan, M. M. (2019). Corporate life cycle research in accounting, finance and corporate governance: A survey, and directions for future research. International Review of Financial Analysis, 61, 188–201. https://doi.org/10.1016/j.irfa.2018.12.004
- Habib, A., Bhuiyan, M. B. U., & Hasan, M. M. (2019). IFRS adoption, financial reporting quality and cost of capital: A life cycle perspective. Pacific Accounting Review, 31(3), 497–522. https://doi.org/10.1108/PAR-08-2016-0073
- Hamilton, R. T., & Chow, Y. K. (1993). Why managers divest - evidence from New Zealand’s largest companies. Strategic Management Journal, 14(6), 479–484. https://doi.org/10.1002/smj.4250140606
- Hasan, M. M., Al-Hadi, A., Taylor, G., & Richardson, G. (2017). Does a firm’s life cycle explain its propensity to engage in corporate tax avoidance? European Accounting Review, 26(3), 469–501. https://doi.org/10.1080/09638180.2016.1194220
- Hasan, M. M., & Habib, A. (2017a). Corporate life cycle, organizational financial resources and corporate social responsibility. Journal of Contemporary Accounting & Economics, 13(1), 20–36. https://doi.org/10.1016/j.jcae.2017.01.002
- Hasan, M. M., & Habib, A. (2017b). Firm life cycle and idiosyncratic volatility. International Review of Financial Analysis, 50, 164–175. https://doi.org/10.1016/j.irfa.2017.01.003
- Hillman, A. J., Zardkoohi, A., & Bierman, L. (1999). Corporate political strategies and firm performance: Indications of firm‐specific benefits from personal service in the US government. Strategic Management Journal, 20(1), 67–81. https://doi.org/10.1002/(SICI)1097-0266(199901)20:1<67::AID-SMJ22>3.0.CO;2-T
- Hitt, M. A., Hoskisson, R. E., Johnson, R. A., & Moesel, D. D. (1996). The market for corporate control and firm innovation. Academy of Management Journal, 39(5), 1084–1119. https://doi.org/10.5465/256993
- Hoskisson, R. E., & Hitt, M. A. (1994). Downscoping: How to tame the diversified firm. Oxford University Press.
- Hribar, P., & Yehuda, N. (2015). The mispricing of cash flows and accruals at different life‐cycle stages. Contemporary Accounting Research, 32(3), 1053–1072. https://doi.org/10.1111/1911–3846.12117
- Hsu, F. J. (2018). Does corporate social responsibility extend firm life-cycles? Management Decision, 56(11), 2408–2436. https://doi.org/10.1108/md-09-2017-0865
- Hussain, A., Akbar, M., Kaleem Khan, M., Akbar, A., Panait, M., & Catalin Voica, M. (2020). When does earnings management matter? Evidence across the corporate life cycle for non-financial Chinese listed companies. Journal of Risk and Financial Management, 13(12), 313–332. https://doi.org/10.3390/jrfm13120313
- Irawana, F., & Afifb, A. R. (2020). Does firms’ life cycle influence tax avoidance? Evidence from Indonesia. International Journal of Innovation, Creativity and Change, 14(1), 1211–1229.
- Jacoby, G., Li, J., & Liu, M. (2019). Financial distress, political affiliation and earnings management: The case of politically affiliated private firms. The European Journal of Finance, 25(6), 508–523. https://doi.org/10.1080/1351847X.2016.1233126
- Jawahar, I. M., & McLaughlin, G. L. (2001). Toward a descriptive stakeholder theory: An organizational life cycle approach. Academy of Management Review, 26(3), 397–414. https://doi.org/10.5465/amr.2001.4845803
- Jensen, M. C. (1986). Agency costs of free cash flow, corporate finance, and takeovers. The American Economic Review, 76(2), 323–329. http://www.jstor.org/stable/1818789
- Jones, J. J. (1991). Earnings management during import relief investigations. Journal of Accounting Research, 29(2), 193–228. https://doi.org/10.2307/2491047
- Jovanovic, B. (1982). Selection and the Evolution of Industry. Econometrica, 50(3), 649–670. https://doi.org/10.2307/1912606
- Kabir, R., & Thai, H. M. (2017). Does corporate governance shape the relationship between corporate social responsibility and financial performance? Pacific Accounting Review, 29(2), 227–258. https://doi.org/10.1108/PAR-10-2016-0091
- Kale, D., & Almeida, J. (2019, 13-16 March, 2019). The quality of accruals across life cycle stages‖. Paper presented at the Southwestern Finance Association 2019 Annual Meeting (SWFA), Houston TX.
- Kimberly, J. R. (1980). Data aggregation in organizational research: The temporal dimension. Organization Studies, 1(4), 367–377. https://doi.org/10.1177/017084068000100404
- Kothari, S. P., Leone, A. J., & Wasley, C. E. (2005). Performance matched discretionary accrual measures. Journal of Accounting and Economics, 39(1), 163–197. https://doi.org/10.1016/j.jacceco.2004.11.002
- Kovacova, M., Kliestik, T., Kubala, P., Valaskova, K., Radišić, M., & Borocki, J. (2018). Bankruptcy models: Verifying their validity as a predictor of corporate failure. Polish Journal of Management Studies, 18(1), 167–179. https://doi.org/10.17512/pjms.2018.18.1.13
- Krishnan, G. V., Myllymäki, E. R., & Nagar, N. (2020). Does financial reporting quality vary across firm life cycle? Journal of Business Finance & Accounting, 48(5–6), 954–987. https://doi.org/10.1111/jbfa.12508
- Leuz, C. (2010). Different approaches to corporate reporting regulation: How jurisdictions differ and why. Accounting and Business Research, 40(3), 229–256. https://doi.org/10.1080/00014788.2010.9663398
- Li, Y., Li, X., Xiang, E., & Geri Djajadikerta, H. (2020). Financial distress, internal control, and earnings management: Evidence from China. Journal of Contemporary Accounting & Economics, 16(3), 121–139. https://doi.org/10.1016/j.jcae.2020.100210
- Liu, M. M. (2006). Accruals and managerial operating decisions over the firm life cycle. ( Doctoral dissertation), Massachusetts Institute of Technology.
- Lux, S., Crook, T. R., & Woehr, D. J. (2011). Mixing business with politics: A meta-analysis of the antecedents and outcomes of corporate political activity. Journal of Management, 37(1), 223–247. https://doi.org/10.1177/0149206310392233
- Miller, D., & Friesen, P. H. (1980). Momentum and revolution in organizational adaptation. Academy of Management Journal, 23(4), 591–614. https://doi.org/10.5465/255551
- Miller, D., & Friesen, P. H. (1984). A longitudinal study of the corporate life cycle. Management Science, 30(10), 1161–1183. https://doi.org/10.1287/mnsc.30.10.1161
- Miller, D., & Friesen, P. H. (2016). Successful and unsuccessful phases of the corporate life cycle. Organization Studies, 4(4), 339–356. https://doi.org/10.1177/017084068300400403
- Moores, K., & Yuen, S. (2001). Management accounting systems and organizational configuration: A life-cycle perspective. Accounting, Organizations and Society, 26(4), 351–389. https://doi.org/10.1016/S0361-3682(00)00040-4
- Mueller, D. C. (1972). A life cycle theory of the firm. The Journal of Industrial Economics, 20(3), 199–219. https://doi.org/10.2307/2098055
- Najid, N. A., & Rahman, R. A. (2011). Government ownership and performance of Malaysian government-linked companies. International Research Journal of Finance and Economics, 61(1), 145–167.
- O’Connor, T., & Byrne, J. (2015). Governance and the corporate life-cycle. International Journal of Managerial Finance, 11(1), 23–43. https://doi.org/10.1108/ijmf-03-2013-0033
- Park, K. (2017). Pay disparities within top management teams and earning management. Journal of Accounting and Public Policy, 36(1), 59–81. https://doi.org/10.1016/j.jaccpubpol.2016.11.002
- Park, B.-J., & Lee, K.-H. (2020). The sensitivity of corporate social performance to corporate financial performance: A “time-based” agency theory perspective. Australian Journal of Management, 46(2), 224–247. https://doi.org/10.1177/0312896220917192
- Pfeffer, J., & Salancik, G. (1978). The external control of organizations: a resource dependence perspective. Harper.
- Pham, H. S. T., & Tran, H. T. (2020). CSR disclosure and firm performance: The mediating role of corporate reputation and moderating role of CEO integrity. Journal of Business Research, 120, 127–136. https://doi.org/10.1016/j.jbusres.2020.08.002
- Ramaswamy, V., Ueng, J. C., & Carl, L. (2007). Corporate governance characteristics of growth companies: An empirical study. Academy of Accounting and Financial Studies, 12(1), 21–33.
- Roma, C. M. D. S., Louzada, L. C., Roma, P. M. D. S., Goto, H., & Souma, W. (2020). Earnings management, policy uncertainty and firm life cycle stages: Evidence from publicly traded companies in the USA and Brazil. Journal of Financial Economic Policy, 13(3), 371–390. https://doi.org/10.1108/jfep-02-2020-0031
- Roychowdhury, S. (2006). Earnings management through real activities manipulation. Journal of Accounting and Economics, 42(3), 335–370. https://doi.org/10.1016/j.jacceco.2006.01.002
- Scherer, F. M. (1970). Industrial market structure and economic performance. Rand McNally.
- Selling, T. I., & Stickney, C. P. (1989). The effects of business environment and strategy on a firm’s rate of return on assets. Financial Analysts Journal, 45(1), 43–52. https://doi.org/10.2469/faj.v45.n1.43
- Spence, A. M. (1977). Entry, capacity, investment and oligopolistic pricing. The Bell Journal of Economics, 8(2), 534–544. https://doi.org/10.2307/3003302
- Spence, A. M. (1979). Investment strategy and growth in a new market. J. Reprints Antitrust L. & Econ, 10, 345–359.
- Trihermanto, F., & Nainggolan, Y. A. (2018). Corporate life cycle, CSR, and dividend policy: Empirical evidence of Indonesian listed firms. Social Responsibility Journal, 16(2), 159–178. https://doi.org/10.1108/srj-09-2017-0186
- Uddin, M. H. (2016). Effect of government share ownership on corporate risk taking: Case of the United Arab Emirates. Research in International Business and Finance, 36, 322–339. https://doi.org/10.1016/j.ribaf.2015.09.033
- Verreynne, M.-L., & Meyer, D. (2010). Small business strategy and the industry life cycle. Small Business Economics, 35(4), 399–416. https://doi.org/10.1007/s11187-008-9165-3
- Vorst, P., & Yohn, T. L. (2018). Life cycle models and forecasting growth and profitability. The Accounting Review, 93(6), 357–381. https://doi.org/10.2308/accr-52091
- Wang, Z., Akbar, M., & Akbar, A. (2020). The interplay between working capital management and a firm’s financial performance across the corporate life cycle. Sustainability, 12(4), 166–182. https://doi.org/10.3390/su12041661
- Yonpae, P., & Chen, K. H. (2006). The effect of accounting conservatism and life-cycle stages on firm valuation. Journal of Applied Business Research (JABR), 22(3), 75–92. https://doi.org/10.19030/jabr.v22i3.1428
- Zang, A. Y. (2012). Evidence on the trade-off between real activities manipulation and accrual-based earnings management. The Accounting Review, 87(2), 675–703. https://doi.org/10.2308/accr-10196
