
 ?Mathematical formulae have been encoded as MathML and are displayed in this HTML version using MathJax in order to improve their display. Uncheck the box to turn MathJax off. This feature requires Javascript. Click on a formula to zoom.
Abstract
This paper examines price volatility and transmission of rice markets in Ghana and draws implications for food security. Using monthly rice price data from 2013 to 2019, the paper uses the Autoregressive Distributed Lag (ARDL) with an Error Correction Model (ECM) to ascertain the availability and accessibility of rice, whilst the Generalized Autoregressive Conditional Heteroskedasticity (GARCH) model is considered to measure the stability of the commodity. The paper finds evidence of cointegration between the World and Ghana’s rice market. Findings confirm cointegration in Ghana’s regional markets for both imported and domestically produced rice. This ensures stable long-run relationship, allowing trade flows that guarantees rice availability. The corrections in short-run deviations of price ensure continuous accessibility of rice in the country. Estimates from the volatility model suggest high fluctuation in prices, implying that stability in the prices of rice is an issue across all regional markets. The paper recommends efforts in increasing domestic production to enhance availability and accessibility of rice. Stakeholders along the rice value chain should be encouraged to invest in competitive rice production. Government should leverage rice prices with giant import countries to reduce the cost of importation for stable price on the market.
PUBLIC INTEREST STATEMENT
Rice is a major staple food in Ghana with increasing consumption over the years. In developing countries like Ghana, the degree to which markets are integrated and price transmitted to food markets are key determinants of food security. In markets that are not well integrated, signals from price fluctuations may not be passed on from areas with food scarcity to food surplus areas, hence resulting in prices becoming increasingly unstable which might affect consumers’ ability to purchase and have access to food. Using monthly rice price data from 2013 to 2019, the study results provide insight into the level of integration and transmission in the various markets for rice in safeguarding availability, accessibility, and stability to ensure food security in Ghana.
1. Introduction
Global markets for food commodities have been highly vulnerable and volatile since 2007 (Braha et al., Citation2015). Several casual factors explained the advent of high food prices. Some authors have classified the short- and long-term drivers of price volatility and transmission as rising demand from emerging economies, financial speculation, increased use of biofuels, and falling investments in agriculture (Chen et al., Citation2019; McDonald, Citation2010; Mittal, Citation2009; Ruby, Citation2012; Wiebe et al., Citation2011).
Food security is influenced by the transmission and fluctuations in food prices, and the latter has long been a recurring problem in many African countries, of which Ghana is no exception (Hamilton et al., Citation2020; HLPE, Citation2011; Olila et al., Citation2016; Onyuma et al., Citation2006; Sousa, Citation2017). Oswald Spring (Citation2019) reported that price spikes raised the undernourished household number from about 850 million to around 1023 million globally. According to Minot (Citation2011), as cited in Tanaka and Guo (Citation2020), the transmission of high world prices to the domestic markets causes erosion of the purchasing power of consumers in developing countries since they are principal importers (purchasers) of food, hence force consumers to buy (spend on) cheaper foods. In Ghana, poor households spend a greater share of their income on food (Zereyesus et al., Citation2017), while at the national level, the country is faced with balance-of-payments pressure due to the higher cost of food importation.
Rice remains Ghana’s second-largest consumed staple food, a source of household income and livelihood along the rice value chain (Amanor-Boadu, Citation2012; Amikuzuno et al., Citation2013). The per capita consumption of rice has grown from 17.5 kg to 48 kg in just two decades, with a current total rice consumption of about 1.42 million MT (MMT), (Archibald & Taylor, Citation2020). Conversely, domestic production accounts for about or a little over 30% of the total supply and is increasing at an average pace. Thus, roughly only 470,000 MT of rice consumed in this country constitute total yearly domestic production. Small scale rice farmers constitute many participants of the value-chain actors (Addison et al., Citation2015; Boansi, Citation2013) and domestic production of rice has continued to lag other crops due to its low cereal yield, high cost of inputs and production constraints, difficulties in accessing credit, use of poor yielding seed varieties, inappropriate agronomic practices, limited mechanization, poor processing methods, and poor marketing strategies (Obirih-Opareh, Citation2008).
Rakotoarisoa (Citation2006) observed the rice market to be characterized by a high level of policy distortions, with various interventions made by the Ghanaian government to achieve self-sufficiency being a contributing factor. Also, factors such as specific types and quality of rice affect the rice market. This is further seen in the substitution of the various domestically produced rice for high quality (polished with a lower percentage of broken kernels) imported rice as limited by the taste preferences of the people (Ayeduvor,). In line with the ensuing argument, firstly the question of the rate of increase in rice demand over the past decade remains quite unanswered. Secondly, the growth in rice demand relative to population growth or the growth of other factors needs to be investigated.
Fluctuation in global prices for imported rice in the future may directly be felt as an outward shock, which will aggravate the availability, accessibility, and stability of rice in the country. That is, the increase in the price of international rice may be transferred to the domestic price in many developing countries including Ghana leading to price hikes, whilst posing challenges to food security. The irregular flow of global price spikes to the local price of rice does, however, require the transmission to be carefully characterized to properly develop price stabilization and food safety policies. The movement of prices for rice in the country could provide insights into how variations in one regional market can influence the price, output (quantity available), consumption, and social welfare of the same commodity in another regional market.
Food price stability in many African countries is indeed a very important issue, and the interaction between domestic prices and imports remains far from well understood across the literature. Although some studies (Abdulai, Citation2000; Abdulai et al., Citation2006; Armah et al., Citation2019; Damba et al., Citation2019) have examined integration and price transmission in the cereal markets in Ghana, most of them were focused on maize, neglecting rice, which is equally recognized as an important staple commodity for Ghanaian people. Most of these studies also did not focus on examining volatility or otherwise stability in price over the years. Against this backdrop, the paper examines the relationship between the world and domestic regional markets for rice in ensuring availability of the commodity, analyses the extent of price transmission in the domestic regional markets in relation to accessibility of rice, and further investigates the effect of price changes on the stability of rice in Ghana. The paper is organized as follows. Section 2 analyses rice marketing systems in Ghana; section 3 describes the materials and methods; section 4 discus the data and time-series properties focusing on the rice markets; section 5 reports on empirical results, whereas section 6 includes the final remarks.
2. Rice marketing system in Ghana
The marketing system of rice refers to the types of distribution channels that businesses and firms employ in the trading of both domestically produced and imported rice. Basically, there are two main supply chains; domestically produced rice and the imported rice marketing systems (Amikuzuno et al., Citation2013). These systems are further described as indigenous distribution and expatriate marketing channels. MoFA-IFPRI (Citation2020) further explained that the pre-liberalization of some Government policies and regulation have led to the involvement of several private traders in the rice marketing system. The domestically produced rice is divided into two categories within the various market centres: branded and unbranded rice. The large-scale domestic producers and processors typically provide brand-named varieties with high-quality long-grain aromas comparable to the price and quality of imported rice brands. Some domestically produced branded rice includes Copa, Champion, Aduanehene, and Royal Farmers (Andam et al., Citation2019). On the other hand, unbranded varieties are sourced mainly from large rice production areas and sold by trade men and women on open markets. According to Ragasa et al. (Citation2014), niche markets are also expanding; for example, health-conscious urban consumers are demanding more nutritious local brown rice.
Source: MoFA (Ministry of Food and Agriculture; Citation2018)
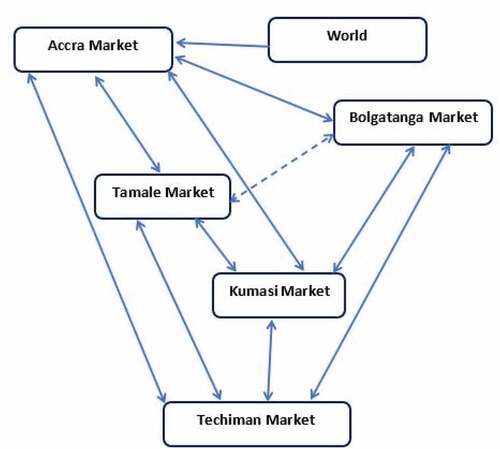
Despite the steady production growth, the share of imported rice remains greater than 50% from 2013 to 2018 (), and an estimated 15% of imported rice is exported through Ghana to neighbouring countries (MoFA-IFPRI, Citation2020). Ghana imports rice from countries, such as the United States of America, Vietnam, China, and Thailand (Angelucci et al., Citation2019; Ayeduvor,; Hagan & Awunyo-Vitor, Citation2020). Nonetheless, the inconsistency in the supply of domestically produced rice and the taste preference of consumers makes imported rice dictates the market scene. Imported rice from the country’s port (Accra) is temporarily stored in the warehouses of importing companies and then distributed through sedentary wholesalers to the urban and rural retailers in the various marketing centres as depicted in () (Kumasi, Techiman, Tamale, and Bolgatanga; Amanor-Boadu, Citation2012). The commodity may subsequently be delivered directly to final customers or through many layers of retailing before reaching the final consumer. Traders (both wholesalers and retailers) in various markets across the country; Accra, Kumasi, Techiman, Tamale, and Bolgatanga trade in both local and imported rice simultaneously.
Figure 1. Ghana’s rice supply.
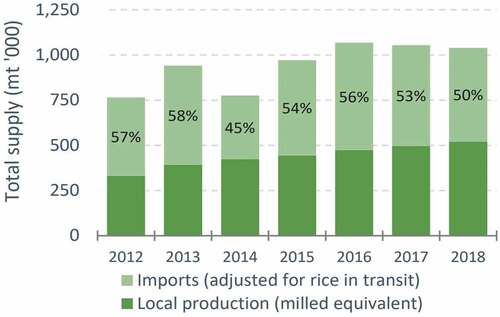
Figure 2. Distribution network of both local and imported rice in Ghana.Source: Adapted from Jordanov et al. (Citation2013).
3. Materials and methods
According to Kuwornu et al. (Citation2011), the existence of unit roots in a parameter should be checked prior to model estimation using Dickey-Fuller tests. To circumvent spurious regressions and their implications, the study first confirms the stationarity of the data sets. The data are assumed to be from a white noise series data system. This means that each parameter in the series has a zero mean and constant variance and is distributed independently and identically (Greene, Citation2003). The study then uses this stochastic process to test for unit roots, as described by Gujarati (Citation2004) and Greene (Citation2003). This paper employs the Autoregressive Distributed Lag (ARDL)/bounds testing procedure to estimate the long-run and short-run relationships between the various rice markets. This coupled with the cointegration of the various markets under study, the dynamic interaction among the variables of interest for easy trade of rice is established which safeguard the availability of the commodity (Pesaran et al., Citation2001). There are three distinct advantages to using this method: (i) it is able to overcome issues with order of integration (Johansen & Juselius, Citation1990; Udoh et al., Citation2015), (ii) unlike many other standard multivariate cointegration processes, which are ideal for big sample sizes, it is effective for small sample size research (Pesaran et al., Citation2001; Udoh et al., Citation2015), and (iii) it gives accurate long-run model parameters and a reliable t-statistic (Harris & Sollis, Citation2003). To test the cointegration relationship between the variables to ascertain the availability of rice, the following ARDL models are employed:
Referring to equation (1), is a vector of prices in the five markets,
denotes the ith independent variables (all markets under study), k is the maximum lag operator. In this methodology, the best lags are chosen using the well-known Akaike Information Criterion (AIC) and the Schwarz Bayesian Criteria (SBC). The selected ARDL model’s long-run coefficients and asymptotic standard error are then computed. The long-run elasticity is estimated following Wilson and Chaudhri (Citation2004). The ECM version of the selected ARDL model can be obtained by rewriting equation (1) in terms of the lagged levels and first difference (Pesaran & Pesaran, Citation1997; Udoh et al., Citation2015).
,
and
are the coefficients of the short-run dynamic adjustment of the model convergent to equilibrium and
is the speed of adjustment.
Where error correction term is specified as:
The ECM coefficient indicates how rapidly variables converge to balance and should have a coefficient with a statistically significant negative value.
The Generalized Autoregressive Conditional Heteroskedasticity (GARCH) as an extension from the Autoregressive Conditional Heteroskedasticity (ARCH) model is used to establish the conditional volatility of rice in the various markets under study. However, the establishment of conditional volatility of the price of rice provide a measure of stability or otherwise of prices in the various market for rice. Assuming a mean-corrected return , where
is the return of a series and
as the conditional mean of
then the mean equation for the GARCH model for rice markets in Ghana is written as:
Where is a 5 × 1 vector of prices in the five domestic markets,
is a 5 × 1 vector of drifts, and
is a 5 × 1 vector of error terms. The conditional variances (
) for which each series is generated from the error term of the GARCH model is specified as:
Where is the conditional variance from the conditional mean and
and
such that
and
;
, where
and
for
and
for
.
EquationEquation 5(5)
(5) specifically demonstrates that the value of the variance of the conditional disturbance depends on the prior values of the shocks as well as the past values. So, the simplest GARCH model with h = 1 and m = 1 is GARCH (1,1) and a simple parsimonious GARCH (1,1) model can be represented as:
An advantage of using the GARCH specification is its ability to fully capture the thick tail returns and volatility clustering. However, some restrictions are imposed on the model to avoid the negativity of the coefficients of the squared innovations and the squared returns. The “heavier” tailed student t-distribution and the standard normal distribution are the two types of error distributions considered in this analysis. The student’s t-test distribution is, however, adopted in this study as the rice price returns are likely to exhibit heavier tailed compared to the standard normal.
4. Data and time-series properties
Secondary data on monthly retail “imported rice” and “domestically produced rice” prices are used for this paper. Five regional rice markets (in ) are selected in conjunction with the World market (rice) for the study; namely Accra (Greater Accra Region), Kumasi (Ashanti Region), Techiman (Bono East Region), Tamale (Northern Region), and Bolgatanga (Upper East Region). The various markets are selected based on data availability, levels of consumption and geographical location. A greater percentage (about 90%) of rice imported into the country is transported to Accra and Kumasi markets for further distribution, making Accra and Kumasi markets a hub for high volume/quantity of rice compared to other markets. Therefore, Accra and Kumasi are considered by this paper to be the reference markets for imported rice relative to other markets. Also, in establishing the relations between the world market and Ghana, the average price of rice in the country is used.
Figure 3. Map showing the regional markets where the study was conducted.
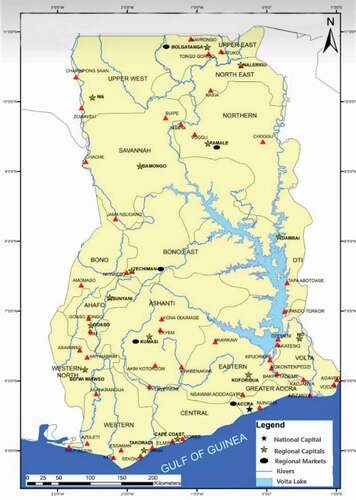
Regarding the domestically produced rice in Ghana, Bolgatanga and Tamale markets are used as the reference or central markets as these areas are marked with high levels of production. This paper uses monthly retail prices for both domestic and imported rice constituting 84 observations from January 2013 to December 2019. This price data is accessed from the Statistics Research and Information Directorate of the Ministry of Food and Agriculture (SRID-MOFA) and world-bank commodity price data. Between 2013 and 2018, Vietnam was the fifth-largest producer of rice and the second-largest exporter of rice (FAOSTAT, Citation2020; IFAD, Citation2014). Following Vietnam’s influence on the world’s production and export of rice and the volume of rice Ghana imports from Vietnam (about 71% of total imports) during the periods under study (Archibald & Taylor, Citation2019; Ayeduvor,), the import prices from Vietnam is used as the world price in this paper. All the data on prices obtained from SRID-MOFA are on per 5 kg of rice. Prices of imported rice used for data analysis in the study are converted to Ghana Cedi (GH₵). Hence, prices presented in this work can be interpreted as GH₵/5 kg. Also, the data set is adjusted for inflation using the consumer price index based in 2013. Hence, the data used for the analysis is real retail rice prices from the various markets.
Variable definitions and their descriptive statistics are reported in . Prices for domestically produced rice are lower than the prices of imported rice. This is because of the inability of the Ghana rice industry to process domestically produced rice into high-quality rice (which would imply a lower percentage of broken kernels) to command the same premium as the imported rice. Across the imported rice markets, the highest average retail prices are recorded in Techiman and Tamale markets (GH₵ 23.5 each), with its lowest in the Bolgatanga market. Following the prices of domestically produced rice in Ghana, Techiman market recorded the lowest price of GH₵ 12.6 while Accra market had the highest price (GH₵ 17.2), see, .
Table 1. Statistical description of the 2013–2019 monthly price data
The paper tested for normality in data distribution using skewness, kurtosis, and a joint chi2 test. Reading the joint test in reveals that variables IP, Gh, AP_dms, TAP_dms, and BP_dms are accepted as having a normal distribution. Whereas variables AP_imp, KP_imp, TAP_imp, TEP_imp, BP_imp, KP_dms, and TEP_dms are rejected as having a normal distribution at 5% and 10% significance level. This suggests the presence of strong volatility.
Table 2. Test for normal distribution
The study deployed the augmented Dickey-Fuller (ADF) test proposed by Dickey and Fuller (1979) to examine whether real prices of rice in the various markets have unit roots. The unit root test results on the log of real prices for both imported and domestic rice in the various market outlets are presented in . The results show that prices are nonstationary in levels but stationary in first differences at the 1% significance level. The results of the ADF test provide evidence of stationary of all markets under study. The results suggest that all pricing series from the various markets follow the standard assumptions for the asymptotic distribution.
Table 3. Results of Augmented-Dickey fuller (ADF) test
A maximum lag order of 4 was chosen for the conditional ARDL ECM in the equation using AIC as a guide (1). The study’s test for cointegration was normalization on five markets (LnGh, LnAP_imp, LnKP_imp, LnTAP_dms and LnBP_dms as dependent variables). The F-statistic was used to test the joint null hypothesis that the coefficients of the lagged level variables are zero (i.e., there is no long-run relationship between them). The ARCH-LM test is used to test for ARCH effect on the residual. This test is conducted under the null hypothesis that the residuals of the model have no ARCH effect. The results show that the F-statistics for all the returns series are significant at a 1% significant level. These indicate the presence of ARCH effects because the null hypothesis has been rejected.
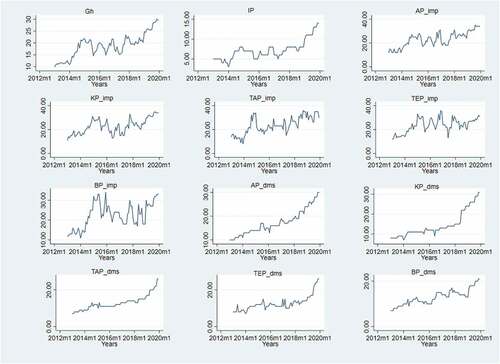
depicts the price trends of imported and domestically produced rice in the various markets in the given periods. The trend plots exhibited on the world market, Accra, Kumasi, Tamale, Techiman, and Bolgatanga show a similar pattern; that is these prices generally follows a steady increase (trending upwards) in the retail prices rice over time. Each market begins with prices being at their lowest for the start of January 2013 and gradually rising and falling. This can be associated with an increase in demand due to an increase in taste, income, and population over the years.
Figure 4. Price trend in various rice markets.
5. Empirical results
5.1. The extent of price transmission in ensuring availability and accessibility of rice
5.1.1. A cointegration results
presents the results of the test of cointegration between the various rice markets. This includes the calculated F-statistics for each ARDL OLS regression equation. The calculated F-statistic of 14.469 for model 1 exceeds the upper bound critical value of 7.84 at the 1% level. Thus, the null hypothesis of no cointegration is rejected, implying that prices of rice on the world market and Ghana have a long-run cointegration relationship. This corroborates with the findings of Amanor-Boadu (Citation2012) who found that the rice market in Ghana is not independent of the world market. In a similar study, Conforti (Citation2004) found higher transmission between the world and domestic markets in Latin America.
Table 4. Tests for cointegration between rice markets
About the Accra market against the other markets for imported rice, Table shows that the null hypothesis of no cointegration is again rejected, as the calculated F-statistic of 20.961 is greater than the upper bound critical value 5.06 at the 1% level.
In , the calculated F-statistic 7.190 is greater than the upper-bound critical value 5.06, indicating that there is a long-run relationship between the variables when prices in the Kumasi market are used as the dependent variable. This shows a long-run cointegration relationship among the Kumasi and other regional markets for imported rice. In the case of domestically produced rice, using the Tamale market as the dependent variable, the calculated F-statistic 3.92 is greater than the upper bound critical value 3.52, indicating the existence of a long-run relationship between the variables. Finally, the calculated F-statistic 3.412 when Bolgatanga market prices were used is greater than the lower bound critical value of 2.43 but less than the upper bound of 3.52. As a result, no decision could be made about the long-term relationship between the variables. The evidence of cointegration in markets ensures the existence of good price signal transmission through marketing channels, thereby ensuring efficient trade flows (Ghosh, Citation2000). Therefore, cointegration among regional markets for rice in Ghana iterates availability, whereby the various markets adjust to remove any glut and shortage. summarizes the long-run results obtained by normalizing the five dependent variables.
Table 5. Estimated long-run coefficients using the ARDL approach
5.1.2. The long-run impact of price
This section presents the results on the long-run impact of price on trade flows of rice between the world and Ghana and within Ghana’s regional markets to guarantee the availability of the commodity. The estimated coefficients of the long-run relationship show that world price has a very significant impact on the price of rice in Ghana (). The associated coefficient is positive and statistically significant. This result implies that the past trend of world price has an adverse impact (increases) on the current price of rice in the Ghanaian regional market. A 1% increase in world prices may lead to a 1.17% increase in prices in Ghana. Results examining the long-run relationship in the regional markets in Ghana showed that a 1% increase in prices of imported rice in Kumasi, Tamale, and Techiman will lead to a 0.33%, 0.51%, and 0.36% increase in the price of imported rice in Accra. Likewise, a 1% increase in the price of imported rice in the Bolgatanga and Accra market lead to a 0.52% and 1.3% increase in the price of imported rice in Kumasi. It is important to note that a unit increase in the price of imported rice in markets other than Accra has a lower impact on the price change as compared to an increase in the price of the same commodity in Accra in other markets. However, a price increase in the Techiman market has a negative effect on the price of rice in the Kumasi market. Here, a 1% increase in the price of imported rice in the Techiman market leads to a 1.15% fall in price in the Kumasi market. Based on the ensuing discussion, the existence of a long-run relationship in the rice markets guarantees trade flows between the world and Ghana and within Ghana’s regional markets, hence the availability of the commodity on the market.
The long-run relation in the regional markets for domestically produced rice is represented in models 4 & 5. The result shows that a 1% increase in the price of domestically produced rice in the Kumasi market leads to an increase in the price of the same commodity in Tamale market by 0.43% whereas a 1% increase in the price of rice in Kumasi market leads to a 0.2% reduction in price of rice in Bolgatanga market. Domestic production of rice in Bolgatanga is very high and so an increase in price in other markets signals an increase in production in Bolgatanga and hence the reduction in price. On the other hand, as seen in the results of model 5, a 1% increase in price of domestically produced rice in Tamale leads to a 0.9% increase in price of rice in Bolgatanga. Also, an increase in the price of domestically produced rice in Accra leads to a 0.3% increase in the price of rice in Bolgatanga market. See, Table . Since there exists a long-run relationship in the market for domestically produced rice, it allows the movement of the commodity from one market to another. This should safeguard the availability of domestically produced rice in the regional markets under study.
5.1.3. Short-run relationship and error correction model
In line with Banerjee et al. (Citation1998) and Pahlavani et al. (Citation2005), the highly significant error correction term in confirms the existence of a stable long-run relationship. It reflects the existence of a co-integration relationship already demonstrated by the earlier methods applied in this research. The ECM (−1) coefficients are (−0.38), (−0.72), (−0.39), (−0.46), and (−0.33) for models 1, 2, 3, 4, and 5, respectively, implying that the deviation from long-term price is corrected by 38 percent, 72 percent, 39 percent, 46 percent, and 33 percent in models 1, 2, 3, 4, and 5, respectively. In other words, the highly significant error correction term implies that for all models, the above-reported percentages of disequilibrium in the previous months are corrected in the current month. The speed of adjustment indicates the rapidity to which deviations in price is corrected to ensure continuous access to rice. Following the results in , the deviations in the price of rice across the various markets which affect the purchasing power of consumers are corrected within two months. That is, in the short run, errors that cause a reduction in consumers’ purchasing ability thereby reducing accessibility to rice are corrected within two months.
Table 6. Estimated coefficients of the short-run error correction
5.1.4. Volatility in the various markets
From the ARCH—GARCH (1,1) estimated model, presents the results of the conditional volatility as a measure of the stability of rice prices for the various markets. Since the positive limitation for the GARCH model is met, we are sure to state that the ARCH-GARCH model (1, 1) estimated is adequate. There are significant GARCH effects (β) for Accra, Bolgatanga, Tamale, and the World markets of the imported rice. The ARCH effect (α) parameters are significant for Accra and Tamale. Likewise, in the domestically produced rice markets, the GARCH effects (β) is significant for all the regional markets. On the other hand, the ARCH effect (α) is significant for all but not for the Accra market.
Table 7. Estimates of the ARCH-GARCH (1,1) model
The value of the GARCH effect of World price is statistically significant, demonstrating that a higher variance in the world market for rice dampens market activity for the commodity. From the coefficient of β, a 1% increase in past period variance may result in a 0.72% increase in present volatility. This is consistent with Moffitt and Zhang (Citation2020) hypothesizes that “volatility in the current time is related to its value in the previous period”. The price of imported rice in the various regional markets (Accra, Tamale, and Bolgatanga) shows that previous period variance increases current spikes by 0.98%, 0.35%, and 0.76%, respectively. On the other hand, the influence of past period volatility (α) on the current price for imported rice in Accra and Tamale markets is seen as 0.083 and 0.53. From the results, an increase in the price of rice at the global level is also consistent with rising rice price in Ghana’s regional markets, which has shown an increasing trend in recent years and a tendency to decline with difficulty. The same condition exists in other countries around the world (FAO, Citation2008; Fukase & Martin, Citation2020) because controlling price reduction is difficult.
A similar pattern can be seen in domestically produced rice markets. The coefficient of the α is positive and statistically significant indicating that an increased past period volatility of Tamale, Techiman, and Bolgatanga market prices may lead to a 0.52%, 0.28%, and 27% increase in the present period volatility in these regional markets. On the other hand, past period volatility in Kumasi market price leads to a decrease in present period volatility by 0.25%. Also, the coefficient of β for domestically produced rice reveals that a 1% increase in past period variance may result in a 0.90%, 0.4%, 0.71%, 0.63%, and 1.19% increase in present volatility in Accra, Tamale, Techiman, Bolgatanga, and Kumasi regional markets.
The conditional volatility in the imported rice market, is estimated to be 24.4%, 25.8%, 27.6%, 29.5%, 25.1%, and 26.1% for imported rice (). On the other hand, conditional volatility for domestically produced rice is lower. It ranged from 20.4% in Tamale, 21.7% in Techiman, 22.1% in Accra, 22.8% in Bolgatanga, to 29% in the Kumasi market.
Table 8. Results of conditional volatility
The findings are significant in Ghana because food security is frequently linked to the stability of staple foods in the country. Ghana’s population is growing (Bellemare, Citation2015; Kaba, Citation2020), and will undoubtedly increase food demand, coupled with the number of poor people, rice price volatility poses a threat to human sustainability. In line with Putra et al. (Citation2021), the extreme volatility of rice prices observed in the study over several periods in the Ghanaian regional market is an indication of instability of prices of rice, which may result in food insecurity.
Also, the results from the estimation revealed, “volatility import” from the world market to Ghana’s regional market. This affirms the assertion that price increases are passed on to consumers. As seen by many scholars, for instance, Ivanic and Martin (Citation2008), De Hoyos and Medvedev (Citation2011), Ivanic et al. (Citation2012), Wodon and Zaman (Citation2008), and Jacoby and Janger (Citation2013), the passing of such prices (increase) to consumers’ increases food insecurity level since most of these consumers spend a large portion of their incomes on food. We found price volatility for imported rice to be higher compared to domestically produced rice. This result suggests a significant upward pressure on imported rice and therefore may mean substitution of imported rice for domestically produced rice thereby resulting in upward demand for domestically produced rice.
6. Conclusion
This paper provides insight into the relationship between various markets for imported and domestically produced rice in ensuring the availability of the commodity. It further analyses the extent of price transmission in the domestic regional markets in relation to the accessibility of rice, and the effect of price changes on the stability of rice in Ghana. The study concludes that the world market and domestic markets are strongly co-integrated, allowing trade flows and ensuring the availability of rice in Ghana. There is a good transmission mechanism in the domestic markets for rice guaranteeing a well-integrated market with a stable long-run relationship thereby eliminating arbitrage in the marketing of rice. The strong price transmission is a result of the free trade of rice in Ghana and no substantial government interventions in the local market. It reiterates the accessibility of rice in various regional markets. The paper identifies high fluctuation in prices, implying that prices of both imported and domestically produced rice are not stable across all markets. The findings demonstrate a negative influence on the stability of imported rice for consumers as it reduces the purchasing power of consumers leading to food insecurity.
Based on the conclusions, the paper recommends that efforts should be made to ensure a more self-sufficiency in rice by increasing internal production of rice across the country, thereby safeguarding the availability and stability of rice. Stakeholders such as input suppliers, processors, traders, and support services along the local rice value chain should prioritise investment in the sector to boost production to reduce the high demand for imported rice. This can be achieved by building better infrastructure (processing plants, transportation system, warehouses, and market) to ensure better trading (accessibility) of rice among the various regional markets. Also, the government should leverage prices with giant import countries to reduce the cost of importation of rice thereby enhancing stability in the price of imported rice.
Acknowledgements
We are grateful to Prof. Bernhard Bruemmer and Dr. Dela Dem Fiankoh from the University of Goettingen, Germany for their insightful suggestions.
Disclosure statement
No potential conflict of interest was reported by the authors.
Additional information
Funding
Notes on contributors
Edward Ebo Onumah
Edward Ebo Onumah is a senior lecturer with specialty in Agricultural Economics at the Department of Agricultural Economics and Agribusiness, University of Ghana. His research interest transcends across productivity, efficiency, and risk analysis; food security investigation; economics of aquaculture and fisheries; and agricultural trade and market analysis.
Prince Addey Owusu
Prince Addey Owusu holds an MPhil in Agricultural Economics from the Department of Agricultural Economics and Agribusiness, University of Ghana. His research interests include price transmission and volatility analysis; risk assessment; and structural equation modelling.
Akwasi Mensah-Bonsu
Akwasi Mensah-Bonsu is an Associate Professor and Head, Department of Agricultural Economics and Agribusiness, University of Ghana. His areas of research include development economics and policy analysis; modelling of resource use and production efficiency; and benefit cost and project management.
Henry Acquah Degraft
Henry Acquah Degraft is a Professor of Quantitative Agricultural Economics and the Dean of the School of Agriculture in the University of Cape Coast, Ghana.
References
- Abdulai, A. (2000). Spatial price transmission and asymmetry in the Ghanaian maize market. Journal of Development Economics, 63(2), 327–17. https://doi.org/10.1016/S0304-3878(00)00115-2
- Abdulai, A., Sarris, A., & Hallam, D. (2006). Spatial integration and price transmission in agricultural commodity markets in sub-Saharan Africa. In S. Alexander & D. Hallam (Eds.), Agricultural commodity markets and trade: new approaches to analyzing market structure and instability (pp. 163–186). Edward Elgar Publishers.
- Addison, M., Sarfo-Mensah, P., & Edusah, S. E. (2015). Assessing Ghana’s initiative of increasing domestic rice production through the development of rice value chain.
- Amanor-Boadu, V. (2012). Rice price trends in Ghana (2006–2011) (METSS-Ghana Research and Issue Paper Series, (02–2012)). Department of Agricultural Economics, Kansas State University.
- Amikuzuno, J., Issahaku, G., & Daadi, E. B. (2013). Price transmission between imported and local rice markets in a liberalised economy: are Ghana’s rice wars just much I do about nothing? Computer Engineering and Intelligent Systems, 4(20), 109–119.
- Andam, K. S., Ragasa, C., Asante, S., & Amewu, S. (2019). Can local products compete against imports in West Africa? Supply-and demand-side perspectives on chicken, rice, and tilapia in Accra, Ghana (Vol. 1821). Intl Food Policy Res Inst.
- Angelucci, F., Asante-Pok, A., & Anaadumba, P. (2019). Analysis of incentives and disincentives for rice in Ghana. Gates Open Res, 3(1325), 1325. https://doi.org/10.21955/gatesopenres.1116230.1
- Archibald, D., & Taylor, J. (2019). Ghana grain and feed annual 2019 report. Global Agricultural Information Network Report, USDA Foreign Agricultural Service.
- Archibald, D., & Taylor, J. (2020). Ghana grain and feed annual 2019 report. Global Agricultural Information Network Report, USDA Foreign Agricultural Service.
- Armah, E., Kissi, E. A., & Fiankor, D. D. D. (2019). The impact of the national food buffer stock company on price transmission in Ghana. African Journal of Agricultural and Resource Economics, 14(311–2020–253), 169–183. https://ageconsearch.umn.edu/record/301040
- Banerjee, A., Dolado, J., & Mestre, R. (1998). Error‐correction mechanism tests for cointegration in a single‐equation framework. Journal of Time Series Analysis, 19(3), 267–283. https://doi.org/10.1111/1467-9892.00091
- Bellemare, M. F. (2015). Rising food prices, food price volatility, and social unrest. American Journal of Agricultural Economics, 97(1), 1–21. https://doi.org/10.1093/ajae/aau038
- Boansi, D. (2013). Response of rice output to price and non-price factors in Ghana.
- Braha, K., Rajcaniova, M., & Qineti, A. (2015). Spatial price transmission and food security: The case of Kosovo. No. 1054-2016-85976.
- Chen, D., Gummi, U. M., & Umar, A. S. (2019). The review on the link between food and oil markets in the view of price dynamics. American Journal of Industrial and Business Management, 9(9), 1890–1900. https://doi.org/10.4236/ajibm.2019.99122
- Conforti, P. (2004). Price transmission in selected agricultural markets. FAO Commodity and Trade Policy Research Working Paper, 7.
- Damba, O. T., Birinci, A., & Bilgiç, A. (2019). Estimation of short and long-run relationship between selected food prices and macroeconomic variables in Ghana. Atatürk Üniversitesi Ziraat Fakültesi Dergisi, 50(1), 92–105. https://doi.org/10.17097/ataunizfd.446309
- De Hoyos, R. E., & Medvedev, D. (2011). Poverty effects of higher food prices: a global perspective. Review of Development Economics, 15(3), 387–402. https://doi.org/10.1111/j.1467-9361.2011.00615
- FAO. (2008). Climate change adaptation and mitigation in the food and agriculture sector.
- FAOSTAT. 2020. FAO. http://www.fao.org/faostat/en/#data
- Fukase, E., & Martin, W. (2020). Economic growth, convergence, and world food demand and supply. World Development, 132, 104954. https://doi.org/10.1016/j.worlddev.2020.104954
- Ghosh, M. (2000). Cointegration tests and spatial integration of rice markets in India. Indian Journal of Agricultural Economics, 55(4), 616–626.
- Greene, W. H. (2003). Econometric analysis. Pearson Education India.
- Gujarati, D. N. (2004). Basic econometrics-gujarati. pdf. Basic Econometrics Fourth Edition, 394–398.
- Hagan, M. A. S., & Awunyo-Vitor, D. (2020). Factors influencing consumers’ preference for imported rice in Kumasi Metropolis, Ghana. Asian Journal of Economics, Business and Accounting, 15, 1–11. https://doi.org/10.9734/ajeba/2020/v15i130203
- Hamilton, H., Henry, R., Rounsevell, M., Moran, D., Cossar, F., Allen, K., & Alexander, P. (2020). Exploring global food system shocks, scenarios and outcomes. Futures, 123, 102601. https://doi.org/10.1016/j.futures.2020.102601
- Harris, R., & Sollis, R. (2003). Applied time series modelling and forecasting. Wiley.
- HLPE. (2011, July 1). Price volatility and food security HLPE report.
- IFAD. (2014). Vietnam’s rice production threatened by climate change. Retrieved March 10, 2022, from https://www.ifad.org/en/web/latest/-/story/vietnam-s-rice-production-threatened-by-climate-change
- Ivanic, M., & Martin, W. (2008). Implications of higher global food prices for poverty in low-income countries. The World Bank.
- Ivanic, M., Martin, W., & Zaman, H. (2012). Estimating the short-run poverty impacts of the 2010–11 surge in food prices. World Development, 40(11), 2302–2317. https://doi.org/10.1016/j.worlddev.2012.03.024
- Jacoby, M. B., & Janger, E. J. (2013). Ice cube bonds: Allocating the price of process in Chapter 11 bankruptcy. Yale LJ, 123(4), 862. https://www.jstor.org/stable/23744539
- Johansen, S., & Juselius, K. (1990). Maximum likelihood estimation and inference on cointegration with application to the demand for money. Oxford Bulletin of Economics and Statistics, 52(2), 169–210. https://doi.org/10.1111/j.1468-0084.1990.mp52002003.x
- Jordanov, B., Andersson, H., Georgiev, N., & Martinovska-Stojcheska, A. (2013). Price dispersion in neighboring countries in the western Balkans-the case of the Macedonian tomato industry. Journal of Central European Agriculture, 14(1), 363–377. https://doi.org/10.5513/JCEA01/14.1.1209
- Kaba, A. J. (2020). Explaining Africa’s rapid population growth, 1950 to 2020: trends, factors, implications, and recommendations. Sociology Mind, 10(4), 226–268. https://doi.org/10.4236/sm.2020.104015
- Kuwornu, J. K., Mensah-Bonsu, A., & Ibrahim, H. (2011). Analysis of foodstuff price volatility in Ghana: implications for food security. European Journal of Business and Management, 3(4), 100–118.
- McDonald, B. L. (2010). Food security. Polity.
- Minot, N. (2011, January). Transmission of World food price changes to markets in Sub-Saharan Africa. http://www.ifpri.org/publication/transmission-world-food-price-changes-markets-sub-saharan-africa
- Mittal, A. (2009). The blame game. The Global Food Crisis, 13. http://www.thehindubusinessline.com/
- MoFA (Ministry of Food and Agriculture). (2018). Agricultural sector annual progress report.
- MoFA-IFPRI. (2020). Ghana’s rice market. Market brief No. 2. International Food Policy Research Institute.
- Moffitt, R. A., & Zhang, S. (2020). Estimating trends in male earnings volatility with the panel study of income dynamics (No. w27674). National Bureau of Economic Research
- Obirih-Opareh, N. (2008). Socio-economic analysis of rice production in Ghana: agenda for policy study. Ghana Journal of Agricultural Science, 41(2), 203–212. https://doi.org/10.4314/gjas.v41i2.48796
- Olila, D. O., Wanjau, K., Pambo, K., Chimoita, E. L., & Odipo, T. (2016). Testing for Co-integration and granger causality: evidence from selected indigenous egg markets in Kenya. Journal of Marketing and Consumer Research, 19(80), 94.
- Onyuma, S., Icart, E., & Owuor, G. (2006, August 12–18). Testing market integration for fresh Pineapples in Kenya. Poster paper prepared for presentation at the international association of agricultural economist conference (pp. 1–16), Gold Coast, Australia.
- Oswald Spring, Ú. (2019). Food sovereignty and green agriculture. In D. Birgit, (Eds.), Úrsula oswald spring: pioneer on gender, peace, development, environment, food and Water (pp. 439–463). Springer.
- Pahlavani, M., Wilson, E., & Worthington, A. C. (2005). Trade-GDP nexus in Iran: an application of the autoregressive distributed lag (ARDL) model. American Journal of Applied Sciences, 2(7), 1158–1165. https://doi.org/10.3844/ajassp.2005.1158.1165
- Pesaran, M. H., & Pesaran, B. (1997). Working with microfit 4.0. Camfit Data Ltd, Cambridge.
- Pesaran, M. H., Shin, Y., & Smith, R. J. (2001). Bounds testing approaches to the analysis of level relationships. Journal of Applied Econometrics, 16(3), 289–326. https://doi.org/10.1002/jae.616
- Putra, A. W., Supriatna, J., Koestoer, R. H., & Soesilo, T. E. B. (2021). Differences in local rice price volatility, climate, and macroeconomic determinants in the Indonesian market. Sustainability, 13(8), 4465. https://doi.org/10.3390/su13084465
- Ragasa, C., Takeshima, H., Chapoto, A., & Kolavalli, S. (2014). Substituting for rice imports in Ghana. Ghana Strategy Support Program (GSSP) policy note 6. International Food Policy Research Institute.
- Rakotoarisoa, M. A. (2006). Policy distortions in the segmented rice market (No. 596-2016-40045).
- Ruby, O. (2012). Global food crisis: policy lapses or market failure? Advances in management.
- Sousa, P. (2017). What did we learn from the bout of high and volatile food commodity prices (2007–2013)? FAO Commodity and Trade Policy Research Working Papers, 54. http://www.fao.org/3/a-i7466e.pdf
- Tanaka, T., & Guo, J. (2020). How does the self-sufficiency rate affect international price volatility transmissions in the wheat sector? Evidence from wheat-exporting countries. Humanities and Social Sciences Communications, 7(1), 1–13. https://doi.org/10.1057/s41599-020-0510-8
- Udoh, E., Afangideh, U., & Udeaja, E. A. (2015). Fiscal decentralization, economic growth, and human resource development in Nigeria: Autoregressive Distributed Lag (ARDL) approach. CBN Journal of Applied Statistics, 6(1), 69–93.
- Wiebe, K., Dawe, D., & Stamoulis, K. (2011). Food prices and economic crises: causes and consequences for food security in developing countries. The Food and Financial Crises in Sub-Saharan Africa: Origins, Impacts and Policy Implications, 48–60 https://doi.org/10.1079/9781845938284.0048
- Wilson, E. J., & Chaudhri, D. P. (2004). A perspective on food policies evolution and poverty in the Indian Republic (1950–2001).
- Wodon, Q., & Zaman, H. (2008). Rising food prices in sub-Saharan Africa: Poverty impact and policy responses. The World Bank.
- Zereyesus, Y. A., Embaye, W. T., Tsiboe, F., & Amanor-Boadu, V. (2017). Implications of non-farm work to vulnerability to food poverty-recent evidence from Northern Ghana. World Development, 91, 113–124. https://doi.org/10.1016/j.worlddev.2016.10.015
