
 ?Mathematical formulae have been encoded as MathML and are displayed in this HTML version using MathJax in order to improve their display. Uncheck the box to turn MathJax off. This feature requires Javascript. Click on a formula to zoom.
Abstract
Ethiopia’s productive safety net program (PSNP) is aimed at providing transfers to the food insecure people in chronically food-insecure woredas. The program’s objectives include improving food security, protecting assets, and strengthening household and community resilience to shocks. This study evaluates the impact of PSNP on the beneficiary households’ food security, income, and asset holdings in the Gedeo administrative zone of Southern Ethiopia. We use survey data from 395 randomly selected households, out of which 195 are beneficiaries and 197 non-beneficiaries. Methodologically, we employ the propensity score matching (PSM) method to assess the impact of the PSNP on the welfare of beneficiary households. For this purpose, we use two specific outcomes of the PSNP: food security and asset holdings of participating households. Using the propensity score matching method, we find that the PSNP enhances the consumption expenditure, daily calorie intake, and annual income of participating households relative to a similar group of non-participating poor households. Our findings suggest that the PSNP is vital to improving income and food security at the household level in chronically food-insecure areas.
1. Introduction
Chronic food insecurity has been a defining feature of poverty that has affected millions of Ethiopians for decades. The vast majority of these extraordinarily poor households live dominantly in rural areas that are heavily reliant on rain-fed agriculture; thus, in years of poor rainfall, the threat of widespread starvation is high (Gilligan et al., Citation2009). It is reported that Ethiopia takes the first rank among food aid recipient countries in Africa and is listed as one of the countries with the largest aid recipients in the world for the past two decades (G. Tadesse, Citation2018). Ethiopia remains food insecure and hence dependent on food aid for the last four decades due to the failure of the country’s agriculture to feed the growing population coupled with other political and cultural problems (Gilligan et al., Citation2009).
Since the infamous 1983–1984 Ethiopian famine, the policy response to food insecurity has been a series of ad hoc emergency appeals on a near-annual basis for food aid and other forms of emergency assistance which are then delivered either as payment for public works or as a direct transfer. While these measures succeeded in preventing mass starvation, especially among those with no assets, they did not avoid the threat of further famine, nor did they prevent asset depletion by marginally poor households (Gilligan et al., Citation2009). As a result, the number of individuals in need of emergency food assistance tends to rise over time. Further, the ad hoc nature of food aid and emergency responses meant that the provision of emergency assistance which often takes the form of food-for-work programs was not integrated into ongoing economic development activities. In other words, safety net expenditures have not been used to fund investments that lift longer-run impediments to growth (Smith & Subbarao, Citation2003). Although emergency food aid has been contributing a lot to alleviating starvation, it had problems of uncertainty in availability, poor timing in the provision, and insufficiency in the quantity of the aid and finally creating dependency syndrome on recipients (Smith & Subbarao, Citation2003; Andersson et al., Citation2011).
To reduce dependence on food aid and achieve an acceptable level of food security at the household and national level, the government of Ethiopia developed a food security strategy (FSS) in 1996 (Government of Federal Democratic Republic of Ethiopia, Citation2002). Based on the FSS, the government designed regional food security programs and projects in 2002. To address the long term problem of food insecurity and change the previous system of annual emergency appeals, the Ethiopian government along with development partners initiated a new social protection program known as the Productive Safety Net Program (PSNP) in 2005 (Hoddinott et al., Citation2012); (Berhane et al., Citation2017); (Gilligan et al., Citation2009); (Andersson et al., Citation2011). PSNP is currently the largest social protection program operating in Sub-Saharan Africa outside of South Africa. The program has also been operating in the Gedeo administrative zone of southern Ethiopia, the geographic scope of this study, starting from 2005. It is operating in four districts of the zone specifically Dilla Zuria, Wonago, Yirgacheffe, and Kochore.
Ethiopia’s PSNP is aimed at delivering transfers to the food insecure population in chronically food-insecure woredas in a way that prevents asset depletion at the household level and creates assets at the community level as well as bridging the food gap that arises when, for these households, food production and other sources of income are insufficient given food need (Ministry of Agriculture and Rural Development, Citation2004). The intervention underscores reducing households’ vulnerability, building household and community assets to their resilience to shocks, and breaking the cycle of dependence on food aid through two main components–public works (PW) and direct support. PW creates a labor market for unskilled labor, primarily by involving them in labor-intensive, community-based activities like soil and water conservation, feeder roads, social infrastructures such as primary schools and health posts, water supply projects, and small-scale irrigation which will be accessible to household asset building. On the other hand, direct support is a small portion of PSNP and delivers assistance to members of the community who cannot participate in public works (Andersson et al., Citation2011).
The PSNP serves as a safety net, intended to enable households to smooth consumption so that they will not need to sell productive assets to overcome food shortages. It is complemented by a series of food security activities, collectively referred to as the Other Food Security Programs (OFSP). Beneficiaries of the OFSP receive at least one of several productivity-enhancing transfers or services, such as agricultural extension services, access to credit, and technology transfer (Bahru et al., Citation2020). While the PSNP is targeted at protecting existing assets and ensuring a minimum level of food consumption, the OFSP is designed to encourage households to increase the income generated from agricultural and non-agricultural activities and to buildup assets (Gilligan et al., Citation2009); (Hoddinott et al., Citation2012); (Berhane et al., Citation2017).
A central issue that has attracted the attention of academics and policymakers is whether the PSNP has been effective in meeting its major goals. Despite being the largest social protection program in sub-Saharan Africa (SSA; Gilligan et al., Citation2009), evidence suggests that the extent to which the PSNP intervention improves the welfare of beneficiary households remains contentious. A study by study Gilligan et al. (Citation2009) found no difference in the growth rates of caloric acquisition between participating and non-participating households between 2006 and 2008 in Ethiopia. Similarly, Berhane et al. (Citation2014) found no evidence for changes in caloric acquisition between 2006 and 2010. A recent study by Bahru et al., (Citation2020) found that PSNP had no impact on the caloric consumption of its beneficiaries. On the other hand, Gebrehiwot and Castilla (Citation2019) found that participation in the PSNP had a positive impact on average daily calorie consumption per person in PSNP-beneficiary areas relative to non-beneficiaries of the program. Similarly, using a different measure of food security (months of food gap), Berhane et al. (Citation2014) found that public work has improved food security by 1.29 months between 2006 and 2010 in Ethiopia. Likewise, Welteji et al. (Citation2017) also find that PSNP improves the food security of the beneficiary households in the Bale Zone of Ethiopia. In summary, while some studies reported a positive impact of the program, other investigations found that PSNP had no impact on the food security situation of its beneficiaries.
Aside from the food security impact of the program, other investigations evaluated the effect of the program on asset accumulation and protection during shock. Berhane et al. (Citation2014) affirmed that PSNP improves the asset holding capacity of participating households in Ethiopia. On the other hand, Andersson et al. (Citation2011) show that PSNP has no effect on the asset holdings of beneficiaries during shock season. They even went further to conclude that public work intervention has either a negative impact or no impact at best on asset building. Depending on the choice of outcome indicators used to evaluate the program, previous studies reported significantly different findings.
The highly inconclusive nature of the extant literature on the effectiveness of PSNP suggests the importance of providing evidence from a new case study area where the effectiveness of PSNP has not been previously well documented. To contribute to the pool of knowledge on the effectiveness of PSNP, we use the Gedeo administrative zone as a case study area. The Gedeo administrative zone is one of the major food-insecure areas in Ethiopia and remains the major target of the program since 2005. However, to the best of our knowledge, there is limited evidence evaluating the impact of the PSNP on the welfare of beneficiary households in the Gedeo zone. Thus, this study is primarily motivated by the paucity of evidence on the welfare impacts of the PSNP in the Gedeo administrative zone of southern Ethiopia. Perhaps, given the key goals of the PSNP and the duration over which the program has been implemented in the Gedeo zone, it is vital to examine the welfare impact of PSNP on beneficiary households.
Aside from the limited evidence on the impact of PSNP in the study area, there is an argument that the impact of PSNP could be area-specific. In this regard, in a general equilibrium impact assessment of PSNP in Ethiopia, Filipski et al. (Citation2017) concluded that the impact of PSNP varies significantly from one area to the other, and even from village to village. Based on a community-level investigation, they concluded that the real income varies significantly from place to place. Such variations across locations suggest that testing the effectiveness of PSNP using evidence from a new study area is more interesting.
Aside from using a new case study area, this study differs from previous studies in the type and dimensions of PSNP outcomes considered for evaluation. Previous studies have mostly focused on the impact of the program on improvements in food security status alone (Bahru et al., Citation2020; Berhane et al., Citation2014), or asset accumulation of the participating households (Andersson, Mekonnen, & Stage, Citation2009). The goal of the program, however, is to reduce vulnerability through strengthening asset holdings at the household and community level and finally break the dependence on food aid. For this reason, instead of relying on one of the goals of the program, a sound impact assessment of the PSNP shall jointly consider its contribution towards food security, asset accumulation, and income of program participants. In particular, while the literature documents that the PSNP has been successful in improving food security status, whether it had a significant impact on household asset accumulation is not well documented. Thus, this study assesses the impact of PSNP on beneficiary households’ food security, asset accumulation, and income using survey data obtained from 395 households from the Gedeo administrative zone of Southern Ethiopia.
Using the propensity score matching (PSM) method, our analysis evaluates the contribution of PSNP towards improvements in income, food security, and asset accumulation of program participants. Rather than using a single indicator, we employ several indicators for each outcome variable. Food security is proxied by daily calorie intake per adult equivalent, annual consumption expenditure per adult equivalent, and annual household experience of food shortage while the asset holding outcome is proxied by livestock holdings and housing condition of the household.
We find that the PSNP has improved the annual consumption expenditure, daily calorie intake, and income for beneficiary households in the Gedeo administrative zone of southern Ethiopia. Our finding informs that PSNP can make a substantial contribution towards enhancing food security and the income of households participating in the program.
The remainder of the paper is organized as follows. Section two presents a review of the extant literature, and section three offers the materials and methods used to analyze the data. Section four reports the results and discusses the findings, and the final section draws concluding remarks.
2. Literature review: an overview
The PSNP has a goal of reducing household’s vulnerability, building household and community assets to their resilience to shocks and stresses to breaking the cycle of dependence on food aid. There is growing literature on the impact of social protection programs. In this section, some of the key studies on the effectiveness of social protection programs are surveyed.
In Ethiopia, Gilligan et al. (Citation2009) study was the first extensive investigation, which took place 18 months after the PSNP was implemented. The impact of PSNP on food security and asset holdings was explored in this study. The PSNP had no impact on specific outcomes, according to the report, in part because transfer levels were substantially below program targets. Beneficiaries who received at least half of the targeted transfer showed a considerable improvement in food security by some indicators such as the food gap. The outcome is different for a household that received both PSNP and other packages, such as agricultural support. These households were more likely to be food secure because they were able to borrow money for productive causes, use improved agricultural technologies, and operate their non-farm business activities.
Berhane et al. (Citation2014) used a dose-response impact evaluation method to assess the program’s impact on two major outcomes of the program (food security and asset accumulation) in Ethiopia between 2006 and 2010. They discovered that public work intervention improves the treated groups’ food security situation, with the program extending food security by 1.29 months. Using caloric availability as a metric of food security, on the other hand, they discovered that the PSNP’s Public Works employment component did not affect participating households’ caloric acquisition. In contrast, Gebrehiwot and Castilla (Citation2019) found a 13.4 percent increase in average daily calorie consumption per person in PSNP-affected areas, demonstrating that the program is effective in reducing household food insecurity.
A recent study by Hidrobo et al. (Citation2018 examined the role of social protection on food security and asset accumulation in developing nations and came to the same conclusion. They discovered that social protection programs increase the quantity and quality of food consumed by recipients. On average, the value of food consumed/expenditure and caloric acquisition increases as a result of the social protection program. It is noted that households use transfers to increase the quality of their diet, most notably increasing their consumption of calories from animal source foods, hence food spending rises faster than calorie acquisition (Hidrobo et al. Citation2018.
A study by Miller & Tsoka (Citation2010) examines the influence of cash transfers on household food security or welfare in Malawi using difference-in-differences. In contrast to the comparison group, cash receivers consumed a diverse and enough amount of food daily without experiencing many days of food shortage. Recently, Brugh et al. (Citation2018) investigated the influence of cash transfers on food and nutrition security among Malawi’s ultra-poor and vulnerable households. They found that the program had a positive influence on beneficiary households’ food quantity and caloric acquisition. Furthermore, the program has been shown to minimize the likelihood of being food-energy deficient and depth of hunger among participating households.
Maitra and Ray (Citation2003) used household-level data from South Africa and employed an econometric method to examine the behavioral and welfare impacts of private and public transfers. Their results show that crowding out of private transfers as a result of the introduction of public pensions holds only for poor households and not for the non-poor. Both private transfers and public pensions significantly reduce poverty but private transfers have a larger impact on expenditure patterns.
Using marginal structural modeling, Bahru et al., (Citation2020) evaluated the impact of PSNP on beneficiary households’ food security and child nutrition. While they found that PSNP did not affect the food security situation of the beneficiaries, the program was found to increase the meal frequency of children. A study by Gebrehiwot and Castilla (Citation2019), on the other hand, found that participation in the PSNP had no effect on child nutrition measured by height-for-age or the probability of being stunted. Other studies, for instance, Hoddinott et al. (Citation2009) examined the impact of the PSNP on children’s school attendance and labor. They found that the program had a positive effect on child labor while it did not affect school attendance.
Empirical studies also evaluated the asset accumulation impact of the program. Andersson et al. (Citation2011) evaluated the effect of the program on asset protection during shock. Their study found that PSNP has not contributed to the asset holdings of its beneficiaries during shock season. They concluded that public work intervention had either a negative impact or no impact at best on asset building. On the other hand, Berhane et al. (Citation2014) revealed that five years of participation in the PSNP raises livestock holdings at the household level by 0.38 TLU relative to receipt of payments in only one year.
In summary, despite the short time in which they have been operating, several SSA social protection programs have achieved positive impacts on consumption, food security, and health (Brugh et al. Citation2018). However, evidence on the impact of social protection programs appears to be mixed. While some studies found a positive impact of the program on some measures of outcome, others reported that social protection had no impact. The reviewed literature suggests that the significant variation in the findings of previous studies emerges from variations in the choice of outcome indicators used to evaluate the program, the study site, and the types and nature of social protection programs. Such differences may contribute to the inconclusiveness of the extant studies. A comprehensive study by Filipski et al. (Citation2017) evaluated the general equilibrium impact of PSNP in Ethiopia. In the first stage, a household impact analysis of PSNP is made to determine whether it has impacted the beneficiaries in a certain way and non-beneficiaries as well. Then, the study was extended to analyze the impact of the PSNP on the local economy as a whole. Finally, a computable general equilibrium (CGE) modeling was applied to see the impact of PSNP on the national economy. The authors found that some outcomes of the program are positive and significant in some villages, while they appeared to be negative in other cases. For this reason, it is important to examine the impact of the PSNP on the food security, asset accumulation, and income of participating households using an array of indicators for each selected outcome variable.
3. Materials and methodology
3.1. The study area
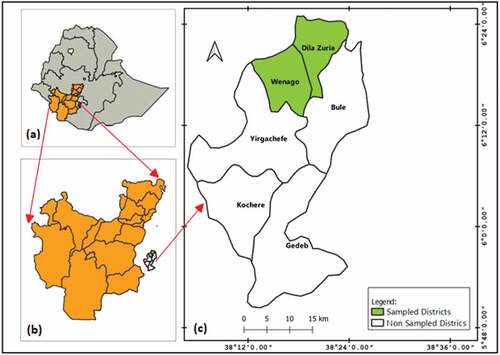
The Gedeo zone is located 369 km from the capital Addis Ababa to the south on the main highway from Addis Ababa to Kenya. Administratively, it lies in Southern Nation Nationalities and People Regional (SNNPR) State. Geographically, it is located north of the equator from 5°53ʹN to 6° 27ʹN latitude and from 38° 8’ to 38° 30ʹeast longitude (Figure ). The altitude ranges from 1500 m to 3000 m above sea level. The Gedeo highland has a sub-humid tropical climate and receives a mean annual rainfall of 1500 mm. The mean annual temperature range is 12.6–22.4°C. Gedeo is one of the major coffee-producing zones of the regional state. The Gedeo agroforestry is the origin of one of the most internationally recognized organic coffee brands in the globe, the “Yirgachefe” coffee. The land use of Gedeo comprises 80 percent cultivated, 19 percent pasture, and 1 percent forest. The agroforestry area covers 89,239.7 ha approximately, which is 69.3 percent of the total area of the Gedeo zone (K. K. Tadesse, Citation2002), (Sileshi, Citation2016). The average rural household has 0.3 hectares of land compared to the national average of 1.01 hectares and regional average of 0.89 and the equivalent of 0.2 heads of livestock.
Figure 1. Map of the study area: (a) map of Ethiopia, (b) map of SNNPR, (c) map of Gedeo zone.
3.2. The need for the study
Though there are areas characterized by land fragmentation and high population density in Ethiopia, the situation in the Gedeo Zone is exceptional. The Gedeo zone is of interest because the sampled districts (notably Wonago woreda) are known for having one of the highest fertility rates and population density not only in Ethiopia but also in Africa. These features have important ramifications for household food security and asset holdings. Against this backdrop, it is indispensable to understand whether PSNP works in improving income, food security, and asset holdings in the face of extremely low and declining landholding size (which is below the national average) and unusually high population density. Our assessment is instrumental in informing whether PSNP works in such areas characterized by extremely low landholding size and unusually high population density.
Aside from using a new case study area, our study is different from previous studies in the following dimensions. First, demographic (sex, age, family size), economic, institutional (access to credit, agricultural extension services), and market-related factors have important roles in affecting household welfare and participation in the program. This suggests that a comprehensive impact assessment needs to control these important factors in the estimation of the impact of the PSNP. Accordingly, the role of all possible factors affecting participation and outcome of PSNP is included and adequately controlled in our methodology.
Second, except for some studies, previous studies often focus solely on one of the outcomes of the PSNP. This study rather evaluated the effectiveness of the program on three key program outcomes: food security, asset accumulation, and household income. Since graduation from the program entails improvements both in food security and asset holding at household levels, it is important to evaluate whether improvements in one of the program outcomes (for instance, food security) are accompanied by favorable changes in the other outcomes (e.g., asset holding).
Third, instead of using a single indicator of outcome, we employ several indicators for each outcome variable. Unlike other investigations that rely on one or two measures of food security, here food security is measured by daily calorie acquisition per adult equivalent, annual consumption expenditure per adult equivalent, and annual food shortage experienced by the household. The asset holdings outcome is proxied by livestock holdings and the quality of housing owned by the household. This is important since the type of food and diversity of nutrients consumed by households vary by location with implications for achieving food security. In this way, this study evaluates the impact of the program on food security, asset accumulation, and income using a set of indicators for each outcome variable.
Finally and importantly, the other important reason to support this study is that we evaluated the PSNP after four years of operation (2016–2020) in the study area. For instance, this contrasts with the pioneering study of Gilligan et al. (Citation2009); for they undertook their evaluation only after the first year of implementation of the program.
3.3. Method of data collection and sampling techniques
3.3.1. Source and method of data collection
We rely primarily on primary data obtained from a household survey. The primary source of data was a survey of participating and non-participating households using a structured questionnaire.
3.3.2. Target population and sampling strategy
The geographic focus of this study is the Gedeo Zone. Gedeo Zone comprises eight Districts or woredas namely Dilla Zuriya, Wonago, Yirgachefe, Bule, Gedeb, Chorso, Rephe, and Kochorie. Currently, the PSNP is operating in four districts of the zone i.e. Dilla Zuriya, Wonago, Yirgachefe, and Kochorie targeting 15,190 households.
To select sample households, we follow a three-stage random sampling technique. First, among the four PSNP woredas (districts), we selected two woredas namely Dilla Zuriya and Wonago randomly. PSNP has been operating in these districts since 2016. Second, from the selected PSNP woredas, we selected a random sample of PSNP kebeles. Finally, from these selected kebeles,Footnote1 a random sample of PSNP beneficiaries and non-beneficiaries are selected and interviewed. The sample size reported in is determined using Yamane’s (1964)Citation1964 sample size determination formula;
Table 1. Sample households
Where n is the desired sample size, N is the total study population, e stands for the level of precision which is set at 0.05. Accordingly, 395 PSNP beneficiaries and non-beneficiaries were surveyed.
3.4. Evaluation methodology
3.4.1. Participation equation: logistic model
This study employs the PSM method to evaluate the impact of the PSNP on food security, asset holdings, and income of participating households. The PSM approach involves constructing a statistical comparison group by modeling the probability of participating in the program based on some observed factors unaffected by the program. In fact, before quantifying the impact of the program on the selected outcomes, the first step is estimating the participation equation. Accordingly, we specify the participation equation using the logistic model, where the dependent variable, that is, program participation takes 1 when a household participates in PSNP and 0 otherwise. Mathematically, the Commutative or Logistics Distribution Function (CDF) model can be written as;
So if (Pi) is a probability of participating in the program, then (1-Pi) is the probability of not participating will be
Therefore taking the ratio of both probabilities the result can be written as,
Simply (Pi/1-Pi) is the Odd-Ratio of participating in PSNP—the ratio of the probability that the household participates in the program to the probability that the household does not participate in PSNP.
Finally taking a natural logarithm to Odd-ratio:
Where Zi =+
X1 + β2X2 + … +βknXk +Ui
is the intercept,
regression coefficients to be estimated, Xi is pre-intervention characteristics and Ui is the disturbance term.
In Equationequation (5)(5)
(5) , the odds ratio is not only linear in Xs but also from equation points of view it is linear in parameters. According to Rosenbaum and Rubin (Citation1983) and Caliendo and Kopeinig (Citation2008), the propensity score generated through a logistic model should include a predictor variable that influences participation in the program and the outcome of interest. Based on previous studies and practical and theoretical knowledge, demographic, socio-economic, and institutional factors are included as regressors. A description of the explanatory and outcome variables is provided in .
Table 2. Variable description, measurement, and expected signs
3.4.2. Propensity score matching (PSM)
The fundamental problem for a quantitative impact evaluation of a program is only what happens to beneficiaries who are receiving benefits is observable; in which what would happen to the same households if they did not receive benefits do not observe. This is called the problem of the counterfactual. A second issue is selection bias. Selection bias arises when beneficiaries differ in some systematic way from non-beneficiaries since beneficiaries and non-beneficiaries differ even in the absence of the program. So in assessing the effectiveness of a program that lacks randomization, the Propensity Score Matching (PSM) method solves this problem. Perhaps, when random assignment is not possible, we use propensity score matching to control for bias in a treatment effect of quasi-experimental designs (Lane et al., Citation2012); (Rosenbaum & Rubin, Citation1983). In the PSM method, the program beneficiaries and non-beneficiaries are compared by using pre-program intervention characteristics that affect program participation. With this matching method, one tries to develop a counterfactual or control group that is as similar to the treatment group as possible in terms of observed characteristics. Practically, the idea is to find from a large group of non-participants, individuals who are observationally similar to participants in terms of characteristics not affected by the program (Caliendo & Kopeinig, Citation2008).
PSM constructs a statistical comparison group by modeling the probability of participating in the program based on observed characteristics unaffected by the program (Khandker et al., Citation2010). Participants are then matched based on the propensity score to non-participants using different methods. The average treatment effect of the program is then calculated as the mean difference in outcomes across these two groups. On its own, PSM is useful when only observed characteristics are believed to affect program participation. Subsequently, outcomes of participating and nonparticipating households with similar propensity scores are compared to obtain the program effect. In the process, households for which no match is found are dropped because no basis exists for comparison (Caliendo & Kopeinig, Citation2008); (Khandker et al., Citation2010).
In the case of a binary treatment, the treatment indicator D equals “1” if individual “i” receives treatment and “0” otherwise. The potential outcomes are then defined as Yi (Di) for each individual i, where i = 1 … … ., N and N denote the total sample. The treatment effect for an individual can be written as:
Where: Ti = the treatment effect
Yi (1) = the outcome of the treated or program beneficiary
Yi (0) = the outcome of non-treated or control group
The fundamental evaluation problem arises because only one of the potential outcomes is observed for each individual i. The unobserved outcome is called the counterfactual outcome and hence estimating the individual treatment effect Ti is not possible. So the average treatment effect (ATT) on the treated will be calculated as follows:
Where: TATT = Average treatment effect on treated
As the counterfactual mean for those being treated—E[Y(0) |D = 1]—is not observed, one has to choose a proper substitute for it in order to estimate ATT. Using the mean outcome of untreated individuals E[Y(0) |D = 0] in a non-experimental studies usually is not a good idea. For ATT it can be noted as:
The true parameter TATT is only defined, if:
The above equation of treatment effect holds only if Rosenbaum and Rubin (Citation1983) underlying assumptions hold.
Conditional independence
Common support (Overlap)
When the two assumptions satisfy, according to Rosenbaum-Robin, the treatment assignment is strongly ignorable and units with the same value of balancing score b(X) but different treatments can act as a control to each other and specified as:
The expected difference in the treated mean is equal to the average treatment effect at the value of b(X) and the weighted average of such difference is an unbiased estimate of ATT. For strongly ignorable by Rosenbaum- Robin, PSM estimate for ATT is generally written as:
In other words, the PSM estimator is simply the mean difference in outcomes over the common support, appropriately weighted by the propensity distribution of the participants.
3.5. Limitations of the study
There are caveats to our methodological approach. Firstly, as it looks into the overall impact of the program on participating households, it fails to discern and compare the impact of the PSNP across age and gender categories. Secondly, we used data obtained from the head of the household. The assumption is that the household head is believed to be informed about every member of the household and believed to have information on the same. This is customary in most household-level studies that employ survey data. However, while the assumption that the household head has everyone’s perspective might ease the difficulty of approaching all household members, it may be subject to some recall biases as the perspectives of all household members may not be reflected adequately by the household head. Thirdly, as the PSNP deliberately focuses on chronically food insecure and highly vulnerable groups, participation in the program is usually not random. In some cases, inclusion into the program might be politicized and selection might be based on patronage. In such cases, employing the PSM may suffer from selection bias as differences in outcome between participants and non-participants of the program might be attributed to unobserved factors. To address this problem, we controlled for all pre-intervention observable characteristics that are correlated with participation in the program and the outcome variables.
4. Results and discussion
4.1. Descriptive statistics
This section summarizes the descriptive statistics of the variables used in the participation equation and the outcome variables. shows that among the 395 households surveyed, 198 (50.13 percent) are PSNP beneficiaries and the remaining 197 (49.87 percent) are non-beneficiaries of the program.
Table 3. Sample of the study
Table shows the summary of the descriptive statistics of the continuous variables used in the participation equation. The average family size of sample households is 5.88 and the mean differences in family size between PSNP beneficiary and non-beneficiary households are statistically significant at a 1 percent level of significance. In addition, the mean educational level for the treated and control households is 3.16 and 4.3 years, respectively and the mean difference in the educational level of the two groups is statistically significant at 1 percent. Looking at the mean landholding size of sampled households, the average landholding of the beneficiary and non-beneficiary households is 0.322 and 0.385 hectares, respectively. The test result also demonstrates that the mean difference in landholding size between the two groups is statistically significant at 1 percent.
Table 4. Descriptive statistics of household characteristics (Continuous variables)
Table summarizes the descriptive statistics of dummy variables used in the participation equation. While 57.7 percent of the sampled households have access to credit services, the remaining 45.3 percent reported that they have no access to credit. In terms of differences between the two groups, over 84 percent of the PSNP beneficiaries had access to credit services. On the other hand, only 15.66 percent of non-beneficiary sampled households had access to credit services. The chi-square test indicates that this difference between the two groups is significant at 1 percent. Regarding the practice of saving in the study area, 70 percent of the sampled households reported that they have the experience of saving in different rural microfinance institutions. While the majority of PSNP beneficiary households practice saving (89.85 percent), only 47.72 percent of non-beneficiaries engaged in some form of saving. The chi-square test result also suggests that the differences in saving practice between the two groups are statistically significant. This may be because the program encourages saving practices for beneficiaries.
Table 5. Descriptive statistics of household characteristics (dummy variables)
4.2. Estimation of propensity scores
This section presents the results of the logistic regression model employed to estimate propensity scores. The regression result in is tested for some basic model adequacy tests and the diagnostic results suggest that the model is adequate for analysis. The pseudo-R2 value of the estimated model result is 0.3968 which is low and indicates the allocation of the program has been fairly random (Pradhan & Rawlings, Citation2002); (Caliendo & Kopeinig, Citation2008).
Table 6. Logistic regression results
shows that out of the 12 covariates used as a regressor in the participation equation, only 6 explanatory variables (family size, access to credit service, saving practice, size of land holdings, level of education, and access to extension service) are found to be important in significantly affecting participation into the PSNP. Access to credit, family size, and saving practice affect the probability of households’ participation in the program positively and significantly while the level of education, access to agricultural extension services, and the size of land holdings lower the probability of participation in the PSNP. This result supports the earlier findings by Andersson et al. (Citation2011). Since the major purpose of the participation equation is to estimate the propensity scores, the analysis of the estimated coefficients is kept to a minimum. We rather emphasize on analysis of the ATT results.
4.3. The impact of the PSNP
4.3.1. Matching treated and control groups
Before conducting the matching, four important tasks must be carried out. First, estimating the predicted values of program participation (propensity score) for all the sample households of both program and control groups. Second, imposing a common support condition on the propensity score distributions of households with and without the program is another important task. Third, discarding observations whose predicted propensity scores fall outside the range of the common support region is the next work. Fourth, conducting a sensitivity analysis to check the robustness of the estimation is the final task.
4.3.2. Imposing the common support region and balancing tests
The distribution of estimated propensity scores is reported in . The estimated propensity scores vary between 0.0692 and 0.941 (mean = 0.697) for treated households and between 0.00096 and 0.943 (mean = 0.265) for control households. The common support region lies between 0.0692 and 0.943 which means households whose estimated propensity scores are less than 0.0692 and larger than 0.943 are not considered for the matching purpose. Accordingly, 22 households were discarded from the estimation.
Table 7. Distribution of estimated propensity scores
4.3.3. Choice of matching algorithm
In we employ different alternatives of matching estimators to match the treatment group and control group that fall in the common support region. Wahba and Dehejia (Citation2002) and Caliendo and Kopeinig (Citation2008) suggest that the decision on the final choice of an appropriate matching estimator is based on three different criteria. First, the equal means test (referred to as the balancing test) suggests that a matching estimator which balances all explanatory variables (i.e., insignificant mean differences between the two groups) after matching is preferred. Second, a matching estimator that generates the smallest pseudo-R2 value is preferable. Third, a matching estimator that results in the largest number of matched sample sizes is preferred. In summary, a matching estimator that balances all explanatory variables, with the lowest pseudo-R2 value and produces a large matched sample size is preferable. Based on these criteria, the nearest-neighbor matching of neighborhood 4 (NN4) is chosen for estimation ().
Table 8. Matching algorithm result
4.3.4. Testing the balance of propensity score and covariates
After choosing the best-performing matching algorithm, the next task is to check the balancing of propensity scores and covariates using different procedures by applying the selected matching algorithm (NN4). The balancing powers of the estimations are ensured by different testing methods such as reduction in the mean standardized bias between the matched and unmatched households, equality of means using t-test and chi-square test for joint significance of the variables. presents the propensity score and covariate balance tests.
Table 9. Propensity score and covariate balance test
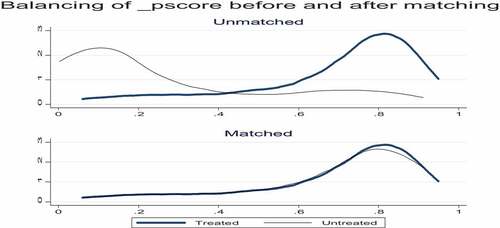
The standardized difference in covariates ranges from 0.4 percent to 148 percent in absolute value before matching but it narrowed strictly to 0 percent and 18 percent after matching. This is fairly below the critical level of 20 percent suggested by Rosenbaum and Rubin (Citation1983). Therefore, the process of matching creates a high degree of covariate balance between the treatment and control samples. The t-values of covariates show that out of seven covariates that were significant before matching, only one covariate became significant after matching. There is also a considerable difference in the propensity scores for treated and control groups before matching but after matching the difference is reduced and became balanced. While the mean difference of propensity scores was significant before matching, it turns out to be balanced after matching and ended up with no significant difference between the two groups. This is also shown in .
Figure 2. The propensity score distribution for balancing tests before and after matching.
In Table low pseudo-R2 value and the insignificant likelihood ratio tests support the hypothesis that both groups have the same distribution in the covariates after matching. This indicates that the matching procedure balances the characteristics in the treated and the matched comparison groups. Hence, these results can be used to assess the impact of PSNP among groups of households having similar observed characteristics. This enables us to compare observed outcomes for treatments with those of the control groups sharing a common support region.
Table 10. Chi-square test for the joint significance of variables
4.3.5. Treatment effect on the treated (ATT)
Several authors, for instance, Smith and Todd (Citation2005),and Caliendo and Kopeinig (Citation2008), suggest using several PSM estimators. As such, we implemented Kernel, Caliper, and Nearest-neighbor matching estimators using the PSM algorithm developed by Leuven and Sianesi (Citation2003). Several tests were performed to select a preferred estimator. A preferred estimator is the one that yields statistically identical covariate means for both groups (Caliendo & Kopeinig, Citation2008) that provides a low pseudo-R2 value (Leuven & Sianesi, Citation2003) and statistically insignificant likelihood ratio test of all regressors after matching (Smith & Toddy, 2005). In particular, a rejection of the group means difference test after matching implies a good balancing of the covariates. Guided by the above indicators, we chose the nearest neighbor matching with a neighbor of 4 as our best estimator.
Following the computation of all necessary procedures, then we estimate the impact of the program on beneficiary households’ food security and asset holding. Food security outcome is proxied by daily calorie intake per adult equivalent per capita, annual consumption expenditure per adult equivalent in ETB, and annual household experience of food shortage. Asset holding outcome is proxied by livestock holding in tropical livestock units, and the housing condition of the household. Total household income is the mean annual income earned from various sources including farm (crop sales), non-farm income, and transfers from the program.
According to the ATT results in Table , PSNP involvement improves two food security indicators: daily caloric consumption per capita per adult and annual consumption expenditure. The average daily calorie intake per capita for the treated and control groups is 2,305.85 and 2,013.15, respectively, after adjusting for pre-intervention variations in demographic, institutional, and socio-economic features of treatment and control households. The average daily calorie consumption per capita difference between the treatment and control groups is 292.7 kcal, which is statistically significant at 5 percent. In other words, the PSNP intervention boosted the calorie intake of beneficiary households by 14.7 percentage points higher than their non-PSNP counterparts. We find strong evidence that participation in PSNP enhances the caloric acquisition of households. Our finding contradicts previous studies on the calorie acquisition impact of PSNP. In this context, Gilligan et al. (Citation2009) study looked at the program’s impact on changes in calorie acquisition between 2006 and 2008. They found no difference in the growth rates of caloric acquisition between participating and non-participating households. Similarly, Berhane et al. (Citation2014) find no evidence for changes in caloric acquisition between 2006 and 2010.
Table 11. Average treatment effect on the treated (ATT) results
The ATT results also show that the mean annual consumption expenditure (ETB) of the PSNP participants and control group is 2,949.5 and 2,365.6, respectively. The mean difference in consumption expenditure (ETB 583.9) between the PSNP participants and non-participants is significant, albeit only at 10 percent. This suggests that PSNP has augmented the beneficiaries’ consumption expenditure by 26.2 percent relative to a similar group of non-participating poor households. Our result is similar to the findings of Welteji et al. (Citation2017). Without employing any robust impact evaluation strategy, Welteji et al. (Citation2017) reported that the PSNP improved beneficiary households’ food security by increasing the number of dining times and the quantity of food at each dining time. On the other hand, Bahru et al., (Citation2020) found that PSNP has not improved the food security situation of its beneficiaries, except by increasing child meal frequency.
In terms of the annual food gap experienced by the household, there is no difference between the treated and control groups. On the other hand, in a study evaluating the impact of the duration of participation in the PSNP in Ethiopia, Berhane et al. (Citation2014) reported that the PSNP has improved the food security of participating households by 1.29 months relative to households that received only one year of PSNP transfers. This is viewed to be equivalent to reducing the length of the hungry season by one-third.
In summary, looking at the food security impact of the program, our findings deviate from some of the extant studies in terms of the measures of food security and the magnitude of impacts. Previous studies reported that PSNP had resulted in improvement in one of the food security measures employed. On the other hand, our analysis finds that the PSNP improves both caloric acquisition and the value of food consumption or expenditure. Importantly, for both measures of food security, the magnitudes of the impacts are meaningful. This suggests that PSNP enhances the food security of program participants.
We also evaluated the impact of the program on household income earned from different sources. The household income includes earned from crop production and labor force participation in off-farm activities. Unlike other studies that focused on income earned from farm activities only, here we use the income earned from both farm and non-farm activities. That is, the innovativeness of our income measure lies in the inclusion of income earned from diverse sources. The ATT results show that the annual household income earned appears to be significant. The average annual income for the treated group is ETB 12,396 while it is only 7,859.6 for the control group. The test result also demonstrates that the mean difference in income earned by the two groups is statistically significant at 1 percent. The mean income earned by program beneficiary households increases by ETB 4,536.6 as a result of PSNP. That is, the income earned by program participants is 57.7 percent higher compared to similar non-PSNP beneficiary households. This suggests that participation in PSNP helps to improve the income and hence the livelihoods of poor rural households.
When it comes to the program’s impact on household asset holdings, the mean differences in housing conditions (as measured by the quality of roof type) and livestock holdings (TLU) between the two groups are negligible at conventional levels. That is, we found no evidence that participation in PSNP increases households’ livestock holdings or the quality of housing they own.
This is consistent with the findings of Andersson et al. (Citation2011) study, which found that PSNP did not affect participating households’ asset holdings during shock. In Ethiopia, Gilligan et al. (Citation2009) discovered that PSNP beneficiaries did not experience faster asset growth compared to non-PSNP households in Ethiopia. Our findings, on the other hand, contradict Berhane et al. (Citation2014) findings, which found that PSNP improves the asset holding status of participating households in Ethiopia. They reported that five years of participation in PSNP raises livestock holdings by 0.38 TLU relative to receipt of payments in only one year.
Our findings show that the program’s asset accumulation impact is negligible, despite its favorable impact on improving food security measures. For example, the program makes a negligible contribution to the enhancement of livestock holdings. Rural households without access to credit or insurance markets, as well as high discount rates, are said to invest in livestock assets partly as a precautionary measure rather than for enhanced production. As a result, if income security increases as a result of PSNP, they may be tempted to disinvest in such assets (Andersson, Mekonnen, & Stage, Citation2009). According to a study by Gilligan and Hoddinott (Citation2007), social protection measures in Ethiopia negatively affected livestock holdings. They claimed that the program’s negative impact on the growth rate of livestock holdings may be due to reduced demand for precautionary savings. However, unlike previous studies, our study does not find evidence of disinvestment in livestock holdings. PSNP’s goal is to stabilize before increasing asset accumulation. In this context, the somewhat larger livestock holdings among participating households (while not statistically significant) could indicate that PSNP enabled households to maintain their assets. Moreover, given that the PSNP has been operating since 2016, the asset accumulation impact of the program may turn out to be insignificant in this short period.
In the context of our study location, an additional argument is that the extremely low landholdings and significant population pressure may practically discourage investment in livestock holdings. In other words, households may choose to invest in other assets rather than livestock. As a result, the program’s effects on increasing livestock holdings may be less noticeable.
Our findings suggest that the PSNP improves the food security status and income of participating households. However, we find no evidence that PSNP improves the asset holdings of program participants. One of the goals of the PSNP is to prevent households from the depletion of their already low asset holdings. This is due to the notion that household assets are instrumental in coping with adverse income shocks.
Food security is closely tied to the performance of smallholder agriculture in Ethiopia. Aside from social protection programs, addressing food insecurity, in the long run, requires tackling the major causes of low productivity among smallholder farmers. Factors contributing to the poor performance of the agricultural sector and persistence of chronic food insecurity include frequent drought, extreme fluctuations of rainfall, low levels of agricultural technology generation and utilization, population growth and land degradation in the form of soil erosion, loss of soil fertility (Bekele & Holden, Citation2000). Besides, the basic structure of the agricultural sector itself has contributed to its low production and productivity. In the study area, agriculture is dominated by resource-poor farmers who primarily produce for subsistence. If the favorable impact of PSNP on food security is to be sustained in the long run, the program needs to be supplemented with other measures that enhance the productivity of smallholder agriculture. According to Berhane et al. (Citation2014), the program impacts were larger when safety net transfers were integrated with access to services designed to improve agricultural productivity.
4.4. Sensitivity analysis
Becker and Caliendo (Citation2007), and Ichino et al. (Citation2008) detail the sensitivity of the evaluation results to detect whether the identification of CIA was satisfactory or affected by the dummy confounder or whether the estimated ATT is robust to specific failure of the CIA. The testing procedure suggested by Becker and Caliendo (Citation2007) is applied to aid in the construction of Rosenbaum bounds for the sensitivity test. The results in Table suggest that the program’s impact estimators (ATTs) are insensitive to unobserved selection bias. Therefore, the ATT is due entirely to PSNP interventions.
Table 12. Rosenbaum bound for outcome for daily calorie consumption/AE
5. Conclusion
The productive safety net program aims to improve food security, stabilize assets before they accumulate, and build household and community resilience to shocks in Ethiopia’s food-insecure areas. This study examines the impact of Ethiopian PSNP on households’ food security and asset holdings taking evidence from the Gedeo administrative zone of Southern Ethiopia. We randomly collected survey data from 395 selected households. While 198 households are selected from PSNP participants, the remaining 197 households are non-PSNP beneficiaries from the intervention areas. Methodologically, we apply the propensity score matching technique to evaluate the impact of PSNP on food security and asset holdings. The food security outcome is measured by consumption expenditure, daily calorie intake, and food shortage faced by households while the asset holdings are proxied by livestock ownership and housing conditions of households.
Evaluating the impact of PSNP requires the data drawn from the same households with and without the program. However, it is practically impossible to obtain households with both states simultaneously due to the missing counterfactual data problem. To solve the problem of counterfactuals, we applied the propensity score matching (PSM) technique and estimated the average treatment effect on the treated.
The ATT results reveal the positive role of the intervention on key indicators of beneficiary households’ welfare. The welfare of beneficiary households differs significantly from the non-program group in terms of income, consumption expenditure, and caloric intake outcomes but not, significantly, in their asset accumulation status. In particular, PSNP has a significant positive impact on the food security situation and the income of beneficiary households. In terms of improving food security outcomes, participating in PSNP increased food consumption expenditure and caloric intake of beneficiaries by more than 26 and 14.5 percent, respectively. Interestingly, the magnitude of the impact on food security outcomes is meaningful, and program increases both the quantity and value of food consumed.
Our analysis also found that participation in PSNP has increased the mean income of beneficiary households. This suggests that the program can improve the livelihood opportunities of the poor. The findings, on the other hand, show that beneficiary households did not experience a significant improvement in asset holdings (as measured by livestock ownership and the quality of residential housing) after four years of PSNP exposure. The inconsequential impact of the intervention on asset holdings can be explained in terms of different reasons. First and most importantly, for chronically poor households, it is less likely for the increased income and food expenditure impact of the program to be accompanied by a significant improvement in asset holdings over a short period. For such households, asset accumulation is generally slow and may take a relatively long period. Second, notwithstanding the first argument, the possibility of disincentive effects of the program on asset accumulation cannot be ruled out. That is, to remain eligible for the program, households may be tempted to avoid investment in assets.
To summarize, evidence from our case study area suggests that social safety net programs can function, at least in terms of improving income and food security status. The findings point to a number of interesting conclusions and policy implications.
First, PSNP has enhanced the income and food security status of beneficiary households. This suggests that social protection interventions can be used as a vital tool for reversing the lingering deterioration in food security and livelihoods among poor households.
Second, PSNP has increased the value of food consumed by beneficiary households. This means that social protection interventions can improve dietary quality, thereby improving the well-being of the rural poor, as dietary quality tends to improve with increments in consumption spending.
Third, at least in our data, PSNP does not appear to have had a significant impact on increasing the asset holdings of rural households, which is a key goal of the program. Given the notion that asset accumulation in poor households is generally gradual, this suggests that the program’s impact on asset holdings appears to be a long-term phenomenon. In that sense, instead of tackling the root cause of chronic food insecurity, such as a lack of productive asset holdings, PSNP may have simply ameliorated the symptoms or proximate causes of food insecurity, such as income and food intake, in the short run. Improvements in food consumption, however, are not sufficient to help households break the vicious cycle of food insecurity and poverty. This is because, for example, the depletion of productive household assets as a result of adverse income shocks can lead to food insecurity.
Apart from the aforementioned generalizations, the data imply that other measures should be taken to improve the program’s contribution to food security and asset holdings. The intervention must be strengthened with supplementary measures that increase smallholder agriculture productivity. In this regard, efforts including encouraging participation in agricultural and off-farm livelihood activities, strengthening saving practices, and facilitating credit access are critical to maintaining the program’s positive impact on impoverished households’ welfare. Moreover, from the program’s goal point of view, the improvement in food security status shall be accompanied by a considerable increase in the beneficiaries’ asset holdings. That is, until the poor’s asset holdings improve, it is highly doubtful that the PSNP will sustainably enable households to escape food insecurity and reduce their dependency on public assistance in the long run. Therefore, encouraging beneficiary households to engage in asset-building livelihood activities and precautionary savings is central to sustainably increasing their earnings, building household-level resilience to shocks, and ensuring program graduation.
Disclosure statement
No potential conflict of interest was reported by the author(s).
Additional information
Funding
Notes on contributors

Tasew Tadesse
Tasew Tadesse(PhD) is Assistant professor of economics at the department of economics, Dilla University, Ethiopia. He received his B.A. degree from Haramaya University, MSc in development economics from Adama University and PhD in Economics from Punjabi University, India. His major research interests include impact evaluation, state and development, firm performance, inclusive growth; international trade and customs tax evasion, globalization and development; aid effectiveness in developing countries); industrialization in Africa, etc. He is an expert in quantitative research methods. His econometrics skills include applied cross-sectional, time series econometrics, panel data analysis, cost-benefit analysis techniques, etc.
Notes
1. Kebele is the smallest administrative unit in Ethiopia.
References
- Andersson, C., Mekonnen, A., Stage, J.(2009). Impacts of Ethiopia's Productive Safety Net Program on Livestock and Tree Holdings of Rural Households. EfD Discussion paper series 09-05, School of Business, Economics and Law, University of Gothenburg, Sweden:Environment for Development Initiative.
- Andersson, C., Mekonnen, A., & Stage, J. (2011). Impacts of Ethiopia’s productive safety net program on livestock and tree holdings of rural households. Journal of Development Economics, 94(1), 119–28. https://doi.org/10.1016/j.jdeveco.2009.12.002
- Bahru, B. A., Jebena, M. G., Birner, R., & Zeller, M. (2020). Impact of Ethiopia’s productive safety net program on household food security and child nutrition: A marginal structural modeling approach. SSM - Population Health, 2020(12). https://doi.org/10.1016/j.ssmph.2020.100660
- Becker, S., & Caliendo, M. (2007). Sensitivity analysis for average treatment effects. The Stata Journal, 7(1), 71–83. https://doi.org/10.1177/1536867X0700700104
- Bekele, S., & Holden, S. T. (2000). Policy instrument for sustainable land management: The case of highland smallholder in Ethiopia. Agricultural Economics, 22(3), 217–232. http://dx.doi.org/10.1016/S0169-5150(00)00046-3
- Berhane, G., Hoddinott, J., Gilligin, D., & Tafesse, S. A. (2014). Can social protection work in Africa? The impact of Ethiopia’s PRODUCTIVE SAFETY NET PROGRAMME. Economic Development and Cultural Change, 63(1), 1–26. https://doi.org/10.1086/677753
- Berhane, G., Hoddinott, J., Kumar, N., & Margolio, A. (2017). The productive safety net programme in Ethiopia: Impacts on children’s schooling, labor, and nutritional status. International Food Policy Institute.
- Brugh, K., Angelesb, G., Mvula, P., Tsoka, M., & Handa, S. (2018). Impacts of the Malawi social cash transfer program on household food and nutrition security. Food Policy, 76(2018), 19–32. http://dx.doi.org/10.1016/j.foodpol.2017.11.002
- Caliendo, M., & Kopeinig, S. (2008). Some practical guidance for the implementation of propensity score matching. Journal of Economic Surveys, 22(1), 31–72. https://doi.org/10.1111/j.1467-6419.2007.00527.x
- Filipski, M., Tylor, A. J., Abegaz, G. A., Ferede, T., Taffesse, A. S., & Diao, Z. (2017). General equilibrium impact assessment of the productive safety net program in Ethiopia. Impact evaluation report 66 International Food Policy Institute.
- Gebrehiwot, T., & Castilla, C. (2019). Do safety net transfers improve diets and reduce undernutrition? Evidence from rural Ethiopia. The Journal of Development Studies, 55(9), 1947–1966. https://doi.org/10.1080/00220388.2018.1502881
- Gilligan, D., & Hoddinott, J. (2007). Is there persistence in the impact of emergency food aid? Evidence on consumption, food security, and assets in rural Ethiopia. American Journal of Agricultural Economics, 89(2), 225–242. https://doi.org/10.1111/j.1467-8276.2007.00992.x
- Gilligan, D., Hoddinott, J., & Taffesse, A. (2009). The impact of Ethiopia’s productive safety net programme and its linkages. The Journal of Development Studies, 45(10), 1684–1706. https://doi.org/10.1080/00220380902935907
- Government of Federal Democratic Republic of Ethiopia. (2002). Food security strategy. Addis Ababa.
- Hidrobo, M., Hoddinott, J., Kumar, N., & Olivier, M. (2018). Social protection, food security, and asset formation. World Development,101(2018), 88–103. https://doi.org/10.1016/j.worlddev.2017.08.014
- Hoddinott, J., Gilligan, D., & Taffesse, A. (2009). The impact of Ethiopia’s productive safety net program on schooling and child labor. https://papers.ssrn.com/sol3/papers.cfm?Abstract_id=1412291
- Hoddinott, J., Berhane, G., Gilligan, D. O., Kumar, N., & Taffesse, A. S. (2012). The impact of Ethiopia’s productive safety net programme and related transfers on agricultural productivity. Journal of African Economies, 21(5), 761–786. https://doi.org/10.1093/jae/ejs023
- Ichino, A., Mealli, F., & Nannicini, T. (2008). From temporary help jobs to permanent employment: What can we learn from matching estimators and their sensitivity? The Journal of Applied Econometrics, 23(3), 305–327. https://doi.org/10.1002/jae.998
- Khandker, S. R., Koowal, G. B., & Samad, H. A. (2010). Handbook on impact evaluation: Quantitative method and practice. World Bank.
- Lane, F. C., To, Y. M., Shelley, K., & Henson, R. K. (2012). An illustrative example of propensity score matching with education research. Career and Technical Education Research, 37(3), 187–212. https://doi.org/10.5328/cter37.3.187
- Leuven, E., & Sianesi, B. (2003). SMATCH2: Stata module to perform full mahalanobis and propensity score matching, common support graphing, and covariate imbalance testing. Boston College, Department of Economics. Available at: http://EconPapers.repec.org/RePEc:boc:bocode:s432001
- Maitra, P., & Ray, R. (2003). The effect of transfers on household expenditure patterns and poverty in South Africa. Journal of Development Economics, 71(1), 23–49. https://doi.org/10.1016/S0304-3878(02)00132-3
- Miller, C., & Tsoka, M. (2010). Impacts on children of cash transfers in Malawi. In S. Handa, S. Devereux, & D. Webb (Eds.), Social protection for Africa’s children (pp. 91–112). Routledge.
- Ministry of Agriculture and Rural Development. (2004). Productive safety net programme: Programme implementation manual.
- Pradhan, M., & Rawlings, L. B. (2002). The impact and targeting of social infrastructure investments: Lessons from the Nicaraguan social. World Bank.
- Rosenbaum, P., & Rubin, D. (1983). The central role of the propensity score in observational studies for causal effects. Biometrika, 70(1), 41–55. https://doi.org/10.1093/biomet/70.1.41
- Sileshi, G. D. (2016). Home garden agroforestry practice in Gedeo zone, Ethiopia: A sustainable land management system for socio-economic benefit. United Nations University (UNU).
- Smith, J., & Subbarao, K. (2003). What role for safety net transfers in very low-income countries? Washington, D.C.: SP Discussion Paper 030, Washington, D.C.: World Bank.
- Smith, J. A.& Todd., P. E. (2005). Does matching overcome LaLonde's critique of non-experimental estimators? Journal of Econometrics, 125(1–2), 305–353. https://doi.org/10.1016/j.jeconom.2004.04.011
- Tadesse, K. K. (2002). Five Thousand Years of Sustainability? A Case study on Gedeo Land Use (Southern Ethiopia). Unpublished Ph.D. Dissertation, Wageningen University.
- Tadesse, G. (2018). Agriculture and social protection: The experience of Ethiopia productive safety net program. Addis Abeba: Ifpri.
- Wahba, S., & Dehejia, R. (2002). Propensity score-matching methods for non-experimental causal studies. Review of Economics and Statistics, 84(1) , 151–161. http://dx.doi.org/10.1162/003465302317331982
- Welteji, D., Kerima, M., & Kedir, H. (2017). Contribution of productive safety net for food security of rural households: In the case of Bale Zone, southeast Ethiopia. Agriculture and Food Security, 6(53), 1–11. https://doi.org/10.1186/s40066-017-0126-4
- Yamane, T.(1964). Statistics, an introductory analysis. Harper and Row ed. second. New York: Harper and Row.